Cardiovascular diseases (CVDs), in particular myocardial infarction (MI) and stroke, are among the leading causes of death and illness worldwide. One of the primary goals of CVD prevention is management of modifiable CV risk.1
While it is accepted that CVD prevention strategies should be multipronged in the presence of concomitant risk factors,1 clinical interventions often prioritize certain goals over others, as not all modifiable CV risk factors have the same importance in CVD prevention. The INTERHEART study, which included 15 152 patients with acute MI and 14 820 controls from 52 countries, showed that more than 90% of acute MI cases could be explained by 9 modifiable risk factors: abnormal lipids, smoking, hypertension, diabetes mellitus, abdominal obesity, alcohol consumption, consumption of fruit and vegetables, regular physical exercise, and psychosocial factors. The study also showed that dyslipidemia, assessed by the ratio of apoliproteins B and A1 (markers of low-density lipoprotein [LDL], very LDL, and high-density lipoprotein [HDL] particles), was the main determinant of CV risk, as it accounted for 49.5% of population-attributable risk in men and 47.1% of that in women.2
Interventions have also been found to have a greater or lesser impact on CVD prevention depending on which modifiable risk factors they target.3 There is also substantial clinical evidence that interventions targeting constituents of the lipid profile, and LDL cholesterol (LDL-C) in particular, reduce the incidence and prevalence of CVD and associated complications in patients with dyslipidemia.4 Unlike the situation with other biological variables, such as heart rate, blood pressure, and glycemia, an LDL-C threshold after which there is no reduction in CV risk has not been described,5 explaining why different LDL-C targets are recommended for different categories of CV risk. The existence of different LDL-C target levels can cause confusion in clinical practice, jeopardizing optimal treatment and posing an additional barrier to CV risk management. Stratification of lipid targets by CV risk, however, is not the only barrier to the everyday management of dyslipidemia. The various guidelines that exist describe different lipid profile values and different strategies for diagnosing and managing dyslipidemia, and in addition there are population-specific recommendations for pediatric patients, patients on antiviral therapy, and patients with diabetes mellitus or kidney failure. A PubMed search with the terms cholesterol and guideline, for example, yielded 225 publications, 11 of which were from 2016.
Information overload arising from multiple guidelines can hamper clinical decision-making, particularly when the recommendations differ. This idea is supported by the findings of a nationwide survey of 1390 general practitioners in Spain in which 71% of respondents indicated that the main barrier to the implementation of guideline recommendations was their excessive number.6 In addition, 50% were of the opinion that the treatment targets were unrealistic for routine practice. Fortunately, encouraging data showing modest to significant improvements in the lipid profile of the Spanish population have emerged from the Diet and Cardiovascular Risk in Spain (DRECE) study,7 which observed improvements in individuals aged between 20 and 60 years from 1992-1994 (DRECE 1) to 2005-2007 (DRECE 3). One of the explanations proposed for the improved profiles was the greater number of interventions applied to dyslipidemic patients identified in the first study.7
As mentioned, the continual release of new guidelines and recommendations constitutes a barrier for across-the-board clinical dyslipidemia management and may also be a source of controversy. The European Atherosclerosis Society and the European Federation of Clinical Chemistry and Laboratory Medicine8 recently published a joint consensus statement establishing the different lipid and lipoprotein concentrations that define dyslipidemias and require therapeutic intervention. The most controversial aspect of this statement was the recommendation to use nonfasting blood samples. While measurement of nonfasting lipid profiles would simplify testing for both patients and health care professionals, food intake can increase triglyceride levels to 0.34 mmoL/L (30 mg/dL) and reduce total cholesterol, LDL-C, and non-HDL-C levels to 0.2 mmoL/L (8 mg/dL). Furthermore, the Friedewald equation cannot be used to estimate LDL-C in the case of nonfasting triglyceride levels of over 4.51 mmoL/L (400 mg/dL).9 Consequently, while the recommendation to use nonfasting blood samples is practical, it could result in testing inaccuracies. The joint consensus statement recommends establishing different triglyceride targets depending on whether samples are fasting or nonfasting, and leaves it to the clinician to interpret the other variables accordingly. The above circumstances should be taken into account when recommending the conditions for lipid profile testing.
Laboratories play a key role in drawing clinicians’ attention to which lipid profile values should be considered abnormal and require further evaluation or intervention. Recommendations on which lipid profile components to include in laboratory reports, however, are also inconsistent across guidelines, particularly in relation to dyslipidemia diagnosis and management.
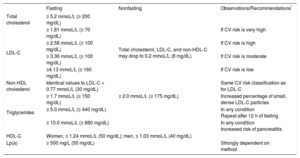
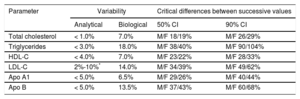
In view of the above factors, several scientific societies interested in CVD prevention and dyslipidemia diagnosis and management in both primary and specialty care settings published a joint document synthesizing the latest information on lipid profiles and calling for the use of standardized laboratory reports to facilitate the diagnosis and treatment of dyslipidemias and ultimately reduce the risk of CVD and its complications.10 The document recommends which lipid profile components should be measured and also proposes fasting and nonfasting values that should be flagged as abnormal or outside target ranges in the laboratory report (Table 1). It also provides data on intraindividual biological variability to help clinicians decide whether changes observed in lipid profile constituents over serial measurements are due to therapeutic intervention or biological variations (Table 2). We hope that this document will help standardize lipid profile reporting by laboratories and, following the identification and elimination of the main preanalytical, analytical, and postanalytical barriers, contribute to greater lipid management.
Concentrations That Should Be Flagged as Abnormal in the Lipid Report (the information in this column is intended to help clarify the reasons for the recommended levels)
| Fasting | Nonfasting | Observations/Recommendations* | |
|---|---|---|---|
| Total cholesterol | ≥ 5.2 mmoL/L (≥ 200 mg/dL) | Total cholesterol, LDL-C, and non-HDL-C may drop to 0.2 mmoL/L (8 mg/dL) | |
| LDL-C | ≥ 1.81 mmoL/L (≥ 70 mg/dL) | If CV risk is very high | |
| ≥ 2.58 mmoL/L (≥ 100 mg/dL) | If CV risk is high | ||
| ≥ 3.36 mmoL/L (≥ 100 mg/dL) | If CV risk is moderate | ||
| ≥4.13 mmoL/L (≥ 160 mg/dL) | If CV risk is low | ||
| Non-HDL cholesterol | Identical values to LDL-C + 0.77 mmoL/L (30 mg/dL) | Same CV risk classification as for LDL-C | |
| Triglycerides | ≥ 1.7 mmoL/L (≥ 150 mg/dL) | ≥ 2.0 mmoL/L (≥ 175 mg/dL) | Increased percentage of small, dense LDL-C particles |
| ≥ 5.0 mmoL/L (≥ 440 mg/dL) | In any condition Repeat after 12 h of fasting | ||
| ≥ 10.0 mmoL/L (≥ 880 mg/dL) | In any condition Increased risk of pancreatitis | ||
| HDL-C | Women, ≤ 1.24 mmoL/L (50 mg/dL); men, ≤ 1.03 mmoL/L (40 mg/dL) | ||
| Lp(a) | ≥ 500 mg/L (50 mg/dL) | Strongly dependent on method | |
CV, cardiovascular; HDL-C, high-density lipoprotein cholesterol; LDL-C, low-density lipoprotein cholesterol; Lp(a), lipoprotein(a).
Adapted with permission from Pedro-Botet et al.10
Analytical and Biological Variability in Lipid Profile Concentrations and Critical Differences Between Serial Measurements That Should Be Considered Significant
| Parameter | Variability | Critical differences between successive values | ||
|---|---|---|---|---|
| Analytical | Biological | 50% CI | 90% CI | |
| Total cholesterol | < 1.0% | 7.0% | M/F 18/19% | M/F 26/29% |
| Triglycerides | < 3.0% | 18.0% | M/F 38/40% | M/F 90/104% |
| HDL-C | < 4.0% | 7.0% | M/F 23/22% | M/F 28/33% |
| LDL-C | 2%-10%* | 14.0% | M/F 34/39% | M/F 49/62% |
| Apo A1 | < 5.0% | 6.5% | M/F 29/26% | M/F 40/44% |
| Apo B | < 5.0% | 13.5% | M/F 37/43% | M/F 60/68% |
Apo, apolipoprotein; CI, confidence interval; F, female; HDL-C, high-density lipoprotein cholesterol; LDL-C, low-density lipoprotein cholesterol; M, male.
None declared.