Several types of lipoproteins beyond low-density lipoproteins (LDL) are causally related to cardiovascular disease. We aimed to analyze an advanced lipoprotein profile in individuals with normal and impaired glucose metabolism from different cohorts of a Mediterranean region.
MethodsCross-sectional study in 929 participants (463 normoglycemia, 250 prediabetes, and 216 type 2 diabetes mellitus) with normal renal function, free from cardiovascular disease, and without lipid-lowering treatment. Conventional and advanced (nuclear magnetic resonance [NMR] spectroscopy) lipoprotein profiles were analyzed.
ResultsCompared with men, normoglycemic women showed lower serum triglyceride and LDL cholesterol concentrations, lower total LDL particles (P) as well as their subclasses and their cholesterol and triglyceride content, higher high-density lipoproteins (HDL)-P and all HDL-related variables (P≤ .05 for all comparisons). Compared with normoglycemic participants, diabetic participants showed higher large and small very LDL-P concentrations (P <.05) and lower total HDL-P and medium HDL-P concentrations (P <.05). Waist circumference and Fatty Liver Index were positively associated with a proatherogenic profile.
ConclusionsWomen had a better advanced lipoprotein profile than did men. Adiposity indexes related to insulin-resistance were positively associated with a proatherogenic lipid profile. NMR revealed altered lipoprotein particles other than LDL in participants with diabetes, frequently associated with an increased cardiovascular risk. Our findings support the usefulness of extended lipoprotein analysis by NMR spectroscopy to uncover new therapeutic targets to prevent cardiovascular events in at-risk participants.
Keywords
Atherosclerotic cardiovascular disease (CVD) and its clinical manifestations are the leading cause of morbidity and mortality globally.1 A range of clinical and genetic studies have unequivocally established that LDL is an etiopathogenetic factor in the pathophysiology of atherosclerotic CVD.2 Low-density lipoprotein cholesterol (LDL-C)- lowering therapy has been shown to reduce the rate of CVD events in participants with or without cardiometabolic risk.3 However, CVD events remain prevalent among individuals with low or normal LDL-C, a phenomenon referred to as residual risk.4 In this regard, recent studies have reported the association of different lipoprotein subclasses particle concentrations, other than LDL, with the risk of incident CVD events.5,6 Thus, it has been proposed that CVD risk may also be associated with higher concentrations of atherogenic lipoproteins, which may not be readily apparent from LDL-C concentrations.
Triglycerides (TG) are the principal components of TG-rich lipoproteins and their remnants. TG are predominantly transported by very LDL (VLDLs) and, to a lesser extent, their remnants under fasting conditions. Under postprandial conditions, circulating TG are mainly found in chylomicrons and their remnants (also defined as TG-rich lipoproteins). Compelling evidence suggests that chylomicrons and VLDL remnants are highly proatherogenic, by virtue of their progressive enrichment in cholesterol.7 There are strong and consistent epidemiologic associations between hypertriglyceridemia and TG-rich lipoproteins and incident CVD events.8 Mild to moderate hypertriglyceridemia is particularly common in participants with insulin-resistant conditions such as visceral obesity, type 2 diabetes mellitus (T2DM) and chronic kidney disease, all of them associated with an increased risk of CVD.9 In these circumstances, as well as at very low levels of LDL-C in the presence of high TGs, the calculated or directly measured LDL-C level may underestimate both the total concentration of cholesterol carried by LDL and, more importantly, underestimate the total concentration of atherogenic lipoproteins, thus underestimating the risk of atherosclerotic CVD.10 In these individuals, the typical lipid phenotype is the condition known as atherogenic dyslipidemia characterized by hypertriglyceridemia, increased concentration of small-dense LDL-P and low high-density lipoprotein (HDL)-C concentrations.11 The same lipid pattern also occurs in another clinical condition associated with an increased risk of CVD, nonalcoholic fatty liver disease (NAFLD). Persons with NAFLD show many proatherogenic changes in the lipoprotein profile.12 Therefore, assessing the lipoprotein profile beyond what is currently used in clinical practice may be important in assessing CVD risk in participants with clinical conditions such as those previously mentioned in which LDL-C is usually not elevated and show subtle defects in routine lipid panel analysis.
To the best of our knowledge, there are few data in the literature on the lipoprotein profile in participants with different degrees of impaired glucose metabolism (ie, prediabetes or T2DM) and normoglycemic participants residing in the same geographic area.
The aim of the present study was to analyze serum lipoprotein subclasses and their cholesterol and triglyceride content in normal and impaired glucose metabolism in Mediterranean participants from southern Europe.
METHODSStudy populationA total of 1217 participants, 510 with normoglycemia, 318 with prediabetes, and 389 with T2DM, were identified from different cohorts of 4 participating institutions belonging to the same health care organization in the north-northeast region of Spain. After excluding those participants who were under lipid-lowering therapy, 929 participants were analyzed (463 with normoglycemia, 250 with prediabetes, and 216 with T2DM). Normoglycemic and prediabetic groups were selected from 3 previously published cross-sectional studies13–15 (2 university hospital cohorts and one primary care cohort in Spain). The study participants with T2DM were selected from the same 2 cross-sectional studies performed at the university hospitals from where participants with normoglycemia and prediabetes were recruited. T2DM participants were recruited from the outpatient clinic of 1 of the participating centers as well as from those identified by screening patients enrolled in the diabetic eye disease program.16 Some of them were new-onset T2DM patients recruited from the outpatient clinic of the department of endocrinology.14
The inclusion criteria for all 3 groups (normoglycemic, prediabetic, and T2DM) were as follows: absence of established impaired renal function (defined as an estimate glomerular filtration rate <60mL/min/1.73 m2), and absence of known heart disease (defined as any known peripheral artery disease, stroke, heart failure, coronary artery disease, including previous myocardial infarction, angina, previous coronary artery bypass surgery, or percutaneous coronary intervention). Exclusion criteria were active lipid-lowering treatment (defined as statin or fibrate drugs) and a diagnosis of type 1 diabetes mellitus (T1DM) or suspicion of having any other specific type of diabetes secondary to genetic defects, endocrinopathies, pancreatic exocrine dysfunction or chemically-induced diabetes.
We recorded participant characteristics, anthropometric parameters, and laboratory measurements (glucose, HbA1c, TGs, total/HDL/LDL-C, creatinine, estimated glomerular filtration rate, alanine transaminase (ALT), aspartate transaminase (AST), gamma-glutamyltransferase (GGT), insulin and homeostatic Model Assessment of Insulin Resistance [HOMA-IR]). To evaluate the presence of NAFLD, the Fatty Liver Index (FLI) was also calculated in all study participants. An FLI> 60 was considered suggestive of NAFLD.
This study was conducted in accordance with the Declaration of Helsinki and was approved by the local Ethics Committees. All participants signed a written informed consent form.
Diabetes and prediabetes diagnosisIn the present study, the diagnosis of diabetes was made according to the criteria established by the American Diabetes Association. Prediabetes was also defined according to the American Diabetes Association criteria.17 We considered as prediabetic any participant who met 1 of the 2 following criteria: a) impaired fasting plasma glucose, defined as fasting plasma glucose between 100 and <126mg/dL (5.55-6.99 mmol/L), or b) HbA1c levels between 5.7% and <6.5% (39-48 mmol/mol). Participants in the normoglycemic group had fasting plasma glucose and HbA1c values below 100 mg/dL and 5.7%, respectively.
Anthropometric parameters and blood pressureParticipants’ weight, height and waist circumference were measured using standardized methods, and their blood pressure (mean of 2 measurements, 5minutes apart) was measured after 10minutes in a seated position using a blood pressure monitor (HEM-7001E, Omron, Barcelona, Spain). Body mass index (BMI) was calculated as weight (kg)/stature (m2).
Biochemistry and laboratory methodsSerum and spot urine samples were collected in the fasting state, and all serum and urine tests were performed using standard laboratory methods. LDL-C was estimated using the Friedewald formula, and estimate glomerular filtration rate was estimated using the Modification of Diet in Renal Disease-4 formula.18 HbA1c levels were determined using HPLC (Variant, Bio-Rad Laboratories SA, Spain), and its concentrations are expressed in the National Glycohemoglobin Standardization Program/Diabetes Control and Complications Trial units. Urine albumin was measured using an immunoturbidimetric method and a Roche/Hitachi Modular P analyzer (Roche Diagnostics, Spain). Insulin-resistance was assessed by homeostatic model assessment (HOMA)-IR.
NMR analysis of lipoproteinsBlood serum samples were shipped on dry ice to the Biosfer Teslab facilities (Reus, Spain) for advance lipoprotein testing by using the Liposcale test, an advanced lipoprotein test (CE) based on 2D NMR diffusion-ordered spectroscopy that enables exhaustive analysis of lipoprotein particles.19 We determined the lipid composition and the mean size (nm) for each particle class, and the particle concentration of 9 lipoprotein subclasses, namely large, medium, and small VLDL, LDL, and HDL-P. As previously described, the within-assay precision of the method for the determination of cholesterol and TG concentrations, and particle numbers for the LDL class and its small, medium, and large subclasses, is ≤ 5%. The interassay precision for the same parameters is ≤ 8%. Similarly, the within-assay and interassay precision for cholesterol and TG concentrations, and VLDL and HDL-P, are ≤ 6%. Finally, both within-assay and interassay precision for the mean particle size for each lipoprotein class is ≤ 1%.19
Statistical analysisData management and analyses were conducted using the free R statistical software version 3.6.0. Descriptive statistics are summarized with median, interquartile ranges [25th-75th], mean and standard deviation for continuous variables, or frequency and percentage for categorical variables. The Student t test or chi-square test was used to explore the differences between groups. P-values corresponding to pairwise comparisons were calculated by multiple testing with the Tukey method. Pearson correlation coefficients were computed between NMR-assessed advanced lipoprotein profiles and clinical and laboratory parameters in the normoglycemic control group. To assess the adjusted differences between groups from each lipoprotein subclass, we used multivariate regression models. The covariate variables included in the adjusted analysis were age, sex, and BMI. Furthermore, we applied multi testing correction according to the Bonferroni method to control the family-wise error rate prefixed to 0.05.
Participants were classified according to their serum concentration of LDL-P and HDL-P particles and lipid content, ie, normal and abnormal, according to previously published cutoffs in relation to CVD risk established in previous studies.20,21 Thus, the cutoffs for abnormal level of lipoprotein particle concentrations in the normoglycemic group were as follows: total LDL-P> 1300 nmol/L, and <24μmol/L for total HDL-P concentration; the LDL-C levels were considered elevated when they exceeded 130mg/dL, whereas HDL-C was considered low below 40mg/dL in men and 50mg/dL in women, respectively.
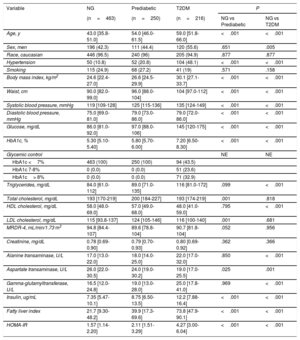
RESULTSPopulation characteristicsSerum lipoprotein particle concentrations were analyzed in 929 participants. From this cohort, 463 (49.8%) were participants with normoglycemia, 250 (26.9%) were participants with prediabetes, and 216 (23.3%) were participants with T2DM. A descriptive analysis of clinical and analytical variables by group is shown in table 1. Compared with the normoglycemic control group, participants with prediabetes and T2DM groups were older, had higher BMI and waist circumference, and a higher percentage had hypertension. They also had a higher fasting plasma glucose and insulin, HbA1c and a higher median HOMA-IR. Regarding the lipid profile, there were some differences in fasting cholesterol subclasses across the 3 groups, with lower serum HDL-C concentrations in participants with T2DM compared with normoglycemic participants and higher serum LDL-C in the prediabetic group than in the normoglycemic group.
Descriptive analysis of clinical variables by group
| Variable | NG | Prediabetic | T2DM | P | |
|---|---|---|---|---|---|
| (n=463) | (n=250) | (n=216) | NG vs Prediabetic | NG vs T2DM | |
| Age, y | 43.0 [35.8-51.0] | 54.0 [46.0-61.5] | 59.0 [51.8-66.0] | <.001 | <.001 |
| Sex, men | 196 (42.3) | 111 (44.4) | 120 (55.6) | .651 | .005 |
| Race, caucasian | 446 (96.5) | 240 (96) | 205 (94.9) | .877 | .877 |
| Hypertension | 50 (10.8) | 52 (20.8) | 104 (48.1) | <.001 | <.001 |
| Smoking | 115 (24.9) | 68 (27.2) | 41 (19) | .571 | .158 |
| Body mass index, kg/m2 | 24.6 [22.4-27.0] | 26.6 [24.5-29.9] | 30.1 [27.1-33.7] | <.001 | <.001 |
| Waist, cm | 90.0 [82.0-99.0] | 96.0 [88.0-104] | 104 [97.0-112] | <.001 | <.001 |
| Systolic blood pressure, mmHg | 119 [109-128] | 125 [115-136] | 135 [124-149] | <.001 | <.001 |
| Diastolic blood pressure, mmHg | 75.0 [69.0-81.0] | 79.0 [73.0-86.0] | 79.0 [72.0-86.0] | <.001 | <.001 |
| Glucose, mg/dL | 86.0 [81.0-92.0] | 97.0 [88.0-106] | 145 [120-175] | <.001 | <.001 |
| HbA1c, % | 5.30 [5.10-5.40] | 5.80 [5.70-6.00] | 7.20 [6.50-8.30] | <.001 | <.001 |
| Glycemic control | NE | NE | |||
| HbA1c <7% | 463 (100) | 250 (100) | 94 (43.5) | ||
| HbA1c 7-8% | 0 (0.0) | 0 (0.0) | 51 (23.6) | ||
| HbA1c> 8% | 0 (0.0) | 0 (0.0) | 71 (32.9) | ||
| Triglycerides, mg/dL | 84.0 [61.0-112] | 89.0 [71.0-135] | 116 [81.0-172] | .099 | <.001 |
| Total cholesterol, mg/dL | 193 [170-219] | 200 [184-227] | 193 [174-219] | .001 | .818 |
| HDL cholesterol, mg/dL | 58.0 [48.0-69.0] | 57.0 [49.0-68.0] | 48.0 [41.0-59.0] | .795 | <.001 |
| LDL cholesterol, mg/dL | 115 [93.8-137] | 124 [105-146] | 116 [100-140] | .001 | .681 |
| MRDR-4, mL/min/1.73 m2 | 94.8 [84.4-107] | 89.6 [78.8-104] | 90.7 [81.8-104] | .052 | .956 |
| Creatinine, mg/dL | 0.78 [0.69-0.90] | 0.79 [0.70-0.93] | 0.80 [0.69-0.92] | .362 | .366 |
| Alanine transaminase, U/L | 17.0 [13.0-22.0] | 18.0 [14.0-25.0] | 22.0 [17.0-32.0] | .850 | <.001 |
| Aspartate transaminase, U/L | 26.0 [22.0-30.5] | 24.0 [19.0-30.2] | 19.0 [17.0-25.5] | .025 | .001 |
| Gamma-glutamyltransferase, U/L | 16.5 [12.0-24.8] | 19.0 [13.0-28.0] | 25.0 [17.8-41.0] | .969 | <.001 |
| Insulin, ug/mL | 7.35 [5.47-10.1] | 8.75 [6.50-13.5] | 12.2 [7.88-16.4] | <.001 | <.001 |
| Fatty liver index | 21.7 [9.30-48.2] | 39.9 [17.3-69.6] | 73.8 [47.9-90.1] | <.001 | <.001 |
| HOMA-IR | 1.57 [1.14-2.20] | 2.11 [1.51-3.29] | 4.27 [3.00-6.04] | <.001 | <.001 |
HBA1c, glycosylated hemoglobin; HDL, high-density lipoproteins; HOMA-IR, homeostatic model assessment of insulin resistance; LDL, low-density lipoproteins; NE, not evaluated; NG, normoglycemic; T2DM, type 2 diabetes mellitus.
Results are expressed as median [25th-75th] for continuous variables and No. (%) for categorical variables.
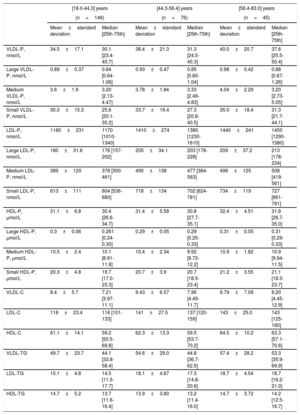
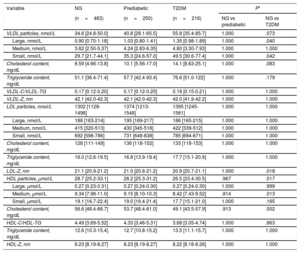
Table 2 and table 3 describe the lipoprotein values according to the age range in both sexes. The analysis of the whole normoglycemic group showed a significant increase of several lipid parameters with increasing age with a P trend <.001 for total cholesterol, P <.01 for LDL-C, P <.001 for total LDL-P, P <.001 for large LDL-P, P <.001 for medium LDL-P and P <.001 for small LDL-P. HDL particles also increased with increasing age: P=.03 for total HDL-P and P <.001 for medium HDL-P. Interestingly, the increase in age was more marked in younger and middle-aged age ranges than between middle-aged and older age ranges.
Lipoprotein values according to the age terciles in women
| [18.0-44.3] years | [44.3-56.4] years | [56.4-83.0] years | ||||
|---|---|---|---|---|---|---|
| (n=146) | (n=76) | (n=45) | ||||
| Mean±standard deviation | Median [25th-75th] | Mean±standard deviation | Median [25th-75th] | Mean±standard deviation | Median [25th-75th] | |
| VLDL-P, nmol/L | 34.5±17.1 | 30.1 [23.4-40.7] | 38.4±21.3 | 31.3 [24.5-45.3] | 40.0±20.7 | 37.6 [25.5-50.4] |
| Large VLDL-P, nmol/L | 0.89±0.37 | 0.84 [0.64-1.06] | 0.93±0.47 | 0.85 [0.60-1.04] | 0.98±0.42 | 0.88 [0.67-1.26] |
| Medium VLDL-P, nmol/L | 3.6±1.9 | 3.20 [2.13-4.47] | 3.78±1.84 | 3.33 [2.49-4.83] | 4.04±2.29 | 3.20 [2.73-5.05] |
| Small VLDL-P, nmol/L | 30.0±15.3 | 25.6 [20.1-35.2] | 33.7±19.4 | 27.3 [20.8-40.5] | 35.0±18.4 | 31.3 [21.7-44.1] |
| LDL-P, nmol/L | 1180±231 | 1170 [1010-1340] | 1410±274 | 1380 [1230-1610] | 1440±241 | 1450 [1290-1580] |
| Large LDL-P, nmol/L | 180±31.6 | 176 [157-202] | 205±34.1 | 203 [178-228] | 209±37.2 | 213 [178-234] |
| Medium LDL-P, nmol/L | 389±120 | 378 [300-461] | 490±138 | 477 [384-563] | 499±125 | 508 [419-561] |
| Small LDL-P, nmol/L | 613±111 | 604 [536-680] | 718±134 | 702 [624-781] | 734±119 | 727 [661-791] |
| HDL-P, μmol/L | 31.1±6.8 | 30.4 [26.6-34.7] | 31.4±5.58 | 30.8 [27.7-35.1] | 32.4±4.51 | 31.8 [28.7-35.0] |
| Large HDL-P, μmol/L | 0.3±0.06 | 0.261 [0.24-0.30] | 0.29±0.05 | 0.29 [0.25-0.33] | 0.31±0.05 | 0.31 [0.29-0.33] |
| Medium HDL-P, μmol/L | 10.5±2.4 | 10.1 [8.91-11.8] | 10.4±2.34 | 9.92 [8.72-12.2] | 10.9±1.82 | 10.9 [9.94-11.5] |
| Small HDL-P, μmol/L | 20.3±4.8 | 19.7 [17.0-23.3] | 20.7±3.9 | 20.7 [18.5-23.4] | 21.2±3.55 | 21.1 [18.3-23.7] |
| VLDL-C | 8.4±5.7 | 7.21 [3.97-11.1] | 9.43±6.57 | 7.96 [4.49-11.7] | 9.79±7.09 | 8.20 [4.45-12.9] |
| LDL-C | 118±23.4 | 116 [101-133] | 141±27.5 | 137 [120-159] | 143±25.0 | 143 [125-160] |
| HDL-C | 61.1±14.1 | 59.2 [50.5-69.8] | 62.3±13.3 | 59.5 [53.7-70.2] | 64.5±10.2 | 63.3 [57.1-70.6] |
| VLDL-TG | 49.7±23.7 | 44.1 [33.8-58.4] | 54.6±29.0 | 44.8 [36.7-62.5] | 57.4±28.2 | 53.3 [35.9-69.9] |
| LDL-TG | 15.1±4.8 | 14.5 [11.5-17.7] | 18.1±4.67 | 17.3 [14.8-20.6] | 18.7±4.54 | 18.7 [16.2-21.0] |
| HDL-TG | 14.7±5.2 | 13.7 [11.6-16.4] | 13.9±3.80 | 13.2 [11.4-16.0] | 14.7±3.72 | 14.2 [12.5-16.7] |
HDL, high-density lipoprotein; HDL-C, high-density lipoprotein cholesterol; LDL, low-density lipoprotein; LDL-C, low-density lipoprotein cholesterol; VLDL, very low-density lipoprotein.
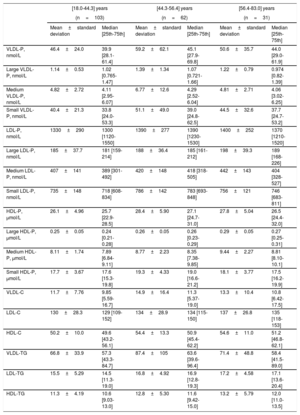
Lipoprotein values according to the age tertiles in men.
| [18.0-44.3] years | [44.3-56.4] years | [56.4-83.0] years | ||||
|---|---|---|---|---|---|---|
| (n=103) | (n=62) | (n=31) | ||||
| Mean±standard deviation | Median [25th-75th] | Mean±standard deviation | Median [25th-75th] | Mean±standard deviation | Median [25th-75th] | |
| VLDL-P, nmol/L | 46.4±24.0 | 39.9 [28.1-61.4] | 59.2±62.1 | 45.1 [27.9-69.8] | 50.6±35.7 | 44.0 [29.0-61.9] |
| Large VLDL-P, nmol/L | 1.14±0.53 | 1.02 [0.765-1.47] | 1.39±1.34 | 1.07 [0.721-1.66] | 1.22±0.79 | 0.974 [0.82-1.39] |
| Medium VLDL-P, nmol/L | 4.82±2.72 | 4.11 [2.95-6.07] | 6.77±12.6 | 4.29 [2.52-6.04] | 4.81±2.71 | 4.06 [3.02-6.25] |
| Small VLDL-P, nmol/L | 40.4±21.3 | 33.8 [24.0-53.3] | 51.1±49.0 | 39.0 [24.8-62.5] | 44.5±32.6 | 37.7 [24.7-53.2] |
| LDL-P, nmol/L | 1330±290 | 1300 [1120-1550] | 1390±277 | 1390 [1230-1530] | 1400±252 | 1370 [1210-1520] |
| Large LDL-P, nmol/L | 185±37.7 | 181 [159-214] | 188±36.4 | 185 [161-212] | 198±39.3 | 189 [168-226] |
| Medium LDL-P, nmol/L | 407±141 | 389 [301-492] | 420±148 | 418 [318-505] | 442±143 | 404 [328-527] |
| Small LDL-P, nmol/L | 735±148 | 718 [608-834] | 786±142 | 783 [693-848] | 756±121 | 746 [683-811] |
| HDL-P, μmol/L | 26.1±4.96 | 25.7 [22.9-28.5] | 28.4±5.90 | 27.1 [24.7-31.0] | 27.8±5.04 | 26.5 [24.4-32.0] |
| Large HDL-P, μmol/L | 0.25±0.05 | 0.24 [0.21-0.28] | 0.26±0.05 | 0.26 [0.23-0.29] | 0.29±0.05 | 0.27 [0.25-0.31] |
| Medium HDL-P, μmol/L | 8.11±1.74 | 7.89 [6.84-9.11] | 8.77±2.23 | 8.35 [7.38-9.85] | 9.44±2.27 | 8.81 [8.10-10.1] |
| Small HDL-P, μmol/L | 17.7±3.67 | 17.6 [15.3-19.8] | 19.3±4.33 | 19.0 [16.6-21.2] | 18.1±3.77 | 17.5 [16.2-19.9] |
| VLDL-C | 11.7±7.76 | 9.85 [5.59-16.7] | 14.9±16.4 | 11.3 [5.37-19.0] | 13.3±10.4 | 10.8 [6.42-17.5] |
| LDL-C | 130±28.3 | 129 [109-152] | 134±28.9 | 134 [115-150] | 137±26.8 | 135 [118-153] |
| HDL-C | 50.2±10.0 | 49.6 [43.2-56.1] | 54.4±13.3 | 50.9 [45.4-62.2] | 54.6±11.0 | 51.2 [46.8-62.1] |
| VLDL-TG | 66.8±33.9 | 57.3 [43.3-84.7] | 87.4±105 | 63.6 [39.6-96.4] | 71.4±48.8 | 58.4 [41.5-89.0] |
| LDL-TG | 15.5±5.29 | 14.5 [11.3-19.0] | 16.8±4.92 | 16.9 [12.8-19.3] | 17.2±4.58 | 17.1 [13.6-20.4] |
| HDL-TG | 11.3±4.19 | 10.6 [9.03-13.0] | 12.8±5.30 | 11.6 [9.42-15.0] | 13.2±5.79 | 12.0 [11.0-13.5] |
HDL, high-density lipoprotein; HDL-C, high-density lipoprotein colesterol; LDL, low-density lipoprotein; LDL-C, low-density lipoprotein colesterol; VLDL, very low-density lipoprotein
Lipoprotein profile was strongly dependent on the participants’ sex. Compared with men, women had lower mean serum TG and LDL-C concentrations (82.5mg/dL vs 114mg/dL, P=.001; 110mg/dL vs 118mg/dL, P=.010, respectively). In line with serum TG, women showed concomitantly lower concentrations of VLDL-P and lipids, accompanied by elevated concentrations of HDL-P and lipids (P <.001 for all comparisons except for medium VLDL-P, which was P=.010). LDL characteristics also showed significant sex-related differences. Compared with men, total concentrations of LDL-P and small LDL-P were significantly lower in women (1256 [697-11 981] vs 1319 [572-12 179] nmol/L; P=.014; 638 [324-1047] nmol/L vs 735 [401-1171]; P <.001, respectively). Similarly, serum concentrations of non-HDL-P, including VLDL-P and LDL-P, were significantly lower in women than in men (P=.001). Women also showed lower cholesterol and TG content in VLDL particles and higher cholesterol and TG content in HDL particles ().
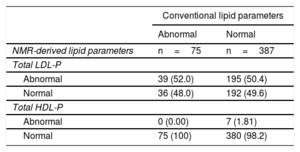
Only 75 out of 462 normoglycemic participants (16%) showed abnormal values for both HDL-C (with values <40mg/dL in men and <50mg/dL in women) and LDL-C (with values> 130mg/dL), with the rest of the participants (84%) showing normal values for both parameters. Interestingly, among normoglycemic participants with normal LDL-C and HDL-C, nearly 50% showed higher than recommended LDL-P concentrations (50.4% with high levels of total LDL-P). In contrast, only 1.8% of normoglycemic participants showed lower than recommended HDL-P concentrations (table 4).
Conventional vs NRM-derived lipoprotein particle concentrations in the normoglycemic group
| Conventional lipid parameters | ||
|---|---|---|
| Abnormal | Normal | |
| NMR-derived lipid parameters | n=75 | n=387 |
| Total LDL-P | ||
| Abnormal | 39 (52.0) | 195 (50.4) |
| Normal | 36 (48.0) | 192 (49.6) |
| Total HDL-P | ||
| Abnormal | 0 (0.00) | 7 (1.81) |
| Normal | 75 (100) | 380 (98.2) |
HDL, high-density lipoprotein; HDL-C, high-density lipoprotein cholesterol; LDL, low-density lipoprotein; LDL-C, low-density lipoprotein cholesterol.
The data are presented as No. (%).
Data regarding lipoprotein particles is lacking in 1 participant due to the absence of LDL-C and HDL-C values in this participant.
Abnormal NMR-derived lipid parameters: total LDL-P> 1300 nmol/L, and <24μmol/L for total HDL-P concentration.
Abnormal conventional lipid parameters: LDL-C> 130mg/dL, HDL-C <40mg/dL in men and, <50mg/dL in women.
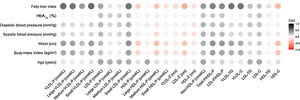
Figure 1 shows the correlation between different NMR-derived lipoprotein characteristics and different clinical variables. The most notable observations were that FLI, waist circumference and BMI were positively related to VLDL-related characteristics (total number, size and cholesterol and TG content), LDL-P small subclass and non-HDL-P. The same clinical variables were inversely related to total HDL-P, medium, and small subclasses, as well as their cholesterol content.
Lipoprotein particles values in T2DM and prediabetes and comparison with the normoglycemic control group
The comparison between lipoprotein subclass sizes between the normoglycemic, prediabetic and T2DM groups are shown in table 5. Multivariate analysis (adjusted for age, gender, and BMI) showed that almost all the VLDL subclasses were significantly higher in participants with T2DM than in normoglycemic participants, with higher serum concentrations of large and small VLDL-P (P=.040 and P=.042, respectively). No significant differences in the LDL-P distribution were observed when comparing the 3 groups. Furthermore, we found a statistically significant reduction in LDL size (LDL-Z) in participants with T2DM compared with that of normoglycemic participants (P=.018). There was a trend toward a higher content of cholesterol in VLDL particles in participants with T2DM than in normoglycemic participants (P=.083). Regarding HDL-related characteristics, total HDL-P levels in the T2DM group were lower than in the normoglycemic group (P=.017), especially medium particles (P=.013). Median cholesterol content in HDL-P was concomitantly lower in participants with T2DM than in controls (P=.002).
Comparison between lipoprotein subclass sizes between normoglycemic, prediabetic and T2DM group
| Variable | NG | Prediabetic | T2DM | P* | |
|---|---|---|---|---|---|
| (n=463) | (n=250) | (n=216) | NG vs prediabetic | NG vs T2DM | |
| VLDL particles, nmol/L | 34.6 [24.8-50.0] | 40.8 [28.1-65.5] | 55.8 [35.4-85.7] | 1.000 | .073 |
| Large, nmol/L | 0.90 [0.70-1.18] | 1.03 [0.80-1.41] | 1.35 [0.98-1.89] | 1.000 | .040 |
| Medium, nmol/L | 3.62 [2.50-5.37] | 4.24 [2.83-6.35] | 4.80 [3.30-7.93] | 1.000 | 1.000 |
| Small, nmol/L | 29.7 [21.7-44.1] | 35.3 [24.6-57.0] | 49.5 [30.6-77.4] | 1.000 | .042 |
| Cholesterol content, mg/dL | 8.59 [4.66-13.8] | 10.1 [5.56-17.0] | 14.1 [8.63-25.1] | 1.000 | .083 |
| Triglyceride content, mg/dL | 51.1 [36.4-71.4] | 57.7 [42.4-93.4] | 76.6 [51.0-122] | 1.000 | .179 |
| VLDL-C/VLDL-TG | 0.17 [0.12-0.20] | 0.17 [0.12-0.20] | 0.18 [0.15-0.21] | 1.000 | 1.000 |
| VLDL-Z, nm | 42.1 [42.0-42.3] | 42.1 [42.0-42.3] | 42.0 [41.9-42.2] | 1.000 | 1.000 |
| LDL particles, nmol/L | 1302 [1128-1498] | 1374 [1213-1548] | 1395 [1245-1561] | 1.000 | 1.000 |
| Large, nmol/L | 188 [163-214] | 195 [169-217] | 186 [165-215] | 1.000 | 1.000 |
| Medium, nmol/L | 415 [320-513] | 430 [345-518] | 422 [339-512] | 1.000 | 1.000 |
| Small, nmol/L | 692 [598-786] | 731 [648-838] | 785 [694-871] | 1.000 | 1.000 |
| Cholesterol content, mg/dL | 128 [111-149] | 136 [118-152] | 133 [118-153] | 1.000 | 1.000 |
| Triglyceride content, mg/dL | 16.0 [12.6-19.5] | 16.8 [13.9-19.4] | 17.7 [15.1-20.9] | 1.000 | 1.000 |
| LDL-Z, nm | 21.1 [20.9-21.2] | 21.0 [20.8-21.2] | 20.9 [20.7-21.1] | 1.000 | .018 |
| HDL particles, μmol/L | 28.7 [25.2-33.1] | 28.2 [25.3-31.2] | 26.5 [23.4-30.5] | .967 | .017 |
| Large, μmol/L | 0.27 [0.23-0.31] | 0.27 [0.24-0.30] | 0.27 [0.24-0.30] | 1.000 | .999 |
| Medium, μmol/L | 9.34 [7.98-11.0] | 9.15 [8.10-10.3] | 8.42 [7.43-9.52] | .814 | .013 |
| Small, μmol/L | 19.1 [16.7-22.4] | 19.0 [16.4-21.4] | 17.7 [15.1-21.0] | 1.000 | .165 |
| Cholesterol content, mg/dL | 56.6 [48.4-66.7] | 53.7 [48.4-61.0] | 49.1 [43.5-57.9] | .913 | .002 |
| HDL-C/HDL-TG | 4.49 [3.69-5.52] | 4.33 [3.46-5.31] | 3.68 [3.05-4.74] | 1.000 | .863 |
| Triglyceride content, mg/dL | 12.6 [10.3-15.4] | 12.7 [10.8-15.2] | 13.5 [11.1-15.7] | 1.000 | 1.000 |
| HDL-Z, nm | 8.23 [8.19-8.27] | 8.23 [8.19-8.27] | 8.22 [8.18-8.26] | 1.000 | 1.000 |
HDL, high-density lipoprotein; LDL, low-density lipoprotein; NG, normoglycemic; T2DM, type 2 diabetes mellitus; VLDL, very low-density lipoprotein.
Results are expressed as median [25th-75th].
The present study reports the advanced characteristics of circulating lipoproteins, assessed by NMR spectroscopy, in a large number of participants with different degrees of impaired glucose metabolism without previous CVD events not receiving lipid-lowering treatment. The main findings were that in normoglycemic participants, female sex was strongly associated with an improved lipoprotein profile. Women also showed lower cholesterol content in VLDL particles compared with men. Interestingly, nearly 50% of normoglycemic participants with apparently normal conventional lipid values showed abnormal LDL-P concentrations. In addition, compared with normoglycemic participants, participants with T2DM showed abnormal levels of lipoprotein particles other than LDL, such as HDL and VLDL-P concentrations, reported to be associated with increased CV risk. Of note, participants with T2DM showed a marginal trend toward a higher cholesterol content in VLDL particles.
To our knowledge, few studies have reported lipoprotein subclass particle concentrations and their cholesterol and TG content in a large sample of participants residing in the same geographical area. Notably, none of them has been performed in a representative Mediterranean region. In the present study, LDL-P and HDL-P concentrations increased with age, with the increase being more marked in women. This result concurs with previously reported studies showing that LDL-P concentrations show a stronger correlation with age among women than among men.22 In contrast, in concordance with previously published studies, the increase in LDL-P concentrations observed with increasing age was more evident between young- and middle-aged participants than in middle- and older participants.23 Finally, similar to a recently published study, total HDL-P in women increased with age.24 This study suggested that, although the absolute number of HDL-P increases with age in women, their ability to promote the cholesterol efflux capacity from macrophages is compromised with increasing age.24 The latter is entirely consistent with the current notion that HDL function, rather than HDL-C quantity, may be the target for future HDL therapies for CVD. On the other hand, in line with previous reports,22 our data support the notion that female sex is strongly associated with an improved advanced lipoprotein profile compared with men. Indeed, women had a lower total amount of atherogenic particles (ie, VLDL-P and LDL-P) and significantly increased concentrations of antiatherogenic particles (ie, HDL-P). In agreement with previous studies,25 we found that both BMI and waist circumference were positively correlated with proatherogenic alterations in the NMR-assessed lipoprotein subclass profile, with a positive correlation with VLDL-P-related variables and LDL-P, especially smaller particles. Interestingly, nearly 50% of normoglycemic participants with normal conventional lipid parameters and without previous CVD showed abnormal lipoprotein subclass concentrations, mostly attributed to the LDL subclasses. These results are similar to those reported in a recent study.21 Notably, a similar phenotype has been associated with an increased CVD risk.26
An atherogenic lipoprotein profile is frequently observed in participants with abdominal obesity25 and in NAFLD.12 Consistently, in the present study both BMI and waist circumference as well as FLI were positively associated with proatherogenic lipoproteins, particularly VLDL-P and LDL-P-related characteristics, especially the smaller particles, and were negatively associated with the antiatherogenic HDL-P.
In the present study, the results obtained in normoglycemic participants were compared with those of participants with impaired glucose metabolism. In T2DM, increased hepatic secretion of large TG-rich VLDL and impaired clearance of VLDL appears to be of central importance in the pathophysiology of atherogenic dyslipidemia.27 Indeed, it has been described that lipoprotein subclass alterations can be attributed primarily to the underlying insulin-resistance.28 Our results are in general consistent with those of prior studies,29 as we also identified that in T2DM participants the serum concentrations of HDL-P, particularly the medium HDL subclass, was reduced compared with the control group, while VLDL-P, both large and small subclasses, were increased. The reductions in smaller and medium HDL could be, at least in part, explained by an improper biogenesis and initial enlargement of diabetic HDL-P. On the other hand, as previously reported in other studies,30 in the present study, there is a trend toward a higher content of cholesterol in VLDL-P in participants with T2DM compared with normoglycemic participants. This is concordant with the increase in the activity of cholesteryl ester transfer protein reported in participants with T2DM.31 We found no differences in HDL-TG concentrations or the HDL-C/HDL-TG ratio between T2DM and normoglycemic participants. However, it should be pointed out that in T2DM, there was a lower HDL-C/HDL-TG ratio than in normoglycemic participants after adjustment for age, sex, and BMI (P <.001). These differences disappeared after the multi testing adjustment. It is probable that with a larger number of participants, the differences in the content of HDL-TG and HDL-C/HDL-TG became more evident. Because we found no differences in the lipoprotein profile of prediabetic individuals compared with normoglycemic individuals, this could be attributed to the lower degree of insulin-resistance observed in the prediabetic participants in our study, which is reflected by their low HOMA-IR index values. Finally, this study had a clinically relevant proportion of participants with LDL-C concentrations that would justify statin therapy. However, some of these participants are not treated with statins because study participants belong to different cross-sectional cohorts from different levels of care and have already been shown not to be optimally managed in daily-clinical practice.32
LimitationsOur findings should be interpreted within the context of some potential limitations. First of all, we could not distinguish participants with an impaired fasting glucose from those with impaired glucose tolerance (IGT) among the prediabetic group since study participants did not undergo an oral glucose tolerance test. This may be important because distinct lipoprotein and apolipoprotein changes in individuals with impaired fasting plasma glucose and IGT have been reported, with the latter being associated with lipoprotein changes similar to those previously described in insulin-resistance.33 The authors hypothesized that these differences could be the result of distinct pathophysiologic mechanisms in these distinctive states of glucose tolerance, which may be related to the site of insulin-resistance (skeletal muscle or hepatic). Another limitation is that all T2DM participants were recruited mainly from the outpatient clinic, and there may have been a selection bias toward including healthier patients with fewer complications than in the general T2DM population.
CONCLUSIONSOur results show a better antiatherogenic lipoprotein profile in women than in men. BMI and FLI are important factors positively associated with a proatherogenic profile in normoglycemic participants. T2DM participants showed lower concentrations of total HDL-P and medium HDL-P and increased VLDL-P concentrations, mainly due to the smaller subclass, compared with the normoglycemic group. Changes in these lipoprotein subclasses highlight the potential importance of this subtype of lipoproteins, which are associated with CVD risk and are not currently a target of therapeutic intervention or a tool for CVD risk prediction. These issues highlight the need for new tools, such as lipoprotein profile assessed by NMR, to better characterize the CVD risk. This approach offers a more detailed approach to profound lipid abnormalities. It may therefore help to better characterize CVD risk profile, especially in populations at high risk of CVD, such as those with T2DM and visceral obesity in which LDL-C appears unreliable to guide therapy for atherosclerosis prevention completely.
FUNDINGThis work was supported by grants from the Carlos III National Institute of Health (ISCIII) (PI11/1723, PI15/0625 and PI18/0328), Marató TV3 Foundation (303/C/2016) and the European Regional Development Fund (ERDF). CIBERDEM and CIBEROBN are an initiative of ISCIII, Spain.
AUTHORS’ CONTRIBUTIONSD. Mauricio and N. Alonso conceived, designed and supervised the study. M. Falguera, M. Hernández, M. Barranco-Altirriba, and B. Soldevila participated in patient and material collection. C. Puig-Jové, A. Teis, J. Julve, and N. Alonso interpreted the results. C. Puig-Jové, and E. Castelblanco drafted the manuscript and contributed equally to this study. D. Mauricio, N. Alonso, N. Amigó, J. Franch-Nadal, and E. Ortega revised and edited the manuscript. All the authors revised the manuscript and gave their final approval of the submitted version.
CONFLICTS OF INTERESTN. Amigó is a stockholder of and serves on the board of directors of Biosfer Teslab, a diagnostic laboratory company that performed the lipoprotein analyses described herein. The remaining authors declare they have nothing to disclose regarding conflict of interest with respect to this manuscript.
- -
Several types of lipoproteins apart from LDL-C are causally related to CVD.
- -
Conventional LDL-C levels underestimate the total concentration of cholesterol carried by LDL and, more importantly, the total concentration of atherogenic lipoproteins, thus underestimating the risk of atherosclerotic CVD.
- -
Hyperglycemia and insulin-resistance are the cause of proatherogenic changes in lipoprotein profile.
- -
Participants with T2DM show altered lipoprotein particles other than LDL.
- -
Nearly 50% of participants with normal LDL-C and HDL-C values show an altered lipoprotein profile, mainly LDL particles.
- -
Women have a better overall advanced lipoprotein profile than men.
- -
Waist circumference and FLI are positively associated with a proatherogenic lipoprotein profile.
We want to particularly acknowledge the patients and the IGTP-HUGTP and IRBLleida (B.0000682) Biobanks integrated in the Spanish National Biobanks Network of ISCIII (PT17/0015/0045 and PT17/0015/0027, respectively).
Supplementary data associated with this article can be found in the online version available at https://doi.org/10.1016/j.rec.2021.02.006