To determine the degree of control of patients on anticoagulants in follow-up in primary care in Galicia and investigate whether time in therapeutic range as estimated using the number of acceptable controls is comparable with the estimation using the Rosendaal method.
MethodsTransversal study that included patients older than 65 years, diagnosed with nonvalvular atrial fibrillation, on anticoagulants for at least 1 year. Control was considered good when the time in therapeutic range was greater than 65%, estimated by the Rosendaal method, or 60% estimated by the number of acceptable controls.
ResultsWe enrolled 511 patients (53.0% women; mean [standard deviation] age, 77.8 [0.6] years). Overall, 41.5% of the patients were in therapeutic range at fewer than 60% of the controls and 42.7% spent less than 65% of follow-up in therapeutic range, as estimated with the Rosendaal method. In the group of patients with poor control, we observed more drugs (6.8 [0.4] vs 5.7 [0.3]; P<.0001), greater presence of kidney disease (24.3% vs 17.0%; P=.05), and higher HAS-BLED scores (3.8 [0.1] vs 2.5 [0.1]; P<.0001). The cutoff of 60% for number of acceptable controls had a sensitivity and specificity of 79.4% and 86.7%, respectively, with an area under the curve of 0.92 (95%CI, 0.87-0.97).
ConclusionsMore than 40% of patients on anticoagulants do not reach the minimum time in therapeutic range to benefit from anticoagulation. The factors associated with worse control were kidney disease and high risk of cerebral hemorrhage. The 2 methods of estimation are comparable.
Keywords
Of the chronic diseases, atrial fibrillation (AF) represents one of the most important global health problems in view of its elevated prevalence (8.5% in individuals > 65 years of age),1 morbidity, and mortality.2 The fact that AF is also a leading cause of hospital admission3 and the main indication for anticoagulation in primary health care4 further contributes to its importance. Moreover, the impact of AF will continue to grow as the population ages,5 particularly if it is confirmed that approximately 20% of patients > 60 years have AF but are not diagnosed, as suggested by some studies.6
The risk of AF-associated stroke, the main cause of mortality and morbidity,7 varies according to the presence of other risk factors. In clinical practice, we can estimate this risk using scales such as the CHADS2 (congestive heart failure, hypertension, age, diabetes, stroke [doubled])8 or CHA2DS2-VASc (congestive heart failure, hypertension, age ≥ 75 [doubled], diabetes, stroke [doubled]-vascular disease and sex category [female]),9 where scores of ≥ 2 in a patient with AF are a recommendation for anticoagulation.10 Anticoagulation with vitamin K antagonists (VKA) has been shown to reduce the incidence of thromboembolic events by 64% and mortality by 26%.11 However, anticoagulation with VKA is subject to major limitations, the most important being the variability in clinical response even though the international normalized ratio (INR) should be kept between 2 and 3 to ensure the effectiveness of these drugs.12 However, several environmental factors (diet, drugs, etc) and genetic factors have an influence on the therapeutic effect and often the INR lies outside the established range,13 thereby exposing the patients to the risk of thrombotic events or bleeding.14
The launch in recent years of new anticoagulants with fewer drug-drug and environmental interactions, broader therapeutic range, proven efficacy and safety at least similar to those of VKA, and good cost-effectiveness in patients with poor INR control15 has prompted the Spanish health authorities to recommend these new agents in these patients.16
We have no information on the degree of control of patients on anticoagulants in the Spanish National Health System in Galicia. Therefore, this study was conducted to provide information on the degree of control in patients in follow-up for INR in health care centers in the autonomous region of Galicia. As secondary objectives, we aimed to analyze variables that might influence the degree of control and study whether number of acceptable controls is comparable with the Rosendaal method as a means for estimating the time in therapeutic range (TTR).
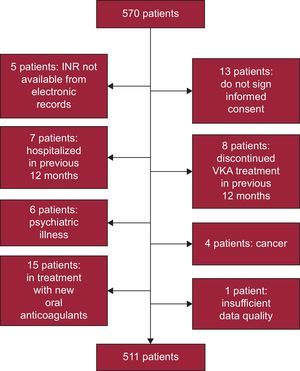
METHODSPatientsThis was a cross-sectional study of a sample stratified by district, sex, and age group using data provided by the Galician Institute for Statistics.17 The required sample size was 327 patients, assuming a population of 632 379 individuals aged over 65 years, a prevalence of nonvalvular AF of 8.5%, level of confidence of 95%, precision of 3%, and drop-out rate of 15%. To ensure that the sample was representative of populated places with few inhabitants (which account for more than 50% of the population over 65 years in Galicia), patients were first assigned in these places and then the proportion of patients in the samples in larger towns was obtained; a sample size of 570 patients was included. After 59 were excluded (Figure 1), a final sample size of 511 patients was obtained. This sample was distributed as follows: 59.3% in rural areas (< 5000 inhabitants), 21.9% in semiurban areas (5000-20 000 inhabitants), and 18.8% in urban areas (> 20 000 inhabitants).

Patients aged > 65 years and diagnosed with nonvalvular AF in treatment with VKA for at least 12 months prior to inclusion were selected. Patients were excluded if anticoagulant treatment had been interrupted during these 12 months or if the patients had been admitted to hospital (except for visits to the emergency room). Patients with serious psychiatric disease (schizophrenia or bipolar disorder) or cancer were also excluded. The study protocol was approved by the Ethics Committee for Clinical Research in Galicia.
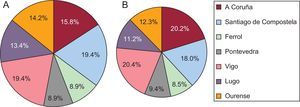
Participating investigators were identified through their local department of labor, according to the territorial distribution of the predesigned sample. Only 3 investigators declined to participate; these were replaced by another 3 colleagues from the same local department. Between October 1 and 31, 2013, the participating investigators selected their patients consecutively from those who attended their clinic for a regular appointment for any reason other than control and dosing of VKA, and checked that they met the inclusion and exclusion criteria. Investigators continued enrollment until reaching their preassigned target number of patients. Figure 2 shows the distribution of patients of the participating investigators by health district.
Data Collection
The following variables were recorded: demography (age, sex, council, and district), medical history (hypertension, diabetes mellitus, dyslipidemia, alcohol abuse, smoking, ischemic heart disease, heart failure, cerebrovascular disease, kidney failure, peripheral artery disease, and systemic embolism; in addition, the date of each event was recorded), current clinical data (weight, height, waist circumference, INR controls in past year and dates, systolic and diastolic blood pressure, blood glucose, glycated hemoglobin, creatinine, urea and glomerular filtration rate, glutamic oxaloacetic transaminase, glutamic pyruvic transaminase, gamma-glutamyl transferase, alkaline phosphatase, bilirubin, total cholesterol, low-density lipoprotein cholesterol, high-density lipoprotein cholesterol, triglycerides, nonsteroidal antiinflammatory agents, antiplatelet agents, and number of usual pharmacological treatments), and type of VKA anticoagulant (acenocumarol or warfarin). Scores on the CHADS2 (cutoff ≥ 2), CHA2DS2-VASc (cutoff ≥ 2), and HAS-BLED (hypertension, abnormal renal/liver function, stroke, bleeding history or predisposition, labile international normalized ratio, elderly [> 65 years], drugs/alcohol concomitantly) (cutoff ≥ 3) were calculated using these data.
Patients with a body mass index (BMI) ≥ 30kg/m2 or more were classified as obese. A waist circumference > 102 cm (men) and > 88 cm (women) was considered as abdominal obesity.18 A patient was defined as diabetic, hypertensive,, or dyslipidemic when he or she was diagnosed as such in the electronic medical records, met the diagnostic criteria, or was taking oral antidiabetic, antihypertensive or cholesterol lowering medication.18–20 Smokers were defined as individuals who smoked tobacco (cigarettes, cigars, or pipes, at least 1 per month) in the month prior to inclusion. Former smokers were defined as patients who had not smoked in the past year.21 High alcohol consumption was detected through clinical interview; high consumption was noted when the daily intake was more than 4 units (40g) for men and 3 units (30g) for women.22 History of cardiovascular disease (ischemic heart disease, heart failure, cerebrovascular disease, or peripheral artery disease) were recorded when a history of admission to hospital or visit to the emergency room for any of these conditions was reflected in the electronic medical records.19 Finally, preclinical kidney disease was defined as glomerular filtration rate, estimated using the MDRD formula, < 60 mL/min/1.73 m2 with normal serum creatinine (< 1.2mg/dL for women and <1.3mg/dL for men); chronic kidney disease was defined as glomerular filtration rate, estimated using the MDRD formula, < 60mL/min/1.73 m2 and elevated serum creatinine (> 1.2mg/dL for women and > 1.3mg/dL for men).19,23
Data AnalysisThe statistical package G-STAT 2.0 for Windows was used for processing and analyzing data. The sample size was calculated using the EPIDAT 3.1 program for Windows.
Both the Rosendaal method24 and the percentage of controls outside the therapeutic window were used to calculate TTR. Both methods are recognized as valid according to the recommendations of the Spanish Ministry of Health for estimating the degree of control in patients on VKA anticoagulants,16 although the Rosendaal method was used for the bivariate and multivariate analysis. This method uses a linear interpolation to assign an INR value for each day between 2 observed values of INR. Periods longer than 56 days were not interpolated. After interpolation, the percentage time with INR between 2 and 3 was calculated.24
In the statistical analysis of the variables, different descriptive parameters were used: mean (standard deviation), median [interquartile range], and percentages. In the bivariate analysis, the chi-square test, Student t test, and analysis of variance or equivalent nonparametric tests were used for non-normal data (Mann-Whitney U test or Kruskall-Wallis test). The normal distribution of the variables was analyzed using the Kolmogorov-Smirnov test and testing for homoscedasticity.
Logistic regression was used to determine which variables were associated with poor control. Candidate variables were those that showed significance in the bivariate analysis or those that had been reported to show an association with control of INR in previous studies: sex, age, BMI, hypertension, type 2 diabetes mellitus, kidney failure (estimated using MDRD), number of drugs, CHADS2, CHA2DS2-VASc, HAS-BLED, and staff charged with validating the INR.
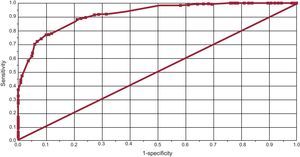
In addition, a ROC (receiver operating characteristic) curve was calculated to identify the best cutoff for determining poor control estimated with the number of acceptable controls, with the Rosendaal method as reference. A curve with an area under the curve > 0.90 was considered valid.
All results were presented as means and 95% confidence interval (95%CI), rounded to 1 decimal place, although no rounding was used in the calculation. Statistical significance was set at P<.05.
RESULTSSample CharacteristicsThe 134 participating investigators provided data from 511 patients, of whom 271 (53.0%) were women. The mean age of the sample was 77.8 (0.6) years. Table 1 presents the clinical and epidemiological characteristics of the patients in the sample. The most prevalent risk factors were hypertension (79.8%), which was poorly controlled in 25.4%, abdominal obesity (70.3%); dyslipidemia (53.6%), which was poorly controlled in 20.7%, and diabetes mellitus (26.3%), which was poorly controlled in 11.0%. The most frequent cardiovascular conditions were heart failure (22.9%), ischemic heart disease (18.0%), and kidney failure (16.9%). Laboratory determination of glomerular filtration rate (calculated using the MDRD formula) showed prevalences of kidney failure of 20.6% and subclinical kidney disease of 19.2%. There were no statistically significant differences in clinical and epidemiological variables between the different health districts (Table 1).
Clinical Characteristics of the Patients Included in the Sample and According to Degree of Control of International Normalized Ratio
| Valid, no. | All | Good control | Poor control | P | |
|---|---|---|---|---|---|
| Patients, no. | 511 | 293 | 217 | ||
| Main characteristics | |||||
| Age, mean (SD), y | 511 | 77.9 (0.6) | 78.0 (0.8) | 77.7 (1.1) | .63 |
| Weight, mean (SD), kg | 505 | 77.4 (1.4) | 77.5 (1.9) | 77.3 (2.1) | .19 |
| Height, mean (SD), m | 500 | 1.6 (0.1) | 1.6 (0.1) | 1.6 (0.1) | .95 |
| BMI, mean (SD) | 500 | 29.9 (0.5) | 30.0 (0.6) | 29.7 (0.7) | .49 |
| Waist circumference, mean (SD), cm | 417 | 101.9 (1.3) | 102.4 (1.8) | 101.3 (1.9) | .39 |
| Systolic blood pressure, mean (SD), mmHg | 485 | 129.7 (1.5) | 129.2 (1.9) | 130.4 (2.5) | .45 |
| Diastolic blood pressure, mean (SD), mmHg | 485 | 73.4 (0.9) | 73.2 (1.24) | 73.7 (1.3) | .56 |
| Cardiovascular risk factors | |||||
| Overweight | 500 | 233 (46.6) | 136 (47.6) | 97 (45.3) | |
| Obesity | 500 | 214 (42.8) | 119 (41.6) | 95 (44.4) | .82 |
| Abdominal obesity | 417 | 293 (70.3) | 171 (71.9) | 122 (68.2) | .41 |
| Hypertension | 511 | 408 (79.8) | 230 (78.5) | 178 (81.7) | .38 |
| Type 2 diabetes mellitus | 510 | 134 (26.3) | 69 (23.6) | 65 (30.0) | .10 |
| Dyslipidemia | 511 | 274 (53.6) | 150 (51.2) | 124 (56.9) | .20 |
| Alcohol abuse | 510 | 15 (2.9) | 5 (1.7) | 10 (4.6) | .05 |
| Smoking habit | 510 | 12 (2.4) | 5 (1.7) | 7 (3.2) | .26 |
| Former smoker | 510 | 75 (14.7) | 40 (13.7) | 35 (16.1) | .43 |
| Associated clinical disease | |||||
| Ischemic heart disease | 510 | 92 (18.0) | 46 (15.7) | 46 (21.2) | .11 |
| Heart failure | 510 | 117 (22.9) | 59 (20.1) | 58 (26.7) | .08 |
| Kidney failure | 510 | 86 (16.9) | 38 (13.0) | 48 (22.1) | .006 |
| Cerebrovascular disease | 510 | 75 (14.7) | 42 (14.3) | 33 (15.2) | .78 |
| Peripheral artery disease | 510 | 33 (6.5) | 11 (3.8) | 22 (10.1) | .004 |
| Systemic embolism | 510 | 21 (4.1) | 15 (5.1) | 6 (2.8) | .19 |
| Laboratory parameters | |||||
| Blood glucose, mean (SD), mg/dL | 507 | 108.6 (2.8) | 107.7 (3.9) | 109.8 (4.1) | .45 |
| HbA1c, mean (SD), % | 213 | 6.5 (0.2) | 6.4 (0.2) | 6.5 (0.2) | .70 |
| Total cholesterol, mean (SD), mg/dL | 500 | 180.3 (1.8) | 181.8 (4.7) | 178.2 (5.3) | .32 |
| LDL-C, mean (SD), mg/dL | 420 | 103.8 (3.6) | 104.5 (4.5) | 103.0 (5.8) | .69 |
| HDL-C, mean (SD), mg/dL | 424 | 54.7 (1.5) | 53.9 (2.3) | 55.3 (2.1) | .38 |
| Triglycerides, mean (SD), mg/dL | 474 | 119.8 (3.1) | 115.9 (6.9) | 125.1 (10.4) | .13 |
| Creatinine, mean (SD), mg/dL | 506 | 1.1 (0.1) | 1.0 (0.1) | 1.1 (0.1) | .06 |
| Urea, mean (SD) | 506 | 56.9 (2.3) | 53.5 (2.6) | 61.5 (4.1) | .0007 |
| GFR, mean (SD), MDRD, mL/min/1.73 m2 | 506 | 67.7 (2.1) | 68.7 (2.6) | 66.4 (3.4) | .27 |
| GOT, mean (SD), U/L | 423 | 26.2 (1.1) | 26.1 (1.2) | 26.2 (2.0) | .91 |
| GPT, mean (SD), U/L | 463 | 25.9 (1.4) | 25.9 (1.7) | 25.9 (2.3) | .92 |
| GGT, mean (SD), U/L | 428 | 46.7 (4.9) | 42.5 (5.5) | 52.3 (8.9) | .05 |
| AP, mean (SD), U/L | 340 | 175.1 (8.6) | 166.4 (10.3) | 185.9 (14.4) | .02 |
| Bilirubin, mean (SD), mg/dL | 251 | 0.7 (0.1) | 0.8 (0.1) | 0.7 (0.1) | .34 |
AP, alkaline phosphatase; BMI, body mass index; HDL-C, high-density lipoprotein cholesterol; GGT, gamma-glutamyl transferase; GOT, glutamic oxaloacetic transaminase; GFR, glomerular filtration rate; GPT, glutamic pyruvic transaminase; HbA1c, glycated hemoglobin; LDL-C, low-density lipoprotein cholesterol; MDRD, Modification of Diet in Renal Disease; SD, standard deviation.
Unless otherwise indicated, values expressed as no. (%) or mean (standard deviation).
The mean duration of INR follow-up was 10.6 (0.4) months, with a mean of 13.7 (0.2) measurements per patient. The most widely prescribed VKA was acenocoumarol (98.2%), while warfarin was less frequently used (1.8%). Overall, 89.6% of the investigators had other patients receiving new oral anticoagulants among their patients. The professionals most frequently responsible for validating the VKA regimen were hematologists (46.4% of cases) and primary care physicians (35.4% of cases). In 18.2% of cases, validation was shared by both levels of care.
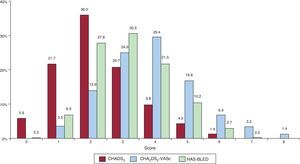
Mean scores on the thrombotic and hemorrhagic risk scales were 2.3 (0.1) for CHADS2, 3.8 (0.1) for CHA2DS2-VASc, and 3.1 (0.1) for HAS-BLED (Figure 3). Overall, 72.4% of the patients according to the CHADS2, 96.5% according to the CHA2DS2-VASc, and 65.2% according to the HAS-BLED were considered as high risk.
 by score on each risk scale. CHADS2, congestive heart failure, hypertension, age, diabetes, stroke (doubled); CHA2DS2-VASc, congestive heart failure, hypertension, age ≥ 75 (doubled), diabetes, stroke (doubled)-vascular disease and sex category (female); HAS-BLED, hypertension, abnormal renal/liver function, stroke, bleeding history or predisposition, labile international normalized ratio, elderly (> 65 years), drugs/alcohol concomitantly.")
Distribution of patients (percentage) by score on each risk scale. CHADS2, congestive heart failure, hypertension, age, diabetes, stroke (doubled); CHA2DS2-VASc, congestive heart failure, hypertension, age ≥ 75 (doubled), diabetes, stroke (doubled)-vascular disease and sex category (female); HAS-BLED, hypertension, abnormal renal/liver function, stroke, bleeding history or predisposition, labile international normalized ratio, elderly (> 65 years), drugs/alcohol concomitantly.
Overall, 41.5% of the patients were in therapeutic range at fewer than 60% of the controls and 42.7% had a TTR of < 65% calculated by the Rosendaal method. Table 1 shows the clinical and epidemiological characteristics according to the degree of control. No statistically significant differences were observed between the 2 groups, except a greater number of drugs were used (6.8 [0.4] vs 5.7 [0.3]; P<.0001) in the group of patients with poor control. In the case of kidney disease estimated by the MDRD formula, the degree of control was found to be lower in patients with chronic kidney disease than in those with normal kidney function (48.1% vs 60.9%, P=.05).
Analysis of the thrombotic risk scales did not show statistically significant differences between the 2 groups, either in the case of CHADS2 (2.2 [0.1] vs 2.3 [0.1]) or CHA2DS2-VASc (3.8 [0.1] vs 3.9 [0.1]). In contrast, the patients with poor control of INR had a higher risk of bleeding as determined by the HAS-BLED score (3.8 [0.1] vs 2.5 [0.1]; P<.0001).
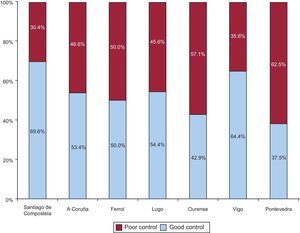
Finally, statistically significant differences were found between patients with poor control according to their corresponding health district (P=.0008) (Figure 4). The analysis of the variables potentially associated with poorer control in each district showed a greater prevalence of kidney disease in A Coruña (62.1%; P<.0001), a greater number of drugs in Lugo (7.3 [0.8]; P=.0036), and lower use of new oral anticoagulants in Pontevedra (83.3%; P=.0015). No differences were observed in the scores on the thrombotic and bleeding risk scales in the other health districts.
Methods for Determining Degree of Control
The degree of overlap between the 2 methods of measurement was assessed. In total, 254 patients (49.7%) had good control and 173 (33.8%) had poor control according to both methods; discrepancies were found between the methods of measurement in 84 (16.4%). Using the Rosendaal method as the reference standard and 65% as the cutoff, the corresponding sensitivity and specificity of the alternative method (counting the number of acceptable controls) were 79.4% and 86.7%, respectively, with an area under the curve of 0.92 (95%CI, 0.87-0.97) for a cutoff of 60% (Figure 5).
Variables Associated With Poor Control of International Normalized Ratio
In the multivariate analysis (Table 2), the risk of poor control was 9.24-fold higher in patients with high HAS-BLED scores, 2.42-fold higher in diabetics, 1.27-fold higher in patients with kidney disease, and 1.17-fold higher in patients with hypertension, compared to patients without these diseases or risk scores.
Variables Associated with Time in Therapeutic Range
| Variable | OR (95%CI) | P |
|---|---|---|
| HAS-BLED | 9.24 (6.15-13.9) | <.0001 |
| Type 2 diabetes mellitus | 2.42 (1.21-4.84) | .01 |
| Kidney disease | 1.27 (1.15-1.50) | <.0001 |
| Hypertension | 1.17 (1.08-1.37) | .01 |
| Body mass index | 0.93 (0.89-0.98) | .01 |
95%CI, 95% confidence interval; HAS-BLED, hypertension, abnormal renal/liver function, stroke, bleeding history or predisposition, labile international normalized ratio, elderly (> 65 years), drugs/alcohol concomitantly; OR, odds ratio.
The results of the ANFAGAL (ANticoagulación en pacientes con Fibrilación Auricular en el ámbito de atención primaria de GALicia) study, which included a broad sample of patients on anticoagulants representative of the Galician population attended in primary care, show that 42.7% of patients who were receiving VKA were not in the therapeutic range sufficiently long to benefit from anticoagulant treatment.
The Galician patients on anticoagulants for AF were representative in terms of demographic and clinical characteristics. All patients attended primary health care centers for control and follow-up of their VKA treatment. The clinical characteristics of patients included in the ANFAGAL study are similar to those of other studies conducted in patients with AF in Spain.25
Calculation of TTR using the Rosendaal method is a measure of the quality of anticoagulation for patients in treatment with VKA.26 Values > 65% are considered acceptable.27 This method was used throughout the study to assess the degree of control in the sample of patients and to identify variables that might impact that control. The degree of control obtained was in agreement with results from larger studies with samples from clinical practice, which reported values between 45%28 and 75.8%.29 Comparison of our results with those from Spanish studies, such as FIATE,25 shows a lower degree of control in our patients, although the objective was different (study of the suitability of treatment in patients with AF), and the degree of control was assessed according to the last 3 INR measurements, while noting that the prevalence and CHADS2 —variables related to TTR—in the sample of that study were lower than in our study.
Registries such as VARIA30 and ATRIA31 have studied the variables that influence the degree of INR control. The VARIA study showed that certain serious conditions that shorten life expectancy, such as cancer or dementia, and hospital admissions were associated with a worse degree of control.30 Patients with some of these conditions were excluded from our study, as their effect on the degree of control is beyond the role of primary care. However, other variables, such as excessive alcohol consumption and the total number of drugs taken, identified in that cohort of>120000 patients coincide with the findings of our study.
The ATRIA study analyzed in detail the influence of other cardiovascular variables on the prognosis of patients with AF and their influence on the degree of control. The study found that the variables that comprise the CHADS28 and CHA2DS2-VASc9 scales have an impact on poor control and, as in our study, kidney failure has a prominent role. Kidney failure of course has a negative impact in its own right on cardiovascular prognosis of patients with AF.
We did not find any studies that analyze the influence of a bleeding risk scale on the degree of INR control. In our study, we used the HAS-BLED scale32 to quantify this risk. We observed that patients at greater risk of bleeding also had poorer control. This finding has almost immediate implications in clinical practice, because these patients are the ones who most stand to benefit from the use of the new oral anticoagulants, given that the 3 launched so far have shown a lower risk than VKA for intracranial bleeding.33
Regarding the variables associated with poor control of INR, the multivariate analysis confirmed the influence of higher scores on the HAS-BLED scale, kidney disease, and other cardiovascular risk factors such as diabetes mellitus and hypertension.
Finally, from the standpoint of Spanish clinical practice, it is interesting to explore the agreement between the 2 methods for estimating TTR. The Rosendaal method, on the one hand, identifies the time a patient is within the therapeutic range and is the most orthodox method and generally the method of choice. On the other, the number of controls outside therapeutic range is much more practical in the clinic and equally accepted by Spanish health authorities for estimating TTR.16 The analysis undertaken showed that both methods agreed in 83.5% of patients in the sample. Of particular interest are the results of the ROC curve analysis, which showed a cutoff of 60% in the number of controls is equivalent to 65% according to the Rosendaal method.
LimitationsThe limitations of this study are those inherent in any observational study, as some variables of the physical examination and blood and urine analyses were obtained from the medical records. In addition, lack of treatment adherence was not assessed as a cause of poor control. However, the aim of the ANFAGAL study was to determine the degree of INR control in everyday clinical practice. For these purposes, we consider the sample used (in terms of size, representation, and selection) and the method of analysis are sufficiently robust and that the results can be considered as reasonably representative of patients on anticoagulants in follow-up in primary care in Galicia.
CONCLUSIONSIn the ANFAGAL study, more than 40% of patients on anticoagulants do not reach the minimum quality of anticoagulation. In addition, patients with kidney disease and a high risk of cerebral bleeding had worse control. Finally, the method for assessing TTR by counting the number of acceptable controls is as effective as the Rosendaal method, which is more tedious and often requires use of a computer.
CONFLICTS OF INTERESTS. Cinza-Sanjurjo has received honoraria as an adviser to Almirall and Pfizer. He has also received honoraria as a speaker from Almirall, Bayer, Boehringer Ingelheim, and Pfizer.
We would like to thank all the participating investigators for providing the necessary data, as well as Bayer S.A. and Almirall S.A. for providing the necessary infrastructure. We also thank the following staff at the Complejo Hospitalario Universitario in Santiago de Compostela for their support and advice that served to improve the ANFAGAL project: Miguel Blanco González, head of the stroke unit; José Castillo Sánchez, head of the neurology department; Alfonso Varela Román and Pilar Mazón Ramos, associate specialists in the cardiology department, and José Ramón González-Juanatey, head of the cardiology department.
Supplementary material associated with this article (list of collaborators and grants received) can be found in the online version available at doi:10.1016/j.rec.2014.04.018.