The increase in the incidence of hypertension in children can be attributed to the rising prevalence of obesity. The objective is to analyze the impact of overweight and the degree or distribution of adiposity on blood pressure levels in a population of Spanish schoolchildren.
MethodsA cross-sectional study was carried out in 1511 schoolchildren between 6 years and 16 years of age. We measured weight, height, waist circumference, subcutaneous skinfolds, and blood pressure. Nutritional categories were established on the basis of body mass index, waist-to-height ratio, and percent body fat. According to the National High Blood Pressure Education Program Working Group, subjects whose blood pressure was above the 90th percentile of the standard normal distribution were considered to have high blood pressure.
ResultsIn all, 3.17% of the boys and 3.05% of the girls had high blood pressure. According to odds ratio analysis, the risk of high blood pressure increased in individuals with a body mass index indicative of obesity (7.87-fold in boys, 12.32-fold in girls), with a percent body fat>97th percentile (6.98-fold in boys, 18.51-fold in girls), or with a waist-to-height ratio≥0.5 (10.56-fold in boys, 7.82-fold in girls).
ConclusionsOverweight and obesity increase the risk of high blood pressure in children between 6 years and 16 years of age, although the risk level varies depending on the amount and distribution of adipose tissue. Anthropometric indicators of relative adiposity and fat distribution are especially useful in the identification of children and adolescents with high blood pressure.
Keywords
High blood pressure (HBP) is the most common component of the metabolic syndrome,1–3 and a recent review underlines its relevance in the development of cardiovascular diseases.4 Although there are relatively few studies on the prevalence of HBP in the pediatric population, a number of articles shed light on the changes taking place. McCarron et al.5 reported a decrease in the incidence of childhood HBP in the United States between 1963 and 1988. However, this trend was reversed in the 1990s and in 2002 HBP was detected in 3.3% of Caucasians, 4.2% of African Americans, and 4.6% of Mexican Americans aged between 8 and 17 years.6
In the opinion of certain experts,7 the rise in the prevalence of HBP in children and adolescents is attributable to the parallel increase in obesity. A number of studies in the United States8 and other geographically and ethnically distant countries, such as Venezuela,9,10 Canada,11 Mexico,12 China,13,14 and Spain,15 support this idea. On the other hand, the results of epidemiological studies involving medium or long-term follow-up confirm that early HBP is a determining factor for the development and poor outcome of cardiovascular disease in adults.16–19 This finding is evidence of the importance of detecting childhood HBP before the complications of this condition lead to health problems later in life.
In this context, the objective of this report is to analyze the association between overweight and the degree or distribution of adiposity, on the one hand, and the blood pressure (BP) measurements, on the other, in Spanish schoolchildren and at the same time to explore the extent to which the anthropometric indicators of body composition are useful for the identification of individuals at risk for HBP in a pediatric population.
METHODSWe performed a cross-sectional study involving 692 boys and 819 girls aged between 6 and 16 years. The data was collected from 2004 to 2008 in 12 schools in the city of Madrid, Spain, in which the socioeconomic characteristics of the student body ranked in the intermediate level in terms of parental occupation and educational level (28.93% were college graduates, 31.07% were high school or vocational school graduates, and 40% had a primary education). The primary and secondary schools included were those that showed an interest in participating in the project, with the support of the Education Department of the Community of Madrid. We required the informed consent of the parents or guardians, in accordance with the Helsinki Declaration20 Organic Law 15/1999, of December 13, for the Protection of Personal Data. In all, 97% of the schoolchildren to whom the study was proposed chose to participate; in the remaining 3%, consent was not given and the reasons for refusal to take part were not provided. The exclusion criterion was the presence of any chronic disease, including diagnosed HBP, a situation that affected 4 children.
We measured the weight (kg), height (cm), waist circumference (WC) (cm), and skinfold thicknesses (bicipital, tricipital, subscapular, and suprailiac subcutaneous adipose tissue) (mm), employing approved anthropometric instruments in accordance with the protocols of the International Biological Programme21 and the International Society for the Advancement of Kinanthropometry.22 BP was measured after a 10-min rest, using a Riester mercury sphygmomanometer and stethoscope. With the patient in a sitting position with back support, feet flat on the floor, and right arm extended, systolic blood pressure (SBP) and diastolic blood pressure (DBP) were measured using, as reference, Korotkoff phases I and V, respectively. The measurements were performed 3 times because, generally, the pressures tended to stabilize as the child became accustomed to the method and his or her unease decreased; the lowest of the 3 values was considered valid. In those cases in which the BPs were high, the parents or guardians were informed and a visit to the pediatrician or family physician was recommended.
As classification criteria, we used the tables from the RICARDIN study (Riesgo Cardiovascular en la Infancia [Cardiovascular Risk in Children]).23 In accordance with the recommendations of the National High Blood Pressure Education Program Working Group,24 we considered normotensive those children with BP levels below the 90th percentile of the standard normal distribution, and those considered to be prehypertensive or hypertensive because their SBP and/or DBP exceeded this threshold were grouped in the HBP category. This cutoff point (SBP and/or DBP≥90th percentile) is also that proposed by Cook et al.25 to define the metabolic syndrome in children.
The waist-to-height ratio (WHtR) was calculated by dividing the WC by the height and the body mass index (BMI) by dividing the weight (in kilograms) by the height squared (in meters). The sum of the 4 skinfold thicknesses was computed and the percent body fat (%BF) was determined using the Siri equation,26 once the density had been estimated by applying the equation proposed by Brook27 or that of Durnin and Hahaman.28 Each subject was classified as being of normal weight, overweight, or obese employing dual criteria: the standards of Cole et al.29 and the tables of Marrodán et al.,30 which depict the distribution of %BF according to percentiles among Spanish children and adolescents. Taking into account the utility of the WHtR for the identification of abdominal obesity in the pediatric population,31 the children were classified into 2 groups using a cutoff point for the WHtR of 0.5 or over.
In the series involving boys and girls, the prevalence of HBP was analyzed in each of the categories established on the basis of BMI, %BF, and WHtR, evaluating the degree of association by calculating the odds ratio and using the χ2 test. Likewise, when the sample was classified according to sex and age group (6-11 years and 12-16 years), we estimated the means (standard deviation) of the SBP and DBP in the different nutritional categories. For comparisons, we used the Student t test and ANOVA (analysis of variance), followed by the post hoc Bonferroni test. Correlation analysis of BP and anthropometric measures was performed using sex and age as control variables. To evaluate the simultaneous effect of the anthropometric indicators on BP, we applied a multivariate binary logistic regression model, considering the presence of HBP as a dependent variable and indicators of size (BMI), relative adiposity (%BF), and fat distribution (WHtR) as independent variables, together with the age, sex, and socioeconomic categories, estimated from the average of the scores assigned to the educational level and profession of the parents, a method adapted from the Graffer scale.32 To minimize the effect of collinearity, the continuous variables were centered. The Hosmer-Lemeshow test was applied to verify goodness-of-fit and the receiver operating characteristic curve was calculated. Statistical analyses were performed using the SPSS 19.0 statistical software package.
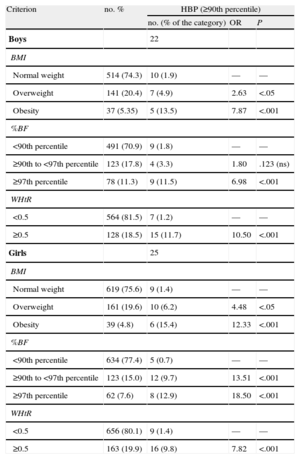
RESULTSThe prevalence of HBP was 3.17% in the boys and 3.05% in the girls. However, the children with HBP were not randomly distributed across the nutritional categories. As indicated by the odds ratios (Table 1), the boys and girls whose BMI identified them as being overweight or obese had a significantly higher risk of HBP than those with normal weight. With respect to relative adiposity, the risk of HBP was also significantly higher in boys above the 97th percentile and girls whose %BF was above the 90th percentile with respect to their peers in percentiles below those thresholds. Concerning the WHtR, in those children in whom this measurement was above the cutoff point of 0.5, the risk of HBP was 10.5-fold higher in boys and 7.82-fold higher in girls.
Prevalence of High Blood Pressure in Schoolchildren From Madrid, Spain, According to Nutritional Category
| Criterion | no. % | HBP (≥90th percentile) | ||
| no. (% of the category) | OR | P | ||
| Boys | 22 | |||
| BMI | ||||
| Normal weight | 514 (74.3) | 10 (1.9) | — | — |
| Overweight | 141 (20.4) | 7 (4.9) | 2.63 | <.05 |
| Obesity | 37 (5.35) | 5 (13.5) | 7.87 | <.001 |
| %BF | ||||
| <90th percentile | 491 (70.9) | 9 (1.8) | — | — |
| ≥90th to <97th percentile | 123 (17.8) | 4 (3.3) | 1.80 | .123 (ns) |
| ≥97th percentile | 78 (11.3) | 9 (11.5) | 6.98 | <.001 |
| WHtR | ||||
| <0.5 | 564 (81.5) | 7 (1.2) | — | — |
| ≥0.5 | 128 (18.5) | 15 (11.7) | 10.50 | <.001 |
| Girls | 25 | |||
| BMI | ||||
| Normal weight | 619 (75.6) | 9 (1.4) | — | — |
| Overweight | 161 (19.6) | 10 (6.2) | 4.48 | <.05 |
| Obesity | 39 (4.8) | 6 (15.4) | 12.33 | <.001 |
| %BF | ||||
| <90th percentile | 634 (77.4) | 5 (0.7) | — | — |
| ≥90th to <97th percentile | 123 (15.0) | 12 (9.7) | 13.51 | <.001 |
| ≥97th percentile | 62 (7.6) | 8 (12.9) | 18.50 | <.001 |
| WHtR | ||||
| <0.5 | 656 (80.1) | 9 (1.4) | — | — |
| ≥0.5 | 163 (19.9) | 16 (9.8) | 7.82 | <.001 |
%BF, percent body fat; BMI, body mass index; HBP, high blood pressure; ns, not significant; OR, odds ratio; WHtR, waist-to-height ratio.
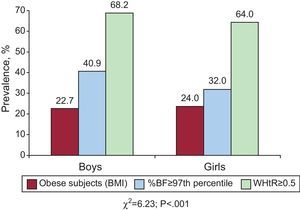
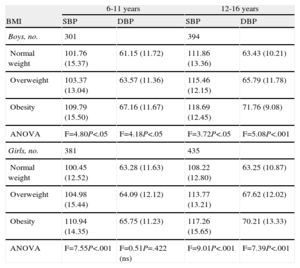
The influence of an excess of adiposity and its distribution is demonstrated in the Figure; the proportion of subjects with HBP with a WHtR of 0.5 or higher or a %BF in the 97th percentile or higher was greater than the group with a BMI indicating obesity. The association between size, adiposity, and BP was again confirmed when ANOVA was applied to the comparison of the means in the nutritional categories (Table 2): in both age groups (6-11 years and 12-16 years), boys who were overweight had significantly higher mean SBP and DBP. In the girls, the results were practically identical, although in those aged 6 to 11 years, the difference in DBP did not reach statistical significance.

Mean Systolic and Diastolic Blood Pressure Values (mmHg) According to Age Group and Nutritional Status Based on Body Mass Index
| 6-11 years | 12-16 years | |||
| BMI | SBP | DBP | SBP | DBP |
| Boys, no. | 301 | 394 | ||
| Normal weight | 101.76 (15.37) | 61.15 (11.72) | 111.86 (13.36) | 63.43 (10.21) |
| Overweight | 103.37 (13.04) | 63.57 (11.36) | 115.46 (12.15) | 65.79 (11.78) |
| Obesity | 109.79 (15.50) | 67.16 (11.67) | 118.69 (12.45) | 71.76 (9.08) |
| ANOVA | F=4.80P<.05 | F=4.18P<.05 | F=3.72P<.05 | F=5.08P<.001 |
| Girls, no. | 381 | 435 | ||
| Normal weight | 100.45 (12.52) | 63.28 (11.63) | 108.22 (12.80) | 63.25 (10.87) |
| Overweight | 104.98 (15.44) | 64.09 (12.12) | 113.77 (13.21) | 67.62 (12.02) |
| Obesity | 110.94 (14.35) | 65.75 (11.23) | 117.26 (15.65) | 70.21 (13.33) |
| ANOVA | F=7.55P<.001 | F=0.51P=.422 (ns) | F=9.01P<.001 | F=7.39P<.001 |
ANOVA, analysis of variance; BMI, body mass index; DBP, diastolic blood pressure; ns, not significant; SBP, systolic blood pressure.
Values expressed as mean (standard deviation), unless otherwise indicated.
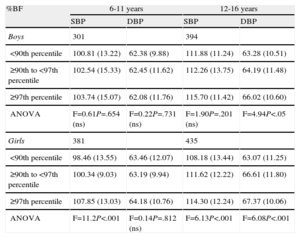
In both age groups, the mean SBP and DBP increased according to the relative adiposity, although among the boys, the increase only reached statistical significance for the DBP in those aged 12 to 16 years (Table 3). In addition, the Bonferroni test demonstrated that the differences were significant from the 90th percentile and higher. In the girls, it was more evident that the increase in BP was parallel to that of the %BF, and the difference between the averages corresponding to the different percentiles was significant, with the exception of the DBP in those aged 6 to 11 years. In this case, the post hoc test for the comparison of means showed that the SBP became significantly higher at the 90th percentile and above, whereas the upward trend in the DBP was significant from the 97th percentile of %BF on.
Mean Systolic and Diastolic Blood Pressure Values (mmHg) According to Age Group and Nutritional Category Based on Percent Body Fat
| %BF | 6-11 years | 12-16 years | ||
| SBP | DBP | SBP | DBP | |
| Boys | 301 | 394 | ||
| <90th percentile | 100.81 (13.22) | 62.38 (9.88) | 111.88 (11.24) | 63.28 (10.51) |
| ≥90th to <97th percentile | 102.54 (15.33) | 62.45 (11.62) | 112.26 (13.75) | 64.19 (11.48) |
| ≥97th percentile | 103.74 (15.07) | 62.08 (11.76) | 115.70 (11.42) | 66.02 (10.60) |
| ANOVA | F=0.61P=.654 (ns) | F=0.22P=.731 (ns) | F=1.90P=.201 (ns) | F=4.94P<.05 |
| Girls | 381 | 435 | ||
| <90th percentile | 98.46 (13.55) | 63.46 (12.07) | 108.18 (13.44) | 63.07 (11.25) |
| ≥90th to <97th percentile | 100.34 (9.03) | 63.19 (9.94) | 111.62 (12.22) | 66.61 (11.80) |
| ≥97th percentile | 107.85 (13.03) | 64.18 (10.76) | 114.30 (12.24) | 67.37 (10.06) |
| ANOVA | F=11.2P<.001 | F=0.14P=.812 (ns) | F=6.13P<.001 | F=6.08P<.001 |
%BF, percent body fat; ANOVA, analysis of variance; DBP, diastolic blood pressure; ns, not significant; SBP, systolic blood pressure.
Values expressed as mean (standard deviation), unless otherwise indicated.
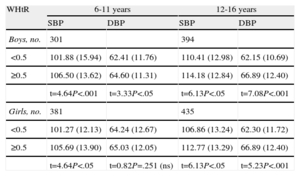
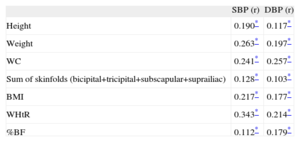
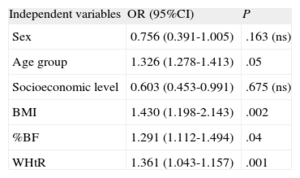
Table 4 portrays the influence of abdominal adiposity on the BP. In both sexes and both age groups, the averages were higher for the subjects with a WHtR of 0.5 or higher. As can be deduced from the value of the t statistic, the trend was significant except for the DBP of the girls aged 6 to 11 years. After controlling for the effect of age and sex (Table 5), the correlation analysis showed that the SBP and DBP were positively related to the height, weight, WC, sum of the 4 skinfolds, BMI, WHtR, and %BF. The Pearson coefficients were always significant, more so between the anthropometric variables and the SBP. On the other hand, the logistic regression analysis (Table 6) corroborated the results recorded for the bivariate tests. According to the model, the risk of HBP became significantly greater with increases in age, %BF, BMI, and WHtR. The model did not select sex or socioeconomic level of the family as predictive variables, and its validity is reflected in the Hosmer-Lemeshow statistic for calibration (χ2=0.782; P=.67) and the area under the curve, the value of which (0.79) is acceptable.
Mean Systolic and Diastolic Blood Pressure Values (mmHg) According to Age Group and Nutritional Category Based on Waist-to-Height Ratio
| WHtR | 6-11 years | 12-16 years | ||
| SBP | DBP | SBP | DBP | |
| Boys, no. | 301 | 394 | ||
| <0.5 | 101.88 (15.94) | 62.41 (11.76) | 110.41 (12.98) | 62.15 (10.69) |
| ≥0.5 | 106.50 (13.62) | 64.60 (11.31) | 114.18 (12.84) | 66.89 (12.40) |
| t=4.64P<.001 | t=3.33P<.05 | t=6.13P<.05 | t=7.08P<.001 | |
| Girls, no. | 381 | 435 | ||
| <0.5 | 101.27 (12.13) | 64.24 (12.67) | 106.86 (13.24) | 62.30 (11.72) |
| ≥0.5 | 105.69 (13.90) | 65.03 (12.05) | 112.77 (13.29) | 66.89 (12.40) |
| t=4.64P<.05 | t=0.82P=.251 (ns) | t=6.13P<.05 | t=5.23P<.001 | |
DBP, diastolic blood pressure; ns, not significant; SBP, systolic blood pressure; WHtR, waist-to-height ratio.
Values expressed as mean (standard deviation), unless otherwise indicated.
Correlation Between Systolic Blood Pressure, Diastolic Blood Pressure, and Anthropometric Variables According to Sex and Age Using the Pearson Coefficient
| SBP (r) | DBP (r) | |
| Height | 0.190* | 0.117* |
| Weight | 0.263* | 0.197* |
| WC | 0.241* | 0.257* |
| Sum of skinfolds (bicipital+tricipital+subscapular+suprailiac) | 0.128* | 0.103* |
| BMI | 0.217* | 0.177* |
| WHtR | 0.343* | 0.214* |
| %BF | 0.112* | 0.179* |
%BF, percent body fat; BMI, body mass index; DBP, diastolic blood pressure; SBP, systolic blood pressure; WC, waist circumference; WHtR, waist-to-height ratio.
Association Between High Blood Pressure and Anthropometric Indicators Estimated Using Multivariate Logistic Regression
| Independent variables | OR (95%CI) | P |
| Sex | 0.756 (0.391-1.005) | .163 (ns) |
| Age group | 1.326 (1.278-1.413) | .05 |
| Socioeconomic level | 0.603 (0.453-0.991) | .675 (ns) |
| BMI | 1.430 (1.198-2.143) | .002 |
| %BF | 1.291 (1.112-1.494) | .04 |
| WHtR | 1.361 (1.043-1.157) | .001 |
95%CI, 95% confidence interval; %BF, percent body fat; BMI, body mass index; ns, not significant; OR, odds ratio (obtained from the regression coefficients); WHtR, waist-to-height ratio.
Dependent variable: high blood pressure = systolic or diastolic blood pressure above the 90th percentile of the standard normal distribution.
Independent variables: sex (1=boy; 2=girl), age group (1=6-9 years; 2=11-16 years), socioeconomic level (mean score based on the level of education and profession of parents32).
Hosmer-Lemeshow statistic: χ2=0.782; P=.67.
Area under the curve=0.79 (95%CI, 0.675-0.821).
As indicated above, 3.5% of the girls and 3.17% of the boys had SBP or DBP above the 90th percentile of the standard in Spain. These rates are lower than those reported by González Jiménez et al.15 involving 977 subjects aged between 9 and 17 years in Granada, Spain, in which data from the RICARDIN study were also used as a reference source. It is interesting to note that the prevalence of overweight in that study was higher than that obtained here; depending on the age group and sex, the incidence of overweight ranged between 10.9% and 32%, and that of obesity from 4.5% to 15.1%.
At the international level, the latest data on populations of schoolchildren in Mexico and Canada also surpassed those of the present study. Bojórquez Díaz12 detected HBP in 12.7% of the primary school students in the state of Sonora, whereas Salvadori et al.11 reported the condition in 7.6% of the children in rural Canada, but both the Sonoran and Canadian children had higher rates of obesity than the boys and girls from Madrid studied here. Incidences of HBP closer to ours have been recorded in Argentina, in the Vela project,33 in which 4.2% of the children aged between 5 and 12 years and 6% of adolescents between 13 and 18 years old had SBP or DBP above the 90th percentile. In a Cuban population between 15 years and 17 years old, Suárez Cobas et al.34 found 7.6% of the boys and 2.4% of the girls to be in the same situation. Using the identical criteria, 6.3% of students aged between 15 and 17 years in the Venezuelan city of Merida were diagnosed as having HBP.10
In their review published in 2010, Kavey et al.35 point out that HBP in children and adolescents reaches a worldwide prevalence of 1% to 5%; the results of the present report fall in this range. Nevertheless, studies carried out after 2005, such as those mentioned above, stress that the problem has become more important in recent years. Investigations on secular trends, such as the Cuenca (Spain) study,36 detected a decrease in the average SBP and DBP in the school-age population evaluated between 1992 and 2004 in that Spanish province, despite the notable increase in BMI during the same period. However, other authors report a significant correlation between that index and BP, as well as a higher risk of HBP in overweight or obese children than their peers with normal weight.10,37 Classic studies like the Bogalusa Heart Study38 or the Muscatine Study39 revealed a positive correlation between body weight, BMI, and BP years ago. More recent research carried out in Spain, such as the Carmona study,40 has shown that the correlation coefficient r for BMI and BP ranged between 0.15 and 0.30, depending on age and sex. In another study, also performed in the Spanish region of Andalusia,41 the correlation between these two parameters was even stronger (r=0.637 in boys and r=0.575 in girls).
In an adult population, although BMI is related to HBP, when compared with this index42 the anthropometric measurements that quantify adiposity and its distribution are more sensitive for the identification of risk of mortality in individuals with documented cardiovascular disease, which demonstrates the importance of analyzing body composition.43 However, in children and adolescents, the association between BP and adiposity has not been as widely studied; Pérez Guillén and Hernández de Valera44 evaluated Venezuelan schoolchildren in the state of Miranda, and observed that BP levels were more strongly correlated with indicators of fat distribution (r=0.61) than with the BMI and less so with SBP and DBP (r=0.21). As we mentioned above, and as can be deduced from the correlation and regression analyses, our results suggest that the indicators of central adiposity (WC, WHtR) are more closely associated with SBP and DBP than the total or relative adiposity, represented by the sum of the skinfold thicknesses and the %BF, respectively. Along these lines, analyzing 816 Argentine schoolchildren from 6 years to 10 years of age, Szer et al.45 found the WC to be the measurement that correlated best with BP (r=0.79). The results obtained by Taylor et al.46 in subjects aged between 3 and 19 years agree with these findings. In addition, these authors point out that the excess of central fat, based on WC, is associated not only with an increase in BP but with an unhealthy lipid profile as well, as was also reported by Cabañas and Esparza.22
Some authors propose insulin resistance to be the major factor leading to HBP in obese individuals. There are reports that support this idea,47,48 demonstrating that the anthropometric indicators most closely associated with insulin sensitivity are abdominal obesity and %BF. In this respect, Burrows et al.49 showed that, regardless of pubertal development, boys and girls with reduced insulin sensitivity have significantly greater %BF and WC than those with normal insulin sensitivity. The results of the present study coincide with this idea and highlight the importance of excess fat and of abdominal fat as HBP risk factors in school-age children.
LimitationsThe cross-sectional design of the present study makes it impossible to establish a causal relationship between overweight or obesity in children and HBP. Despite the large sample (over 1500 subjects), it is not possible to guarantee the generalizability of the results to the entire school population of the Community of Madrid in these age groups. In the attempt to reduce to the greatest possible extent any potential “white coat” effect, we decided to accept as valid the lowest of 3 BP measurements, which may reduce the HBP prevalence obtained. On the other hand, the fact that the analysis did not include information on the physical activity level of the boys and girls may reduce the implications of these results.
CONCLUSIONSThe incidence of HBP (90th percentile or above) in our sample was 3.17% among boys and 3.05% among girls. The mean SBP and DBP levels increased in accordance with increases in BMI, %BF, and WHtR. Overweight and obesity predispose individuals to HBP, but the level of risk depends on the excess of adipose tissue and its distribution. The %BF and WHtR as indicators of abdominal adiposity are especially sensitive for the identification of schoolchildren with HBP. We confirm the importance of body composition as a diagnostic element of cardiovascular prevention in boys and girls between 6 and 16 years old.
CONFLICTS OF INTERESTNone declared.