

Program SI! is a multi-level, school-based intervention for the promotion of cardiovascular health from early childhood. The aim of this paper is to characterize the prevalence of obesity and high blood pressure in the preschoolers enrolled in the study, and to compare various criteria for classifying obesity.
MethodsThe study was a cluster-randomized controlled intervention trial including 24 state schools in Madrid (Spain). Weight, height, triceps and subscapular skinfold thicknesses, waist circumference, and systolic and diastolic blood pressure were measured in 2011 children (1009 boys and 1002 girls) aged 3 to 5 years (3.7 [0.9]). Body mass index and blood pressure were classified by corresponding task force criteria. Obesity was studied by 6 different criteria. Associations of body mass index, body weight, body fat, and waist circumference on blood pressure were examined, and the risk of high blood pressure in relation to tertiles of body mass index was calculated.
ResultsThe prevalence of obesity according to the International Obesity Task Force varied from 2% at age 3 to 8% at age 5, and the overall prevalence of high blood pressure (≥ 90th percentile) was 20%. Sex- and age-specific criteria for obesity showed better agreement with the reference than a single generalized cutoff. The risk of high blood pressure was higher for the highest tertile of body mass index distribution.
ConclusionsThe highest prevalence of obesity and high blood pressure was found among older children. The classification of obesity in children was more accurate using sex- and age-specific cutoffs.
Keywords
The worldwide epidemic of obesity is a leading concern in prevention and public health policies, particularly those directed at children.1 Program SI! is a multi-level, school based-intervention that has been successfully implemented in Colombia2 and Spain.3,4 The Program SI! intervention introduces a global vision of health promotion based on four connected components related to cardiovascular health: diet (promoting acquisition of healthy dietary habits), physical activity (healthy and balanced management of leisure time), human body (knowledge of the human body and heart), and Emotions (effective management of emotions, aimed at developing behaviors that protect against substance abuse and psychological disorders).
The intervention has been initiated in preschool children (aged 3 years), and its efficacy is currently being evaluated through a cluster-randomized controlled intervention trial.3 As a part of this evaluation, anthropometry and blood pressure data have been collected at baseline to assess the long-term impact of the intervention on cardiovascular disease (CVD)-related conditions such as obesity and hypertension.
Many studies have shown an association between body mass index (BMI) and CVD risk factors, and most national and international standards define childhood obesity or overweight based on BMI. However, other adiposity markers have also proven to be indicators of CVD, such as waist circumference or specific measures of skinfold thickness.5,6
Waist circumference is a simple measurement of abdominal fatness that has been associated with cardiometabolic risk factors not only in adults, but also among preschoolers.6 An international cutoff for waist circumference is available for adults, although some countries (Turkey, Germany, The Netherlands, and New Zealand) have developed their own values.7–10 Skinfold thickness is another adiposity indicator directly related to CVD risk factors, and is also a very valuable tool for evaluating the distribution of body fat (BF) in children. Pediatric guidelines recommend the assessment of triceps and subscapular skinfold thicknesses.5 As for waist circumference, cutoffs for the percentage of BF calculated from skinfolds are available for adults, but there is no consensus cutoff for children.11–14 High blood pressure is a direct risk factor for CVD among adults, and high blood pressure in children and adolescents frequently develops into hypertension in adults.15 The estimated prevalence of childhood hypertension in recent studies is 2% to 5%16–18 and is increasing, probably as a result of the increase in obesity rates.19
The objective of this study was to characterize the Program SI! population of preschoolers in terms of anthropometric measurements and its association with the prevalence of high blood pressure, and to determine the prevalence of obesity according to various criteria.
METHODSParticipantsThe study was a cluster-randomized, controlled intervention trial including 24 state schools in Madrid (clinical trial registry number NCT01579708). A detailed description of Program SI! was published recently.3 During the 2010-2011 academic year there were 787 state schools in the Madrid area. To ensure a homogeneous sample, selection was restricted to schools located in the city of Madrid with a canteen service and a minimum of two classes per preschool level. A total of 174 schools satisfied these criteria. We further excluded schools representing extremes according to quartiles of socioeconomic variables, resulting in a sample with these characteristics: 10% to 32% immigrant families, 36% to 54% families receiving state subsidies for books, and 13% to 20% families receiving state subsidies for canteen meals. The remaining 73 schools were invited to a 1-day meeting at which Program SI! was presented; 35 schools agreed to participate, and the final 24 were selected by excluding larger schools with more than 2 classes per level, to yield a sample of medium-sized schools. All children at preschool level in these 24 schools were eligible for participation and were recruited through written consent from their parents in both the control and the intervention schools, resulting in a response rate of 59.1%. Sample distribution by school level was 801 (51.3% girls) from 1st grade (“age 3”), 623 (44.3% girls) from 2nd grade (“age 4”) and 587 (53.7% girls) from 3rd grade (“age 5”). Data are treated according to Spanish Law 15/1999 for the Protection of Personal Data, and were processed with a data encryption system to guarantee confidentiality of the information provided. The study protocol was approved by the Madrid Clinical Research Ethics Committee.
Anthropometry and Blood Pressure AssessmentAll measurements were made by trained nutritionists according to a standardized protocol.20 Body weight was measured to the nearest 0.1kg (Seca 803 electronic scale; Hamburg, Germany) and height to the nearest 0.1cm (Seca 213 portable stadiometer) with children wearing light clothes and no shoes. Waist circumference was measured to the nearest 0.1cm directly on the skin at the end of a gentle expiration; measurements were made halfway between the lower costal border and the iliac crest, using a flexible, nonelastic Holtain tape (Crymych, United Kingdom). Triceps skinfold thickness and subscapular skinfold thickness were measured to the nearest 0.2mm with a Holtain T/W Skinfold Caliper (Crymych, United kingdom). Triceps skinfold thickness was measured at the midpoint between the acromion and the olecranon processes on the posterior surface of the right arm, and subscapular skinfold thickness was measured 2cm below the inferior angle of the right scapula. BMI was calculated using the standard formula of weight (in kilograms) divided by the square of height (in meters).21 Percentage BF was determined from triceps and subscapular skinfold thicknesses using the Slaughter prepubescent equation.22 Obesity and overweight were defined according to the International Obesity Task Force (IOTF) BMI categories.23,24 Obesity was also defined according to other methods to study differences from the IOTF criteria: Spanish BMI 97th percentile,25 Taylor's BF age- and sex-specific cutoffs,19 Williams’ BF sex-specific cutoffs,20 Dwyer and Blizzard's BF sex-specific cutoffs,12,13,26 and Fredriks’ waist circumference criteria, specific for age and sex.7
Blood pressure was measured after children had been relaxing for 5 to 10min and were comfortable with the nutritionists and familiarized with the device. Three measurements were taken at 2 to 3min intervals, and the lowest value was used in the analysis. Such repeated readings are recommended to improve measurement accuracy, since previous studies on very young children have demonstrated that high readings are commonly a stress-response to the measuring procedure, even in a familiar, nonclinical setting such as the child's school.27,28 We used an automatic monitor with a special cuff for children (OMRON M6, cuff CS2, Omron; Kyoto, Japan) on the right arm resting on a support, at the level of the heart. Blood pressure was classified as normal or high: normal blood pressure was defined as systolic blood pressure (SBP) and diastolic blood pressure (DBP) < 90th percentile for age, sex and height; and high blood pressure was defined as SBP or DBP ≥ 90th percentile or ≥ 120/80 mmHg, according to the criteria of the National High Blood Pressure Education Program Working Group on High Blood Pressure in Children and Adolescents.29
Data AnalysisAnthropometric and blood pressure data were analyzed by descriptive statistics stratified by school level. Continuous variables are presented as mean (standard deviation) and categorical variables are presented as sample size in the category (percentage). Sex differences in BMI categories, obesity classification, and blood pressure category were analyzed in each preschool level by chi-square tests. Student t test was used to compare sex differences and a P for trend was tested across the three preschool levels. Agreement between obesity criteria was examined using the Cohen's kappa coefficient. Scattergrams were used to explore the relationship between BMI, BF and waist-circumference cutoffs for obesity definition. Linear regression analysis adjusted for sex and age was used to examine the association of cardiovascular risk indicators (BMI, body weight, BF, and waist circumference by tertiles) with SBP and DBP. We calculated odds ratios (OR) and 95% confidence intervals (95%CI) for high blood pressure in relation to BMI tertiles. All statistical analyses were performed with SPSS statistical software, version 21.0 (SPSS Inc.; Chicago, Illinois, United States).
RESULTSDirect anthropometric measurements (waist circumference and skinfold thicknesses), blood pressure, and derived measurements (BMI and BF) are listed in Table 1. Waist circumference and blood pressure (SBP and DBP) increased significantly with age (P for trend < .01 to P for trend< .001). Although girls and boys showed no differences in BMI, there were marked differences in adiposity measurements (skinfold thicknesses and BF; P for trend < .01 to P for trend < .001). The prevalence of overweight and obesity was calculated using IOTF criteria23,24 (Table 1). The prevalence of obesity increased with age: 2.1% (95%CI, 0.8-3.6) at age 3; 3.7% (95%CI, 1.7-5.7) at age 4, and 8.2% (95%CI, 5.3-11.5) at age 5 for boys (P for trend<.01); and 3.6% (95%CI, 1.9-5.8) at age 3; 3.6% (95%CI, 1.9-5.8) at age 4, and 6.0% (95%CI, 3.5-8.8) at age 5 for girls (P-trend < .05).
Baseline Characteristics of Boys and Girls by Age
| All | Age 3 | Age 4 | Age 5 | P-trend | |
|---|---|---|---|---|---|
| BMI, kg/m2 | |||||
| Boys, n=1009 | 16.2 (1.6) | 16.3 (1.4) | 16.2 (1.5) | 16.3 (1.8) | .801 |
| Girls, n=1002 | 16.2 (1.6) | 16.1 (1.6) | 16.1 (1.7) | 16.2 (1.7) | .439 |
| Overweigh (IOTF) | |||||
| Boys | 94 (9.6)* | 37 (9.5)* | 35 (10.1)* | 22 (9.0)* | .329 |
| Girls | 142 (14.6)* | 50 (12.1)* | 42 (15.3)* | 50 (17.6) | < .01 |
| Obesity (IOTF) | |||||
| Boys | 41 (4.2)* | 8 (2.1)* | 13 (3.7)* | 20 (8.2)* | < .001 |
| Girls | 42 (4.3)* | 15 (3.6)* | 10 (3.6)* | 17 (6.0)* | < .05 |
| Waist, cm | |||||
| Boys, n=1009 | 52.2 (4.0) | 50.6 (3.2) | 52.3 (3.5) | 54.2 (4.5) | < .001 |
| Girls, n=1002 | 51.6 (4.1) | 50.2 (3.6) | 52.0 (4.0) | 53.1 (4.2) | < .001 |
| Triceps skinfold, mm | |||||
| Boys, n=1003 | 9.0 (2.4) | 8.9 (2.0) | 8.9 (2.4) | 9.2 (3.0) | .063 |
| Girls, n=997 | 10.0 (2.5) | 9.6 (2.3) | 10.0 (2.6) | 10.3 (2.6) | < .01 |
| Subscapular skinfold, mm | |||||
| Boys, n=1001 | 5.9 (1.8) | 5.9 (1.6) | 5.8 (1.7) | 6.1 (2.2) | .490 |
| Girls, n=996 | 6.7 (2.1) | 6.6 (1.9) | 6.7 (2.4) | 6.6 (2.2) | .885 |
| Percentage of body fat (Slaugther's equation) | |||||
| Boys, n=1001 | 14.5 (3.6) | 14.4 (3.1) | 14.3 (3.5) | 14.8 (4.4) | .281 |
| Girls, n=995 | 15.8 (3.5) | 15.5 (3.3) | 15.9 (3.8) | 16.0 (3.9) | .105 |
| Systolic blood pressure, mmHg | |||||
| Boys, n=992 | 96.2 (8.3) | 93.7 (8.3) | 96.1 (7.2) | 99.6 (8.5) | < .001 |
| Girls, n=988 | 95.4 (8.4) | 93.1 (8.3) | 96.1 (8.2) | 97.9 (8.0) | < .001 |
| Diastolic blood pressure, mmHg | |||||
| Boys, n=992 | 56.9 (7.1) | 56.4 (7.5) | 56.4 (6.5) | 58.2 (7.1) | < .01 |
| Girls, n=988 | 58.1 (7.3) | 57.4 (6.9) | 58.3 (7.8) | 58.9 (7.1) | < .01 |
BMI, body mass index; IOTF: International Obesity Task Force.
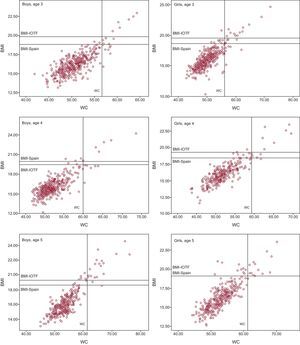
The extent of agreement between different methods for estimating obesity was evaluated using Cohen kappa coefficients and scattergrams for BMI vs BF (Figure 1) and BMI vs waist circumference (Figure 2). The IOTF BMI classification reference showed the highest agreement with Spanish BMI standards (κ=0.837) and with classification according to waist circumference (κ=0.670). The lowest agreement was found when we classified by BF, especially using the generalized cutoffs (Taylor, κ=0.555; Williams κ=0.429; Dwyer and Blizzard, κ=0.489). The cutoffs for BF proposed by Taylor (Figure 1, BF-a) and by Williams (Figure 1, BF-b) underestimated obesity in all ages compared with the reference (IOTF BMI-criteria), and only the cutoffs for boys proposed by Dwyer and Blizzard (Figure 1, BF-c) overestimated obesity.
. BF, body fat; BMI, body mass index; IOTF, International Obesity Task Force.")

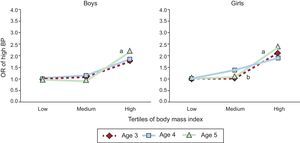
According to the IOTF criteria, high blood pressure (SBP or DBP ≥ 90th percentile for age, sex and height or ≥ 120/80 mmHg) was found in 96 boys at age 3 (25.7%), 44 (12.9%) at age 4, and 42 (15.4%) at age 5. High blood pressure was found in 100 girls at age 3 (24.8%), 50 (18.6%) at age 4, and 56 (17.9%) at age 5. The age trend was significant (P for trend < .01 for boys and P for trend < .05 for girls). The association between SBP and DBP and CVD-risk markers (tertiles of body weight, BMI, BF, and waist circumference) obtained by age and sex-adjusted linear regression analysis is shown in Table 2. The highest tertiles for all CVD-risk markers (body weight, BMI, BF, and waist circumference) were associated with higher SBP and DBP readings (P < .001). Accordingly, high blood pressure was associated with a high BMI. Taking the lowest BMI tertile as the reference, we found a greater risk of high blood pressure in the highest BMI tertile (OR=2.0, 95%CI, 1.5-2.7). The same outcome was obtained by analyzing girls and boys separately at age 3 (OR = 1.8; 95%CI, 1.0-3.2 for boys; OR = 2.1; 95%CI, 1.2-3.6 for girls), age 4 (OR = 1.8; 95%CI, 0.8-4.1 for boys; OR = 1.9; 95%CI, 0.9-4.0 for girls), and age 5 (OR = 2.2; 95%CI, 1.0-4.8 for boys; OR = 2.4; 95%CI, 1.2-4.8 for girls). The BMI-associated risk of high blood pressure was especially high at age 5, showing marked differences with the lowest tertile for girls and boys (Figure 3).
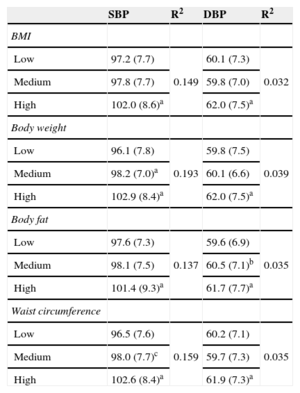
Association Between Systolic and Diastolic Blood Pressure and Cardiovascular Risk Indicators
| SBP | R2 | DBP | R2 | |
|---|---|---|---|---|
| BMI | ||||
| Low | 97.2 (7.7) | 0.149 | 60.1 (7.3) | 0.032 |
| Medium | 97.8 (7.7) | 59.8 (7.0) | ||
| High | 102.0 (8.6)a | 62.0 (7.5)a | ||
| Body weight | ||||
| Low | 96.1 (7.8) | 0.193 | 59.8 (7.5) | 0.039 |
| Medium | 98.2 (7.0)a | 60.1 (6.6) | ||
| High | 102.9 (8.4)a | 62.0 (7.5)a | ||
| Body fat | ||||
| Low | 97.6 (7.3) | 0.137 | 59.6 (6.9) | 0.035 |
| Medium | 98.1 (7.5) | 60.5 (7.1)b | ||
| High | 101.4 (9.3)a | 61.7 (7.7)a | ||
| Waist circumference | ||||
| Low | 96.5 (7.6) | 0.159 | 60.2 (7.1) | 0.035 |
| Medium | 98.0 (7.7)c | 59.7 (7.3) | ||
| High | 102.6 (8.4)a | 61.9 (7.3)a |
BMI, body mass index; DBP, diastolic blood pressure; SBP, systolic blood pressure. R2 determined by linear regression analysis adjusted by sex and age.
a,b,cSignificantly different from the lowest tertile (Bonferroni test, aP < .001, bP < .05, cP < .01).

Age-specific odds ratio of high blood pressure by tertiles of body mass index for boys and girls. High blood pressure: systolic blood pressure or diastolic blood pressure ≥ 90th percentile for age, sex, and height or ≥ 120/80mmHg. BP, blood pressure; OR, odds ratio. aP < .01; bP < .05.
The prevalence of obesity in our study population was similar to that detected in children of the same age group in northern and central Europe countries,30,31 but lower than that reported in Spanish preschoolers in the enKid study32 (8.3% in boys and 12.7% in girls; IOTF criteria). The most up-to-date study on Spanish preschoolers is IDEFICS30, which examined a population from eight European countries: Spain, Cyprus, Italy, Hungary, Germany, Belgium, Estonia and Sweden. The prevalence of obesity in the Spanish subpopulation in IDEFICS was 6.9% (boys) and 5.8% (girls), according to the IOTF criteria. This is slightly higher than in our sample, although the available data cover a wider age range (2-10 years old). The proportion of overweight and obesity in the Program SI! population increased with increasing preschool level, and is expected to increase progressively until adolescence, as shown in recent studies of Spanish children (11% at 6-9 years old; 8.6% at 8-17 years old).33,34 The previous Program SI! study, carried out in Colombia2 on a sample with the same age range (3-5 years), found an obesity prevalence of 2.9% in the intervention group and 2.2% in the control group, but in that study the reference values were the United States Centers for Disease Control growth charts.
The mean values for waist circumference (boys=52.2; girls=51.6) and the sum of both skinfolds (boys=14.9; girls=16.6) in our sample were very similar to those obtained in the IDEFICS study (2-6 years old) (waist circumference, boys=51.0; girls=50.4; sum of skinfolds, boys=15.9; girls=17.9).35 Our waist circumference values were also similar to other European studies in this age range7–9 and slightly lower than studies in the United States.36 In the Program SI! sample, waist circumference was higher in boys than girls at all three preschool levels, and skinfold thickness were significantly lower in boys, reflecting sexual dimorphism.37,38
There are very few studies reporting percentages of BF in children of this age range. Our values calculated with the Slaughter prepubescent equation (14.5% girls, 15.8% boys) are similar to those obtained by DEXA (dual-energy X-ray absorptiometry) in 3- to-6-year-old children in New Zealand (13.7% girls, 17.8% boys)13 and are lower than BF values obtained in a wider age range of children (3-8 years) in the United States by DEXA (22.6% boys, 27.36% for girls)39 or by Slaughter equation (17%).36 The percentage BF values we obtained can be used to estimate obesity as an excess of fat according to defined cutoffs.12–14 Taylor's classification by BF showed higher agreement because it has been validated by DEXA in children aged 3-18 and uses the IOTF BMI reference. A single generalized BF cutoff, as in the classification of Williams (20% BF) or Dwyer and Blizzard (25% BF), showed a lower agreement with the reference (Figure 1). The cutoff for boys proposed by Dwyer and Blizzard (Figure 1; BF-c) is lower than that proposed by Williams (Figure 1; BF-b), and both result in higher estimates of obesity among boys than the reference. It can be therefore concluded that the excess of adiposity in boys aged 3 to 5 years is close to 20% and below 25% BF. Both criteria have a cutoff for girls of 30% BF that noticeably underestimates obesity compared with the reference. The excess of fat in girls over this age range seems to be <30%, close to Taylor's cutoff for this age in girls (26%). Using waist circumference to define obesity according to abdominal adiposity,7 prevalence was slightly lower than the reference. This method showed good agreement (κ=0.670), confirming once more that sex- and age-specific cutoffs give more accurate estimates than a single generalized cutoff.
As seen in our study, blood pressure increases with age and body size, hence the accuracy of blood-pressure classification in children is increased by including information on height, in addition to age and sex.15,29 Most blood pressure studies in Spain included populations aged ≥ 6 years,28,40 so our data on Spanish preschoolers may add valuable information for establishing reference values. In our sample, around 25% of boys and girls aged 3 years had SBP or DBP ≥ 90th percentile or ≥ 120/80 mmHg, and the figure for children aged 4 and 5 years was around 15%. This suggests that the youngest children (aged 3, 1st preschool level) may be more affected by the “white coat phenomenon”41,42 being more nervous than the older children, and it may also be significant that data collection coincided with the start of their school life, before they are fully familiarized with the school environment. The mean values of SBP and DBP for boys and girls in our sample are higher than Spanish standards in the same age group (SBP/DBP: 93.0/53.5 at age 3; 95.3/50.6 at age 4; 99.6/56.2 at age 5, in boys; 90.9/52.9 at age 3; 93.2/48.7 at age 4; 99.6/54.1 at age 5, in girls),40 which may reflect the upward trend in blood pressure levels in recent decades.43 The association between blood pressure and CVD indicators such as body size or adiposity is not yet established for children, but the association with body weight or BMI is strong.19 In our sample, girls and boys with the highest BMI values had high SBP and DBP and therefore an elevated risk of high blood pressure, and this association was especially strong in 5 years old group. In the context of the increase in childhood obesity and the consequences this implies for CVD, studies of cardiovascular risk indicators in very young children are an important source of information.
CONCLUSIONSPreschool children participating in Program SI! with the highest BMI had higher SBP and DBP and therefore an increased risk of high blood pressure. Our baseline data also confirm the greater accuracy gained by the use of sex- and age-specific cutoffs for obesity.
The capacity of Program SI! to change modifiable risk factors for CVD could be determined by differences in high blood pressure rates and obesity prevalence between intervention and control groups. Program SI! aims to show that an effective school-based intervention, including the children's environment (family and school), can provide a firm foundation for successful CVD prevention in adulthood.
FUNDINGThis work is supported by the research grant FIS-PI11/01885 (Fondo de Investigación Sanitaria del Instituto de Salud Carlos III, Madrid).
CONFLICTS OF INTERESTNone declared.