
Few studies have used time-dependent correction to analyze the relationship between blood pressure and all-cause mortality, and to our knowledge none has been performed in older people from the Mediterranean area. This study aimed to estimate the relationship between baseline blood pressure and blood pressure as a time-dependent covariate with the risk of all-cause mortality in a population cohort of persons aged 65 or older in Spain.
MethodsData were taken from the population-based study “Aging in Leganés” with 17 years of follow-up, launched in 1993 in a random sample (n=1560) of persons aged ≥65 years. Mortality was assessed in 2010. Cox proportional hazards models were fitted to examine the effects on mortality of blood pressure at baseline and of blood pressure as a time-dependent covariate.
ResultsThe lowest mortality was observed at baseline systolic blood pressure of 136mmHg and time-dependent covariate value of 147mmHg. The highest risk of mortality for time-dependent covariates occurred with systolic blood pressure<115 mmHg and >93mmHg and diastolic blood pressure<80mmHg. Diastolic blood pressure over 85mmHg did not increase the risk of death.
ConclusionsBased on the dynamic association between blood pressure and mortality, a U-shaped relationship was found for systolic blood pressure and a negative relationship for diastolic blood pressure and all-cause mortality. The lowest mortality corresponded to a systolic blood pressure level slightly over the diagnostic hypertension value and suggests that a value of 140mmHg is not adequate as a diagnostic and therapeutic threshold in an elderly population.
Keywords
.
INTRODUCTIONHypertension (HT) is an important public health problem due to its effect on cardiovascular morbidity and mortality and its high prevalence, especially in older persons.1,2 Data from the Framingham study and subsequent studies3,4 clarified the role of HT in cardiovascular mortality in middle-aged subjects. However, the extent to which high blood pressure (BP) should be reduced in persons aged 65 or older remains controversial. Although the evidence suggests that HT continues to be a prognostic factor in this age group,5,6 some results have also reported an inverse relationship between systolic blood pressure (SBP) and diastolic blood pressure (DBP) and mortality in persons aged 65 or older.7,8
These controversial results could partly be due to the methods used in most of the studies not having been corrected for regression dilution bias,9 that is, they do not include the fluctuation in BP values during the time of observation. This phenomenon could substantially underestimate the strength of the real association between BP and mortality during a particular exposure or a later period. In order to make appropriate time-dependent corrections for the effect of regression dilution, BP re-measurements during prolonged follow-up can be used to estimate the usual risk factor levels at a particular interval time prior to death in each follow-up wave.10
To our knowledge, only a few prospective observational studies have used time-dependent correction to analyze the relationship between BP and mortality.9–14 Moreover, some of these studies are based on patients enrolled in clinical trials11 or include persons younger than 75.12 The meta-analysis from the Prospective Studies Collaboration published by Lewington et al.10 demonstrated a relationship between SBP and stroke death down to a SBP of 115mmHg for individuals up to age 89, but data from the European Mediterranean studies are from middle-aged men (40 to 59 years old). It is important to design specific studies, using the time-dependent correction for BP, that include older people from the Mediterranean area, where stroke has a higher burden of mortality than coronary disease.15
The longitudinal study “Aging in Leganés”, carried out from 1993 to 2010, offers the opportunity to examine in greater depth the association between repeated BP measurements and all-cause mortality in a European Mediterranean population of persons aged 65 or older. The objective of this study was to estimate the relationship between baseline BP and BP as a time-dependent covariate (TDC) and the risk of all-cause mortality in a population cohort of persons aged 65 or older who were followed for 17 years.
METHODSStudy SubjectsThe methodological characteristics of this study have been described in detail previously.16 Briefly, “Aging in Leganes” was initiated in 1993 in a sex- and age-stratified random sample (n=1560, 11.4% of the total Leganés population aged 65 or older, range 65-101 years), a suburban municipality located 8 km outside Madrid (Spain). The subsequent waves were conducted in 1995, 1997, 1999, 2006, and 2008. In 1993, the response rate was 82% (n=1283); in 1995, 1007 individuals; in 1997, 869; in 1999, 519; in 2006, 286; and in 2008, 194.
Of the 1283 participating individuals in 1993, BP measurement data was not available for 7.9% (n=101) of participants because they refused to take part in the physical examination. All individuals with available baseline BP data were included in the analysis (n=1182). The nonincluded subjects (n=377) were older (P≤.05) and more likely to be women (P≤.001), compared with the included subjects.
For the assessment of the association between BP as a TDC and mortality, we used data from 1995, 1999, and 2006. In 1997, BP data were not available.
The study protocol was approved by the local ethics committee and all the participants signed an informed consent form.
MortalityDeaths were ascertained by computer linkage to the National Death Registry (authorized by the Ministry of Health), using the first name as well as the two last names (paternal and maternal) as is customary in Spain. All deaths occurring between study entry (April 1993-November 1993) and 30 June 2010 were ascertained. The cumulative number of deaths over the 17-year period was 1153 out of the total sample of 1560 participants. In the present study the number of deaths was 874 of the 1182 individuals with baseline BP data (390 women and 484 men). From 1993 to 1995, 166 individuals had died, from 1995 to 1999, 242 and from 1999 to 2006, 354. The remaining individuals died in the last 4 years of follow-up (n=112).
Blood Pressure MeasurementsBP was measured three times during the physical examination (except in 2006 when only two measurements were available) at intervals of at least 5min, in the left arm, with the individual seated, using a calibrated mercury sphygmomanometer. The average of the readings was used for these analyses.
Potential ConfoundersThe sociodemographic factors included age category (65-74, 75-84, and ≥85 years), sex, and education (illiterate or some education [no schooling but can read and write, or any level of schooling]). Antihypertensive medication was coded as a dichotomous variable with a value of 1 if the person reported taking any medication for HT and 0 otherwise.
Morbidity was assessed by a proxy to the Charlson comorbidity index. As reported in a previous publication,17 it is based on the original Charlson comorbidity index and the available pre-existing data of 9 self-reported comorbidities from the “Aging in Leganés” study.
Body mass index was calculated at baseline as the ratio of the weight to the square of height in meters (kg/m2). Weight was self-reported and height was measured with a measuring rod according to standardized guidelines.18 For the multivariate analysis, 2-term fractional polynomial transformations were used: bmifp1=(bmi/10)2 and bmifp2=(bmi/10)3, as in a previous study of body mass index in this population.18
Baseline smoking status and physical activity were also included in the analysis. Smoking was categorized as never smoked, ex-smoker or current smoker. Physical activity was coded as a dichotomous variable to distinguish those reporting light or no exercise from those reporting moderate or vigorous exercise, as described in previous work.18
Statistical AnalysisAverage BP measurements (standard deviation) were plotted against time. Characteristics of the study sample were compared against SBP categories (<110, 110-119, 120-129, 130-139, 140-159, 160-179, and ≥180mmHg) and DBP categories (<60, 60-69, 70-79, 80-84, 85-89, 90-99, and ≥100mmHg). The differences between groups of individuals were based on a one-way analysis of variance model for continuous variables and on chi-squared statistics for categorical variables.
The association between BP at baseline and BP-TDC and the risk for all-cause mortality was analyzed with Cox proportional hazards models, adjusting for the covariates at baseline (age in categories, sex, education, antihypertensive medication, proxy to the Charlson comorbidity index, body mass index, smoking, and physical activity). Confidence intervals were estimated under the assumption of asymptotic normality of the estimates. The relationship between all-cause mortality and BP at baseline and BP-TDC was tested to include a quadratic term of BP measurements in the model. To assess the nonlinear relationship, the model was compared with and without the quadratic term by means of the P-value obtained from the partial likelihood ratio test. Cox proportional hazards analyses with BP-TDC were performed with the same technique used in a previous study of TDC in this population,19 which was previously used by Ferraro and Kelly-Moore.20 The model included the covariate at baseline (in 1993), change in the covariate, and time of observation. The change in the covariate was measured as the difference between the covariate value at the most recent observation and the covariate at baseline. Time of observation was defined as the difference between the interview date at the most recent observation (date in 2006, 1999, 1995, or 1993) and the interview date at baseline (date in 1993); it takes a value of 0 if data were available only for 1993, and a value between 1.5 and 13.5, depending on the latest interview date.
In all models we tested the interaction terms between BP and BP-TDC with the remaining covariates.
Results with P<.05 were considered statistically significant. SPSS 17.0 was used for the analysis.
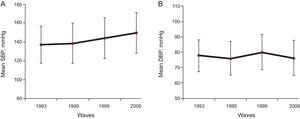
RESULTSBlood Pressure Over TimeThe distribution of BP measured in 1993, 1995, 1999 and 2006 is presented in Figure 1A for SBP and Figure 1B for DBP. The average SBP increases progressively over the 13 years of follow-up, from 137.2mmHg in 1993 to 149.4mmHg in 2006. However, the variations over time for DBP were very small, from 77.8mmHg to 80.0mmHg.
 at baseline and post-baseline waves in 1995, 1999 and 2006. B: Mean diastolic blood pressure (standard deviation) at baseline and post-baseline waves in 1995, 1999 and 2006. DBP, diastolic blood pressure; SBP, systolic blood pressure.")
Blood pressure distribution over time. A: Mean systolic blood pressure (standard deviation) at baseline and post-baseline waves in 1995, 1999 and 2006. B: Mean diastolic blood pressure (standard deviation) at baseline and post-baseline waves in 1995, 1999 and 2006. DBP, diastolic blood pressure; SBP, systolic blood pressure.
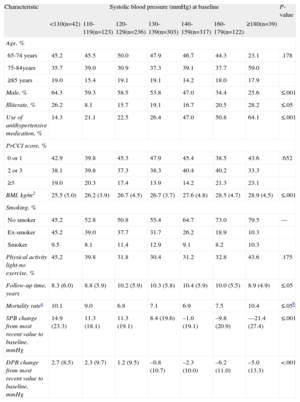
Characteristics of the study sample according to SBP and DBP categories are presented in Tables 1 and 2, respectively.
Characteristics of the Population According to Systolic Blood Pressure Categories
| Characteristic | Systolic blood pressure (mmHg) at baseline | P-value | ||||||
| <110(n=42) | 110-119(n=123) | 120-129(n=236) | 130-139(n=303) | 140-159(n=317) | 160-179(n=122) | ≥180(n=39) | ||
| Age, % | ||||||||
| 65-74 years | 45.2 | 45.5 | 50.0 | 47.9 | 46.7 | 44.3 | 23.1 | .178 |
| 75-84years | 35.7 | 39.0 | 30.9 | 37.3 | 39.1 | 37.7 | 59.0 | |
| ≥85 years | 19.0 | 15.4 | 19.1 | 19.1 | 14.2 | 18.0 | 17.9 | |
| Male, % | 64.3 | 59.3 | 58.5 | 53.8 | 47.0 | 34.4 | 25.6 | ≤.001 |
| Illiterate, % | 26.2 | 8.1 | 15.7 | 19.1 | 16.7 | 20.5 | 28.2 | ≤.05 |
| Use of antihypertensive medication, % | 14.3 | 21.1 | 22.5 | 26.4 | 47.0 | 50.8 | 64.1 | ≤.001 |
| PrCCI score, % | ||||||||
| 0 or 1 | 42.9 | 39.8 | 45.3 | 47.9 | 45.4 | 38.5 | 43.6 | .652 |
| 2 or 3 | 38.1 | 39.8 | 37.3 | 38.3 | 40.4 | 40.2 | 33.3 | |
| ≥3 | 19.0 | 20.3 | 17.4 | 13.9 | 14.2 | 21.3 | 23.1 | |
| BMI, kg/m2 | 25.5 (5.0) | 26.2 (3.9) | 26.7 (4.5) | 26.7 (3.7) | 27.6 (4.8) | 28.5 (4.7) | 28.9 (4.5) | ≤.001 |
| Smoking, % | ||||||||
| No smoker | 45.2 | 52.8 | 50.8 | 55.4 | 64.7 | 73.0 | 79.5 | — |
| Ex-smoker | 45.2 | 39.0 | 37.7 | 31.7 | 26.2 | 18.9 | 10.3 | |
| Smoker | 9.5 | 8.1 | 11.4 | 12.9 | 9.1 | 8.2 | 10.3 | |
| Physical activity light-no exercise, % | 45.2 | 39.8 | 31.8 | 30.4 | 31.2 | 32.8 | 43.6 | .175 |
| Follow-up time, years | 8.3 (6.0) | 8.8 (5.9) | 10.2 (5.9) | 10.3 (5.8) | 10.4 (5.9) | 10.0 (5.5) | 8.9 (4.9) | ≤.05 |
| Mortality ratea | 10.1 | 9.0 | 6.8 | 7.1 | 6.9 | 7.5 | 10.4 | ≤.05b |
| SPB change from most recent value to baseline, mmHg | 14.9 (23.3) | 11.3 (18.1) | 11.3 (19.1) | 8.4 (19.6) | –1.0 (19.1) | –9.8 (20.9) | —21.4 (27.4) | ≤.001 |
| DPB change from most recent value to baseline, mmHg | 2.7 (8.5) | 2.3 (9.7) | 1.2 (9.5) | –0.8 (10.7) | –2.3 (10.0) | –6.2 (11.0) | –5.0 (13.3) | <.001 |
BMI, body mass index; DBP, diastolic blood pressure; PrCCI, proxy to the Charlson comorbidity index; SBP, systolic blood pressure.
Unless otherwise indicated, the data are expressed as mean (standard deviation).
Characteristics of the Population According to Diastolic Blood Pressure Categories
| Characteristic | Diastolic blood pressure (mmHg) at baseline | P-value | ||||||
| <60(n=38) | 60-69(n=169) | 70-79(n=383) | 80-84(n=295) | 85-89(n=146) | 90-99(n=115) | ≥100(n=36) | ||
| Age, % | ||||||||
| 65-74 years | 31.6 | 32.5 | 42.6 | 51.5 | 54.8 | 58.3 | 55.6 | ≤.001 |
| 75-84 years | 44.7 | 46.7 | 38.6 | 34.6 | 34.9 | 27.8 | 36.1 | |
| ≥85 years | 23.7 | 20.7 | 18.8 | 13.9 | 10.3 | 13.9 | 8.3 | |
| Male, % | 81.6 | 59.2 | 55.9 | 47.1 | 47.9 | 30.4 | 36.1 | ≤.001 |
| Illiterate, % | 18.4 | 14.2 | 15.9 | 22.0 | 16.4 | 12.2 | 27.8 | .082 |
| Use of antihypertensive medication, % | 18.4 | 21.9 | 27.4 | 34.6 | 47.9 | 49.6 | 63.9 | ≤.001 |
| PrCCI, score, % | ||||||||
| 0 or 1 | 28.9 | 47.3 | 42.3 | 47.8 | 43.8 | 47.0 | 41.7 | .745 |
| 2 or 3 | 52.6 | 37.3 | 39.2 | 38.3 | 38.4 | 36.5 | 41.7 | |
| ≥3 | 18.4 | 15.4 | 18.5 | 13.9 | 17.8 | 16.5 | 16.7 | |
| BMI, kg/m2 | 24.9 (4.1) | 25.9 (4.0) | 27.1 (4.2) | 27.3 (4.3) | 27.5 (4.5) | 28.5 (5.1) | 28.6 (5.3) | ≤.001 |
| Smoking, % | ||||||||
| No smoker | 31.6 | 56.8 | 55.1 | 61.7 | 60.3 | 71.3 | 72.2 | |
| Ex-smoker | 50.0 | 32.5 | 34.2 | 28.8 | 30.1 | 17.4 | 22.2 | |
| Smoker | 18.4 | 10.7 | 10.7 | 9.5 | 9.6 | 11.3 | 5.6 | |
| Physical activity light-no exercise, % | 39.5 | 40.8 | 31.1 | 33.6 | 28.1 | 32.2 | 30.6 | .253 |
| Follow-up time, years | 6.7 (5.6) | 8.8 (5.7) | 9.4 (5.9) | 10.6 (5.7) | 11.3 (5.5) | 11.7 (5.7) | 11.0 (5.3) | ≤.001 |
| Mortality ratea | 12.9 | 9.4 | 8.3 | 6.6 | 6.0 | 5.3 | 6.6 | ≤.001b |
| SPB change from most recent value to baseline, mmHg | 3.9 (19.3) | 8.1 (18.1) | 7.4 (21.2) | 3.0 (20.7) | 0.3 (23.8) | –1.7 (23.6) | –5.4 (22.6) | ≤.001 |
| DPB change from most recent value to baseline, mmHg | 6.8 (10.9) | 4.2 (8.2) | 1.9 (8.8) | –2.1 (8.9) | –5.5 (10.5) | –8.6 (9.9) | –15.4 (14.7) | ≤.001 |
BMI, body mass index; DBP, diastolic blood pressure; PrCCI, proxy to the Charlson comorbidity index; SBP, systolic blood pressure.
Unless otherwise indicated, the data are expressed as mean (standard deviation).
Subjects with low SBP were more likely to be men, to have less education, and to be leaner, and less likely to use antihypertensive medication, compared with subjects with high SBP. A significantly larger mortality rate occurred in the lowest and highest SBP categories (P≤.05). No significant differences were observed between SBP and age, proxy to the Charlson comorbidity index conditions, or physical activity (Table 1).
Similarly for the DBP categories, those with the lowest DBP (<60mmHg) were older, leaner, more likely to be men and less likely to use antihypertensive medication, compared with subjects with the highest BP (≥100mmHg). Mortality rate increased with lower values of DBP (Table 2).
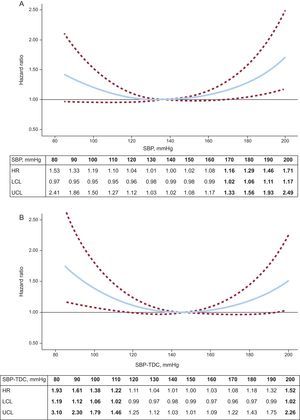
Systolic Blood Pressure and MortalityIn the multivariate models, adjusting for baseline covariates, the hazard ratios (HR) between all-cause mortality and SBP at baseline and SBP-TDC are shown in Figures 2A and 2B. A non-linear relationship was confirmed when a quadratic term was included in the model (SBP at baseline: chi-squared=5.958, degrees of freedom [df]=1, P=.015; SBP-TDC: chi-square=7.186, df=1, P=.007).
 and all-cause mortality. A: Adjusted hazard ratios for all-cause mortality by baseline systolic blood pressure; the referent point was 136mmHg. B: Adjusted hazard ratios for all-cause mortality by time-dependent systolic blood pressure; the referent point was 147mmHg. Based on proportional hazards models adjusting for age in categories; sex; education, use of antihypertensive medication, proxy to the Charlson comorbidity index, smoking, physical activity, and 2-term fractional polynomial transformations of body mass index. The upper and lower 95% confidence intervals are denoted by dotted lines. HR, hazard ratio; LCL, lower confidence level; SBP, systolic blood pressure; SBP-TDC, systolic blood pressure as time-dependent covariate; UCL, upper confidence level.")
Systolic blood pressure (mmHg) and all-cause mortality. A: Adjusted hazard ratios for all-cause mortality by baseline systolic blood pressure; the referent point was 136mmHg. B: Adjusted hazard ratios for all-cause mortality by time-dependent systolic blood pressure; the referent point was 147mmHg. Based on proportional hazards models adjusting for age in categories; sex; education, use of antihypertensive medication, proxy to the Charlson comorbidity index, smoking, physical activity, and 2-term fractional polynomial transformations of body mass index. The upper and lower 95% confidence intervals are denoted by dotted lines. HR, hazard ratio; LCL, lower confidence level; SBP, systolic blood pressure; SBP-TDC, systolic blood pressure as time-dependent covariate; UCL, upper confidence level.
Figure 2A shows that the mortality rate decreases with increasing SBP at baseline, reaches a minimum at 136mmHg, and then increases in an asymmetric manner for higher values of SBP. The highest mortality risks were found for values above 165mmHg.
The relationship between SBP-TDC and all-cause mortality followed a U-shaped curve (Fig. 2B). Furthermore, the estimated nadir for SBP-TDC increases by almost 11mmHg, from 136mmHg to 147mmHg, compared with baseline SBP. The mortality hazard is not different from the value of 1 for SBP values ranging between 115mmHg and 193mmHg.
Diastolic Blood Pressure and MortalityFor DBP at baseline and DBP treated as a TDC, a nonlinear relationship was not observed for all-cause mortality. No significant differences were observed between the models with and without the quadratic term (DBP at baseline: chi-square=0.181, df=1, P=.671; DBP-TDC: chi-square=0.096, df=1, P=.756).
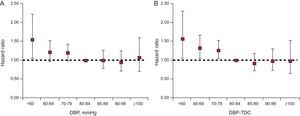
For the multivariate analysis, DBP at baseline and DBP-TDC were treated as a categorical variable. Figures 3A and B give the mortality HR for each category of DBP (baseline and TDC, respectively) compared with the recommended guideline of DBP below 80-84mmHg.5

Relationship between diastolic blood pressure and all-cause mortality. A: Hazard ratios for all-cause mortality by diastolic blood pressure at baseline; B: Hazard ratios for all-cause mortality by diastolic blood pressure as a time-dependent covariate. Based on proportional hazards models adjusting for age in categories, sex, education, use of antihypertensive medication, proxy to the Charlson comorbidity index, smoking, physical activity and 2-term fractional polynomial transformations of body mass index. Bars indicate 95% confidence intervals. DBP, diastolic blood pressure; DBP-TDC, diastolic blood pressure as time-dependent covariate.
Figure 3A shows that a significantly higher risk of death, compared with the category 80-84mmHg, was observed only in the lowest category of DBP (<60mmHg), (HR=1.53; 95% confidence interval [95%CI], 1.05-2.23).
DBP as a TDC was a strong predictor of mortality, after adjusting for all variables at baseline (Fig. 3B). The HR were 1.56 (95%CI, 1.06-2.30), HR=1.32 (95%CI, 1.05-1.66) and HR=1.26 (95%CI,1.05-1.51) for DBP-TDC categories of <60, 60-69 and 70-79mmHg, respectively, as compared with the reference category (80-84mmHg). Higher values (≥85mmHg) did not increase the risk of death compared with the reference 80-84mmHg.
None of the interaction terms between BP (baseline and TDC) and the remaining covariates, including the interaction between baseline BP and changes in BP over time, attained statistical significance.
DISCUSSIONSBP increased progressively over time throughout the follow-up period in this cohort of elderly people aged 65 and older. This finding is consistent with the gradual increase in the incidence of HT in the elderly population in Spain and throughout the world.21,22
Looking at the association between BP components and mortality for the different analytical models, SBP showed a U-shaped relationship with long-term all-cause mortality even after adjustment for potential confounders. For DBP at baseline and DBP treated as a TDC, a nonlinear relationship was not found for all-cause mortality.
The SBP and DBP levels related to mortality vary according to the kind of analysis used. For the Cox regression analysis, the highest and significant levels of mortality were observed for individuals with baseline SBP>165mmHg and baseline DBP<60mmHg. These figures change when BP is used as a TDC for the analysis. The highest−and significant−level of mortality is observed for individuals with SBP<115mmHg or >193mmHg and DBP <80mmHg.
Clinical trials have shown clinical benefits in the elderly subjects who achieve SBP values averaging 140, 150, and 160mmHg, but no additional benefit from an intense BP-lowering strategy has been reported. As a simple generalization, it could be stated that pretreatment SBP>160mmHg and a target SBP<150mmHg would fit the profile of most of these studies.23,24 Furthermore, these studies varied in patient selection, drug choices, and duration of therapy, which makes it difficult to extrapolate the results to the general population.
Observational cohort studies add to this scenario the possibility of a longitudinal analysis of the relationship between BP and mortality in the general population.25 In older people, observational studies have also commonly found U- or J-shaped relationships between SBP or DBP and mortality7,8 but other studies including general populations with a wider age range have found a linear relationship.10,14 The meta-analysis from the Prospective Studies Collaboration10 shows a strong and direct relationship between overall mortality and BP at all ages (40-89 years), with no threshold down to at least SBP<115mmHg and DBP<75mmHg. In our TDC analysis, significant higher mortality was also observed for individuals with SBP<115mmHg, although this relationship is not linear, and the lowest risk mortality level was at SBP=147mmHg. Consistent with the results of other studies,8,26–29 this association could be related to healthier lifestyles, Mediterranean diet, or better HT control in middle adulthood, which would lead to less arterial stiffening in surviving elderly people.
Thus, unlike previous guidelines that addressed the full spectrum of adults,5,30 there is limited evidence in the elderly population to support values between 130mmHg and 140mmHg as a diagnostic and therapeutic threshold. There are also limited data as to whether patients with initial SBP between 150mmHg and 159mmHg would benefit from treatment without risk of adverse outcomes.31
Similar to our results, several studies have found that low DBP is a marker of increased risk of death.32,33 Since most myocardial blood flow occurs in diastole, low DBP could be a strong determinant of myocardial perfusion and possibly cardiovascular mortality.34
Strengths and LimitationsOne of the strengths of this study is that it is a population-based cohort study. The high response rate at baseline (83%) and the relatively large sample size and long life expectancy of those included made it possible to carry out a retrospective longitudinal analysis with a long follow-up period. Furthermore, we studied the relationship between BP and all-cause mortality. Several studies have found that frailty is prevalent in older adults with cardiovascular disease and that the combination of frailty and cardiovascular disease has been associated with a high risk of all-cause mortality.35,36
This is the first study to employ a TDC analysis to show the relationship between BP as a dynamic variable and all-cause mortality in a Spanish-based Mediterranean population of persons aged 65 or older.
Our study has some methodological limitations. First, we had 3 measurements of BP in the first 3 waves of the study but only 2 measurements in 2006. We could not conduct outpatient BP monitoring.37
Second, we did not have information to assess cardiovascular mortality. Our analysis controlled for cardiovascular risk factors like body mass index, smoking, and physical activity but no information was available on cholesterol levels and its treatment, which is important in adults.4,28 Absence of statistical control for serum cholesterol may have led to overestimation of the relationship between BP and mortality but some studies have found that serum cholesterol has no predictive value for mortality in the elderly population.7,38
Third, because the sample was from a metropolitan area of Madrid, this study may not be comparable to other Mediterranean population studies and cannot strictly be generalized to the whole Spanish population. However, our objective was to increase our knowledge of the relationship between BP and all-cause mortality in persons aged 65 years or older.
Fourth, some bias may have occurred. Reverse causality bias may have happened, as we have not ruled out the presence of subclinical cardiovascular disease during the follow-up. Also, we have not adjusted for some general variables such us diet and because some variables were modeled as dichotomous, some residual confounding may remain. However, the magnitude of these biases has been reported to be small.39
CONCLUSIONSIn conclusion, based on direct measurements of BP and taking into account the dynamic association between BP and mortality, our data show a U-shaped relationship between SBP and all-cause mortality and a negative relationship between DBP and all-cause mortality in a population aged 65 years or older residing in a city of central Spain. Increased hazard ratios were observed at low and high SBP (<115mmHg and >193mmHg) and at low DBP (<80mmHg). To our knowledge, there is conflicting evidence in the elderly to support a value of 140mmHg as a diagnostic and therapeutic threshold, or DBP values below 80mmHg as a target. This is the first study to provide a TDC analysis of BP in a Mediterranean-based population aged 65 years or older and adds complementary and contemporary information to the international experience. HT management in the elderly may need different treatment targets from those in younger individuals. Our results in elderly subjects suggest that more trial research is needed to assess whether a goal of less than 140/90mmHg should be achieved in the elderly population.
FUNDINGThis work was supported by the National Fund for Health Research (Fondo de Investigaciones en Salud) of Spain (project numbers FIS PI 05 1898 and RETICEF RD06/0013/1013).
CONFLICTS OF INTERESTNone declared.
We thank the elderly people of Leganés for their generous contribution to our study during 17 years.