Telomeres are noncoding regions located at the end of chromosomes and their shortening has been associated with risk factors and cardiovascular disease. The aim of this study was to evaluate the association between ideal cardiovascular health (Life's simple 7) and the odds of having short telomeres in a subsample of participants older than 55 years from the Seguimiento Universidad de Navarra (SUN) study.
MethodsWe included 886 participants older than 55 years (645 men and 241 women). Telomere length was measured using a real-time quantitative polymerase chain reaction. Cardiovascular health score was defined by the American Heart Association as a composite score of 7 key risk factors (smoking status, physical activity, diet, body mass index, blood pressure, total cholesterol, and fasting blood glucose) with 0 to 2 points for each factor. We categorized this score in tertiles as poor (0-9 points), intermediate (10-11 points) and ideal (12-14 points). The odds of having short telomeres was defined as telomere length below the 20th percentile.
ResultsIndividuals with higher ideal cardiovascular health had a lower prevalence of having short telomeres (adjusted OR, 0.60; 95%CI, 0.34-1.05; P trend=.052). This association was statistically significant in men (adjusted OR, 0.37; 95%CI, 0.17-0.83; P trend=.025) but not in women.
ConclusionsAn inverse association between cardiovascular health score and short telomeres was found especially for men older than 55 years in the SUN population.
The SUN project was registered at ClinicalTrials.gov (Identifier: NCT02669602).
Keywords
Telomeres are the noncoding sections located at the end of linear eukaryotes chromosomes.1 They are repetitive deoxyribonucleic acid (DNA) sequences of 5’-TTAGGG-3’ whose main function is the protection of genomic DNA to preserve chromosome stability and integrity.1 Throughout the life span, telomeres become shorter with each cell division, thus losing thousands of bases (30-200 nucleotides/division).1 Consequently, they have been considered as markers of biological age and therefore of age-related diseases.1 Even though telomere length (TL) is a heritable factor, there are several mechanisms involved in its shortening over the life course of an individual such as oxidative stress and inflammation.1
Cardiovascular diseases (CVDs) are the leading cause of death globally.2 They causes about 30% of all deaths in Spain every year and are defined as a group of disorders of the heart and blood vessels including coronary heart disease, cerebrovascular disease, rheumatic heart disease, and other conditions.2
The American Heart Association (AHA) defined cardiovascular health (CVH) and determined the metrics needed to monitor it over time. The metrics are defined in 7 key risk factors, 4 involving behavioral factors (smoking, diet, physical activity, and body mass index) and 3 comprising health factors (blood pressure, total cholesterol, and fasting glucose).3
Several studies have assessed the association of ideal CVH and reduced CVD morbidity, mortality,4 cognitive impairment,5 diabetes,6 and atherosclerosis.7 However, so far few studies have addressed the association between ideal CVH and TL in humans and, to the best of our knowledge, only in American populations.8,9 Shorter telomeres were associated with a less than ideal CVH score in a United States population (5194 non-Hispanic and Mexican-American participants, -2725 women and 2459 men, aged more than 20 years)9 and longer telomeres were associated with above average CVH in American Indians tribes (2568 participants, 1549 women and 1019 men, aged from 14 to 93 years)8. On the other hand, behavioral factors (smoking,10,11 alcohol abuse,12 sedentary lifestyle13 and obesity14) have been associated with accelerated telomere shortening. Moreover, hypertension,15,16 hypercholesterolemia17 and diabetes18,19 were also associated with short telomeres. It has recently been found in the SUN (Seguimiento Universidad de Navarra) cohort that ultra-processed food consumption and several diet quality indexes were able to modify the risk of short telomeres.20,21
The objective of the present study was to assess the relationship between CVH score and the odds of short telomeres in a Spanish population older than 55 years in the SUN cohort.
METHODSStudy populationThe SUN study is a prospective and multipurpose cohort composed of Spanish graduates and conducted in a Mediterranean setting: Spain.22 The recruitment of participants started in 1999 and the enrollment in the study is permanently open under the identifier NCT02669602 at ClinicalTrials.gov. A detailed description of the methods is available elsewhere.22 Briefly, baseline and follow-up data are collected through self-reported postal or web-based questionnaires every 2 years.22 The SUN cohort gathers information on a wide array of self-reported, previously validated characteristics, including anthropometric variables (such as body mass index),22 clinical history (such as total cholesterol,23 blood pressure24 and glucose levels25), sociodemographic and lifestyle-related factors (such as a 136-item semiquantitative Food Frequency Questionare,26 smoking status22 and physical activity27). The research protocol was written in accordance with the principles of the Declaration of Helsinki and was approved by the University of Navarre institutional review board. Specific written informed consent was requested to participate in this study.
In May 2008, 1921 adults older than 55 years at the baseline questionnaire, were invited to participate in a genetic study.28 A total of 1085 accepted to participate and 986 returned saliva samples,28 although only 953 samples could be correctly analyzed. Moreover, 67 participants were excluded because they reported a total energy intake outside Willett's predefined values (< 800 or> 4000kcal/d for men and <500 or> 3500kcal/d for women).29 The final sample available for this cross-sectional study was 886 ().
Outcome assessment: telomere lengthThe primary endpoint was shortening of TL. Saliva samples from participants were collected with specialized kits (DNA Collection-Oragene OG-250 Saliva Kit). DNA was extracted according to the manufacturer's instructions and frozen at −80∘C. The measurement of TL was made with the monochrome multiplex real-time quantitative polymerase chain reaction (RT-qPCR) following the method of Cawthon described elsewhere.30 The T/S ratio, which is proportional to average TL, is obtained by the comparison of these 2 parameters compared with a reference DNA. The master mix contained 10 ng genomic DNA, a QuantiTect CYBR Green PCR kit (Qiagen), telomere and albumin primers, and nuclease-free water to complete the final volume (10μL). Telomere primers (telc and teg) and albumin primers (albu and albd) were combined (final concentration 900nM each). The primer sequences (Sigma Aldrich St Louis, MO, USA; purified by high-performance liquid chromatography) were telg (5′-ACACTAAGGTTTGGGTTTGGGTTTGGGTTTGGGTT AGTGT-3′), telc (5′ TGTTAGGTATCCCTATCCCTATCCCTA TCCCTATCCCTAACA-3′), albu (5′ -CGGCGGCGGGCGG CGCGGGCTGGGCGGAAATGCTGCACAGAATCCTTG-3′), and albd (5′-GCCCGGCCCGCCGCGCCCGTCCCGCCGGA AAAGCATGGTCGCCTGTT-3′). The qPCR used was the CFX 384TM Real-Time System (BioRad) with the following protocol: 15minutes at 95∘C for enzyme activation followed by 2 cycles of 95∘C at 15seconds and 49∘C at 15seconds, and 35 cycles of 15s at 95∘C, 10seconds at 63∘C, 15seconds at 74∘C (first signal acquisition), and 15seconds at 88∘C (second signal acquisition). For each sample, we generated a melting curve from 45 to 95∘C ramped at 0.2∘C/s. We used 384 well plates and for quality control the samples were run in triplicate.
A calibration curve of reference DNA samples (150–2.34 ng/mL in 2-fold dilutions; linearity agreement R2> 0.99) was included on each high-throughput plate.
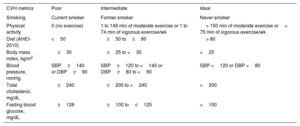
Cardiovascular health scoreCVH score was assessed based on 7 key risk factors: smoking status, physical activity, diet, body mass index, total cholesterol, fasting blood glucose, and blood pressure. Each metric was categorized into 3 levels of “poor”, “intermediate” and “ideal” and assigned scores of 0, 1 and 2, respectively, according to the AHA definitions3 (table 1). Total score therefore ranged from 0 to 14, and our variable was categorized in 3 groups: poor (0 to 9 points), intermediate (10 to 11 points) and ideal (12 to 14 points). Variables were taken from the questionnaire immediately prior to the saliva collection, except for physical activity and Healthy Eating Index index, which have only data in the baseline questionnaire.
Definition of cardiovascular health score
| CVH metrics | Poor | Intermediate | Ideal |
|---|---|---|---|
| Smoking | Current smoker | Former smoker | Never smoker |
| Physical activity | 0 (no exercise) | 1 to 149 min of moderate exercise or 1 to 74 min of vigorous exercise/wk | > 150 min of moderate exercise or> 75 min of vigorous exercise/wk |
| Diet (AHEI-2010) | <50 | ≥50 to≤80 | > 80 |
| Body mass index, kg/m2 | ≥30 | ≥25 to <30 | <25 |
| Blood pressure, mmHg | SBP≥140 or DBP≥90 | SBP≥120 to <140 or DBP≥80 to <90 | SBP <120 or DBP <80 |
| Total cholesterol, mg/dL | ≥240 | ≥200 to <240 | <200 |
| Fasting blood glucose, mg/dL | ≥126 | ≥100 to≤125 | <100 |
AHEI, Alternative Healthy Eating Index; CVH, cardiovascular health; DBP, diastolic blood pressure; SBP, systolic blood pressure.
Smoking status was categorized as poor (current smokers), intermediate (former smokers) and ideal (never smokers). We classified physical activity according to frequency and duration of moderate and vigorous intensity of each activity as poor (no exercise), intermediate (1 to 149minutes per week of moderate exercise or 1 to 74minutes of vigorous exercise) and ideal (more than 150minutes of moderate exercise or more than 75minutes of vigorous exercise per week).
Diet was assessed with the Alternative Healthy Eating Index (AHEI-2010). For this index, we used information supplied by Chiuve et al..31 It ranged from 50 to 110. This index is based on food and nutrients predictive of chronic disease risk.31 Vegetables, fruit, sugar-sweetened beverages and fruit juice, nuts and legumes, red/processed meat, transfatty acids, long-chain omega-3 fatty acids, polyunsaturated fatty acids, sodium, and alcohol intake were scored from 0 to 10. In this analysis, AHEI-2010 was divided into poor diet quality (< 50), intermediate diet quality (≥ 50 to≤80) and ideal diet quality (> 81).32
Body mass index was categorized as poor (≥ 30kg/m2), intermediate (≥ 25 to <30kg/m2) and ideal (< 25kg/m2). Blood pressure was classified using systolic blood pressure (SBP) (mmHg) and diastolic blood pressure (DBP) (mmHg) as poor (SBP≥140 or DBP≥90), intermediate (SBP≥120 to <140 or DBP≥80 to <90) and ideal (SBP <120 or DBP <80). For participants with only 1 blood pressure measurement recorded, that single reading was used. For the missing data, we considered poor SBP for participants taking any antihypertensive medication and ideal SBP and DBP for those reporting not having prevalent hypertension. Cholesterol was classified as poor (≥ 240mg/dL), intermediate (≥ 200 to <240mg/dL) and ideal (< 200mg/dL). Fasting glucose was classified as poor (≥ 126mg/dL), intermediate (≥ 100 to≤125mg/dL) and ideal (< 100mg/dL). For the missing data, we considered poor cholesterol for participants with hypercholesterolemia diagnosis or taking any anticholesteremic agents, and ideal cholesterol for those reporting not having prevalent cholesterol.
Assessment of other covariatesThe information about covariates was collected at the baseline questionnaire of the SUN project, which includes age at saliva collection and age at inclusion (years); sex; marital status; years of university education; family history of hypertension, diabetes, obesity and CVD; and prevalence of cancer and depression. Other covariates included were sedentary lifestyle, special diets, alcohol consumption, sodium intake, and ultra-processed food consumption.
Statistical analysesFor the main analysis, participants were divided into tertiles of poor (0-9), intermediate (10-11) and ideal (12-14) CVH score. We examined the characteristics of the study sample according to the CVH categories using inverse probability weighting with adjustment for age at saliva collection and sex. For continuous variables, we used means±standard deviation, and percentages for categorical variables. As a quality control in our study, the Spearman correlation was performed to assess the association between TL and age at saliva collection. We also used the Spearman correlation to assess the association between TL and CVH score.
We calculated the number and percentage of participants by number of metrics. Furthermore, we calculated the number of participants by ideal CVH metrics.
As it was previously defined,21,33,34 short telomeres were defined as a TL bellow the 20th percentile. To assess the association between CVH score or CHV metrics and having short telomeres, logistic regression models were fitted to estimate the odds ratio (OR) and 95% confidence intervals (95%CI) considering the first tertile (poor CVH) as the reference category. We ran 2 adjusted models: the first one adjusted for age at saliva collection and sex, and the second one additionally adjusted for age at inclusion, marital status (single, married, widowed, divorced); years of university education; family history of hypertension, diabetes, obesity, and CVD; and prevalence of cancer and depression. Furthermore, tests of linear trend across successive tertiles were performed by assigning to each participant the value of the median in his/her tertile and considering these variables as continuous.
ANCOVA analysis was carried out to evaluate the mean adjusted TL according to tertiles of CVH score. To evaluate the association between each of the upper tertiles (intermediate and ideal CVH) compared with the lower tertile (poor CVH), multivariable linear regression adjusted models were carried out.
Multivariable linear regression models for TL with CVH score were done to explore the linear relationship between these 2 variables.
The P value for interaction between sex and CVH score was calculated using the likelihood ratio test for each scenario.
We also conducted sensitivity analyses to verify the robustness of our findings by rerunning the model with additional adjustments: using the 5th and 95th percentiles as limits for allowable total energy intake, ultra-processed food and alcohol consumption, following a special diet at baseline, sodium intake, sedentary lifestyle and weight gain; and excluding participants with a personal history of obesity, CVD, diabetes or hypertension.
Logistic regression analyses were used to calculate the predicted and observed probability, with the odds of having short TL (≤ 20th percentile) as the dependent variable, and the number of metrics of CVH score as the independent variable. Then, a graph was obtained using the observed and predicted marginal probabilities.
Statistical analyses were performed using STATA version 14.0 (StataCorp). We considered 2-tailed P values <.05 to be statistically significant.
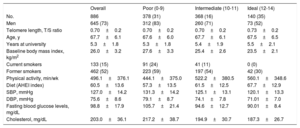
RESULTSCharacteristics of the study population are shown in table 2 according to tertiles of CVH score. A total of 886 participants were included in this analysis (mean age at saliva collection 67.7 years and 73% were male).
Baseline characteristics of participants from the SUN project according to tertiles of cardiovascular health score
| Overall | Poor (0-9) | Intermediate (10-11) | Ideal (12-14) | |
|---|---|---|---|---|
| No. | 886 | 378 (31) | 368 (16) | 140 (35) |
| Men | 645 (73) | 312 (83) | 260 (71) | 73 (52) |
| Telomere length, T/S ratio | 0.70±0.2 | 0.70±0.2 | 0.70±0.2 | 0.73±0.2 |
| Age, y | 67.7±6.1 | 67.6±6.0 | 67.7±6.1 | 67.5±6.5 |
| Years at university | 5.3±1.8 | 5.3±1.8 | 5.4±1.9 | 5.5±2.1 |
| Baseline body mass index, kg/m2 | 26.0±3.2 | 27.6±3.3 | 25.4±2.6 | 23.5±2.1 |
| Current smokers | 133 (15) | 91 (24) | 41 (11) | 0 (0) |
| Former smokers | 462 (52) | 223 (59) | 197 (54) | 42 (30) |
| Physical activity, min/wk | 496.1±376.1 | 444.1±375.0 | 522.2±380.5 | 560.1±348.6 |
| Diet (AHEI index) | 60.5±13.6 | 57.3±13.5 | 61.5±12.5 | 67.7±12.9 |
| SBP, mmHg | 127.0±14.2 | 131.3±14.2 | 125.1±13.1 | 120.1±13.3 |
| DBP, mmHg | 75.6±8.6 | 79.1±8.7 | 74.1±7.8 | 71.01±7.0 |
| Fasting blood glucose levels, mg/dL | 98.8±17.9 | 105.7±21.4 | 94.6±12.7 | 90.01±8.4 |
| Cholesterol, mg/dL | 203.0±36.1 | 217.2±38.7 | 194.9±30.7 | 187.3±26.7 |
AHEI, Alternative Healthy Eating Index; DBP, diastolic blood pressure; SBP, systolic blood pressure; SUN, Seguimiento Universidad de Navarra.
Data are expressed as No. (%) or mean±standard deviation. Each variable was adjusted for age at saliva collection and sex, except these 2, through inverse probability weighting.
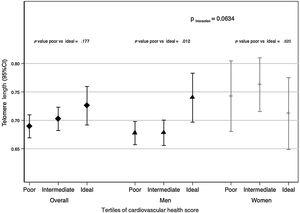
We found sex differences when analyzing the association between CVH score and TL (although P for interaction was not statistically significant (table 3: P=.1363 and figure 1: P=.0634)). Consequently, the descriptive and association analyses are also presented according to sex for the analyses.
Multivariable adjusted ORs (95%CIs) for short telomeres (≤ 20th percentile) in adults older than 55 years from the SUN project
| Tertiles of cardiovascular health score | ||||
|---|---|---|---|---|
| Overall (n=886) | Poor(0-9) (378) | Intermediate(10-11) (368) | Ideal(12-14) (140) | P for trend |
| Participants with short telomere length, No. (%) | 86 (23) | 70 (19) | 21 (15) | |
| aAge- and sex-adjusted | 1(ref) | 0.79 (0.55-1.13) | 0.60 (0.35-1.04) | .049 |
| bMultiple-adjusted model | 1(ref) | 0.78 (0.54-1.13) | 0.60 (0.34-1.05) | .052 |
| Men (n=645) | Poor(0-9) (312) | Intermediate(10-11) (260) | Ideal(12-14) (73) | P |
|---|---|---|---|---|
| Participants with short telomere length, n (%)) | 75 (24) | 55 (21) | 8 (10) | |
| aAge- and sex- adjusted | 1(ref) | 0.84 (0.56-1.25) | 0.37 (0.17-0.83) | .022 |
| bMultivariable-adjusted model | 1(ref) | 0.85 (0.57-1.29) | 0.37 (0.17-0.83) | .025 |
| Women (n=241) | Poor(0-9) (66) | Intermediate(10-11) (108) | Ideal(12-14) (67) | P |
|---|---|---|---|---|
| Participants with short telomere length, No. (%)) | 11 (35) | 15 (14) | 13 (19) | |
| aAge- and sex-adjusted | 1(ref) | 0.61 (0.25-1.48) | 0.90 (0.35-2.28) | .874 |
| bMultivariable-adjusted model | 1(ref) | 0.64 (0.25-1.63) | 1.06 (0.39-2.88) | .842 |
95%CI, 95% confidence interval; OR, odds ratio; SUN, Seguimiento Universidad de Navarra.
Additionally adjusted for age at inclusion; educational level (years at university, continuous); marital status (single, married, widowed, divorced); family history of hypertension, diabetes, obesity, and cardiovascular disease (dichotomous); and prevalence of cancer and depression (dichotomous). P for interaction multivariable adjusted model: 0.1363.
Adjusted logistic regression models. Values are ORs (95%CIs) unless otherwise indicated.
 by tertiles of cardiovascular health score (poor, intermediate and ideal) in adults over 55 y from the SUN (Seguimiento Universidad de Navarra) project. The first tertile is the reference value. Data were adjusted for age at inclusion; age at saliva collection; sex; educational level (years at university, continuous); marital status (single, married, widowed, divorced); family history of hypertension, diabetes, obesity, and cardiovascular disease (dichotomous); and prevalence of cancer and depression (dichotomous). The P for interaction was calculated using the likelihood ratio test for sex. Diamonds refers to the overall population, triangles to men and crosses to women. 95%CI, 95% confidence interval.")
Telomere length (95%CI) by tertiles of cardiovascular health score (poor, intermediate and ideal) in adults over 55 y from the SUN (Seguimiento Universidad de Navarra) project. The first tertile is the reference value. Data were adjusted for age at inclusion; age at saliva collection; sex; educational level (years at university, continuous); marital status (single, married, widowed, divorced); family history of hypertension, diabetes, obesity, and cardiovascular disease (dichotomous); and prevalence of cancer and depression (dichotomous). The P for interaction was calculated using the likelihood ratio test for sex. Diamonds refers to the overall population, triangles to men and crosses to women. 95%CI, 95% confidence interval.
As expected, a significant correlation was observed between TL and age in our population (correlation coefficient=−0.1965, P≤.001) (). Furthermore, the association between CVH score and TL was positive although not statistically significant (correlation coefficient=0.024, P value=.2076) ().
data shows the number and percentage of participants according to the number of metrics of CVH score. The number of participants in each ideal CVH metric is presented in . There were no participants with 0 or 1 points in the CVH score and most of participants had metrics in the range of 6 to 12 points.
The ORs of having shorter telomere according to CVH score are described in table 3. Men with higher CVH scores (12-14 points) had a lower prevalence of shorter telomeres in the age- and sex-adjusted model (age at saliva collection) (OR, 0.37; 95%CI, 0.17-0.83; P trend=.022), and the fully adjusted model (OR, 0.37; 95%CI, 0.17-0.83; P trend=.025). However, this association was not significant when we studied only women or the complete population, although P for trend in the complete population had marginal statistical significance.
shows the ORs of having short telomeres according to each metric of the CVH score. Most of the risk factors included in the CVH score, except for blood pressure and cholesterol in women, followed the expected pattern of association, providing consistency to the main results. Moreover, the predicted and observed probability of having short telomeres was inversely related to the number of metrics ().
Figure 1 shows mean adjusted TL by tertiles of CVH score in the study population (diamonds refers to overall population, triangles to men and crosses to women). Significant differences were observed when the first tertile of CVH score (poor) was compared with the third tertile (ideal) (P value=.012) in men.
Multivariable adjusted linear regression models were used to evaluate the associations between each of the 2 upper tertiles of CVH score (intermediate and ideal) and TL compared with the reference category (poor). Beta coefficients and their 95% confidence intervals are shown in . The results indicate that there was a positive relationship between TL and men with high CVH score compared with those with low CVH score. No significant associations were found when we studied only women or the overall population. Moreover, we did not find statistically significant linear associations between TL and CVH score both used as continuous variables ().
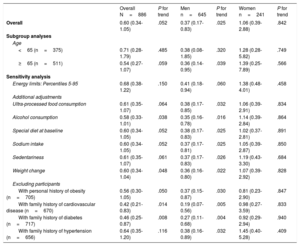
Sensitivity analyses are shown in table 4. The association between CVH score and the ORs of short telomeres did not change in any of the previously defined scenarios.
Sensitivity analyses for the association (OR, 95%CI) between ideal cardiovascular health risk and having short telomeres (≤ 20th percentile) (ideal vs. poor tertiles of cardiovascular health score score) in adults older than 55 years from the SUN project
| Overall N=886 | P for trend | Men n=645 | P for trend | Women n=241 | P for trend | |
|---|---|---|---|---|---|---|
| Overall | 0.60 (0.34-1.05) | .052 | 0.37 (0.17-0.83) | .025 | 1.06 (0.39-2.88) | .842 |
| Subgroup analyses | ||||||
| Age | ||||||
| <65 (n=375) | 0.71 (0.28-1.79) | .485 | 0.38 (0.08-1.85) | .320 | 1.28 (0.28-5.82) | .749 |
| ≥65 (n=511) | 0.54 (0.27-1.07) | .059 | 0.36 (0.14-0.95) | .039 | 1.39 (0.25-7.89) | .566 |
| Sensitivity analysis | ||||||
| Energy limits: Percentiles 5-95 | 0.68 (0.38-1.22) | .150 | 0.41 (0.18-0.94) | .060 | 1.38 (0.48-4.01) | .458 |
| Additional adjustments | ||||||
| Ultra-processed food consumption | 0.61 (0.35-1.07) | .064 | 0.38 (0.17-0.85) | .032 | 1.06 (0.39-2.91) | .834 |
| Alcohol consumption | 0.58 (0.33-1.01) | .038 | 0.35 (0.16-0.78) | .016 | 1.14 (0.39-2.84) | .864 |
| Special diet at baseline | 0.60 (0.34-1.05) | .052 | 0.38 (0.17-0.83) | .025 | 1.02 (0.37-2.81) | .891 |
| Sodium intake | 0.60 (0.34-1.05) | .052 | 0.37 (0.17-0.81) | .025 | 1.05 (0.39-2.87) | .850 |
| Sedentariness | 0.61 (0.35-1.07) | .061 | 0.37 (0.17-0.83) | .026 | 1.19 (0.43-3.30) | .684 |
| Weight change | 0.60 (0.34-1.04) | .048 | 0.36 (0.16-0.80) | .022 | 1.07 (0.39-2.92) | .828 |
| Excluding participants | ||||||
| With personal history of obesity (n=705) | 0.56 (0.30-1.05) | .050 | 0.37 (0.15-0.87) | .030 | 0.81 (0.23-2.90) | .847 |
| With family history of cardiovascular disease (n=670) | 0.42 (0.21-0.83) | .014 | 0.19 (0.07-0.56) | .005 | 0.98 (0.27-3.59) | .833 |
| With family history of diabetes (n=717) | 0.46 (0.25-0.87) | .008 | 0.27 (0.11-0.68) | .004 | 0.92 (0.29-2.94) | .940 |
| With family history of hypertension (n=656) | 0.64 (0.35-1.20) | .116 | 0.38 (0.16-0.89) | .032 | 1.45 (0.40-5.28) | .409 |
95%CI, 95% confidence interval; OR, odds ratio; SUN, Seguimiento Universidad de Navarra.
Logistic regression models adjusted for age at inclusion; age at saliva collection; sex; educational level (years at university, continuous); marital status (single, married, widowed, divorced); family history of hypertension, diabetes, obesity, and cardiovascular disease (dichotomous) (except when we excluded participants with these traits); and prevalence of cancer and depression (dichotomous).
This cross-sectional study found a significantly lower prevalence of short telomeres in participants with ideal CVH (as defined by the AHA) in a sample of a European population older than 55 years, especially among men. According to the AHA, these indicators may improve CVH and prevent CVDs.3
The results found are in line with those of previous studies evaluating CVH and TL in American populations.8,9 Peng et al.8 identified that achieving an ideal CVH was significantly associated with longer TL in American Indians. Moreover, Gebreab et al.9 found shorter TL with poor and intermediate CVH score in individuals from the United States compared with those with an ideal CVH score. Several studies reported an association between shorter TL and cigarette smoking, obesity, low levels of physical activity, poor diet, hypertension, and type 2 diabetes mellitus.10,13,16,18,19,35,36 However, these findings were not reported by other studies.37,38 These inconsistent results may be due to the overall impact of multiple cardiovascular risk factors in contrast with a single one.9
Analysis by sex showed that the association between ideal CVH and TL was significant in men, but not in women. These differences provide an important justification for examining this relationship across subgroups even though the P for interaction was not significant. Peng et al.8 did not find sex differences when addressing the interaction between ideal CVH and TL. Notably, Gebreab et al.9 found an inverse association between CVH and TL in women, but not in men. In other research works, Bekaert et al., 39 found that unhealthy lifestyle factors (smoking, alcohol consumption, physical activity, and diet) were associated with shorter TL in men, but not in women even though the P for interaction was not significant. These sex differences may be explained by a variety of influences such as biological (hormones and menopausal status) and lifestyle factors,40 but the main explanation for sex differences in our study may be due to the low number of women. Another explanation could be related to the unexpected association between total cholesterol and TL in women. The differences in the lipid profile between men and women, and mainly the differences in lipoprotein fractions, low-density lipoprotein and high-density lipoprotein, with higher cholesterol transported in high-density lipoprotein particles in women, could partially explain the differences observed between the 2 sexes. Nevertheless, further research is needed to investigate sex differences when considering the association between CVH and TL.
The mechanisms linking CVH and TL are unclear. However, one possibility is that the observed association may derive from the inflammation and oxidative stress status linked to poor CVH. Several studies have shown that oxidative stress41 or an inflammatory diet34 could favor telomere shortening. In this regard, chronic inflammation and high levels of inflammatory markers42 may contribute to TL shortening.
To support the robustness of our results, we conducted a variety of sensitivity analyses and potential confounders included in the fully adjusted model. Furthermore, the SUN study is considered a high-quality cohort since the participants are university graduates with a homogeneous socioeconomic status, improving the validity of the study, and thus, obtaining more accurate and well-informed self-reports. Moreover, this is the first study evaluating TL and CVH score in a European population older than 55 years.
Strengths and limitationsThe strengths of this study include the technique used for the measurement of TL (RT-qPCR) which allows quantification of telomeres and the single copy gene in the same well in a single reaction, reducing potential measurement errors.
However, this study also has some limitations. First, participants of the SUN cohort had a healthier profile probably because they were graduates and thus they were more aware of the importance of a good diet and lifestyle; therefore, this study may not represent the general population. Second, the low number of women in our study may account for the differences found between the 2 sexes. Third, DNA was isolated from saliva samples containing leukocytes and epithelial cells at varying proportions.43 Even though the measurement of TL differs in cells and tissues, salivary TL and leukocyte TL are positively correlated.43,44 Furthermore, the method is less expensive and less invasive for participants. Fourth, the study design is cross-sectional and thus causal effects cannot be inferred. Fifth, our ability to detect small associations, especially in the stratified analyses, may be limited due to the relatively small sample size. Sixth, it is not the same to study TL as a continuous variable in the whole population and to assess the effect of CVH score, especially in those participants with shorter TL (below the 20th percentile), which is an outcome of greater magnitude. These differences may explain the failure to find significant linear associations between TL and CVH score. Possiby, an ideal CVH score may only exert a protective association for more powerful outcomes than for small changes in TL in the whole population.
CONCLUSIONSIn this cross-sectional study of Spanish adults older than 55 years, we found that men with higher CVH scores exhibited a significantly lower prevalence of short telomeres (≤ 20th percentile). These findings suggest that the prevention and delay of CVD may be achieved with an ideal CVH that may prevent the shortening of telomeres. However, the association between CVH score and short telomeres was present only in men. Further research to confirm these observations is needed using larger longitudinal studies with repeated measures of TL.
FUNDINGThe SUN project and the present study received funding from the Spanish Government-Instituto de Salud Carlos III [CIBEROBN], and the European Regional Development Fund (FEDER), PI17/01795, PI20/00564, PNSD 2020/021 and the Navarra regional government. Two predoctoral students (L. Alonso-Pedrero and A. Ojeda-Rodríguez) received funding from La Caixa Banking Foundation.
AUTHORS’ CONTRIBUTIONSM. Bes-Rastrollo, and A. Marti contributed equally to this work. M. Bes-Rastrollo, A. Marti, G. Zalba, and M.Á. Martínez-González designed the research. L. Alonso-Pedrero, M. Bes-Rastrollo, and A. Marti conducted the research. L. Alonso-Pedrero, A. Ojeda-Rodríguez, C. Razquin, M. Bes-Rastrollo, and A. Marti contributed the reagents, material, and analysis tools. L. Alonso-Pedrero, C. Razquin, M. Bes-Rastrollo, and A. Marti analyzed the data. L. Alonso-Pedrero wrote the manuscript. M. Bes-Rastrollo, and A. Marti had primary responsibility for the final content. All authors read, provided suggestions on, and approved the final version of the manuscript.
CONFLICTS OF INTERESTNone declared.
ACKNOWLEDGEMENTSWe especially thank all the participants in the SUN cohort for their longstanding and enthusiastic collaboration and all members of the SUN study.
- -
TL is considered a marker of biological aging and age-related disorders.
- -
The definition of ideal CVH establishes the first step in setting goals for CVH.
- -
According to the AHA, an ideal CVH is associated with no smoking, vigorous and moderate physical activity, healthy diet, low body mass index, and normal levels of blood pressure, fasting blood glucose and cholesterol.
- -
The association between ideal CVH and TL was assessed in a cross-sectional analysis of 886 European participants from the SUN cohort.
- -
The results showed an association between higher CVH scores and a lower odds of having short telomeres (≤ 20th percentile), especially among men. Moreover, an ideal CVH score was directly associated with longer TL in the same population.
Supplementary data associated with this article can be found in the online version available at https://doi.org/10.1016/j.rec.2021.04.002