The purpose of this study was to investigate whether changes in cardiovascular risk (CVR) are associated with the length and cost of sickness absence.
MethodsA prospective cohort of 179 186 participants was evaluated. Each participant's CVR (SCORE) was assessed on 2 consecutive medical examinations, approximately 1 year apart (365 ± 90 days). Cardiovascular risk was categorized as < 4% or ≥ 4%, and participants were divided into 4 groups according to changes in their risk between the 2 assessments. After the second CVR estimate, a 1-year follow-up was carried out to assess sickness absence. Differences between the 4 groups in terms of the total count of sickness absence days during the follow-up period were tested using Poisson regression models.
ResultsAfter adjustment for covariates, participants who showed an improvement in CVR had a lower count of sickness absence days compared with both those who showed a worsening in risk and those who remained stable at ≥ 4% (RR, 0.91; 95%CI, 0.84-0.98). In comparison with participants whose CVR did not improve, more of the participants whose risk did improve had quit smoking (+17.2%; P < .001), and had controlled their blood pressure (+26.0%, P < .001), total cholesterol (+9.3%; P < .001), low-density lipoprotein cholesterol (+14.9%; P < .001), and triglyceride levels (+14.6%; P < .001).
ConclusionsOur results suggest that an improvement in CVR profile is accompanied by a decrease in sickness absence during a 1-year follow-up.
Keywords
Cardiovascular disease (CVD) is the leading cause of mortality in developed countries.1 Atherosclerosis is the basis of CVD, being present from its early stages.2 Early intervention has been shown to improve outcome, but its cost-effectiveness is controversial.3 Initial treatment consists mainly of lifestyle changes, predominantly those related to diet and physical activity. Some authors suggest that such interventions require trained personnel, which significantly increases cost, without a notable benefit in terms of the number of cardiovascular events and deaths.3
The effect of different cardiovascular risk (CVR) factors when analyzed individually confirms their influence on the duration of sick leave episodes.4,5 In Spain, sickness absence is covered for both work-related and nonwork-related injuries and diseases, but with different regulations.6 Classification as an occupational disease is constrained by a specific list of conditions for defined occupations, developed according to the influence of definitive exposures.7 Occupational injuries, on the other hand, refer to those caused in the context of an accident at work or while commuting.7 The remainder of injuries and diseases are considered nonwork-related. In the case of nonwork-related sickness absence, sick pay extends from the fourth day of sickness absence to 12 months, with the possibility of an additional period of 6 months following an evaluation by the Social Security Institute.7 Sick leave from the beginning to the end of the episode must be certified by the patient's primary care physician and must be confirmed on a weekly basis.6 Occupational diseases and injuries generally involve additional benefits (eg, sick pay from the first day).7
In a previous study, we showed that asymptomatic workers at high CVR, with only a clustering of CVR factors (CVRF), and therefore with undiagnosed underlying early CVD, contributed to a significant increase in the cost of sick leave, and the occurrence of early cardiovascular events.8 According to our data, the estimated increase in the cost of sick leave for the whole Spanish working population was over €145 million per year, suggesting a huge potential for savings to be made.8 The aim of the present study, conducted in a population similar to that included in our previous study,8 was to investigate whether changes in CVR profile are associated with the length and cost of sickness absence.
METHODSThis prospective cohort analysis was a part of the Ibermutuamur CArdiovascular RIsk Assessment (ICARIA) study, the methodology of which has been described elsewhere.9,10 Briefly, CVR factors and global CVR, as estimated using the SCORE (Systematic COronary Risk Evaluation) chart for European low-risk countries, were assessed in a broad and representative sample of the Spanish working population.9,10 All participants who underwent a routine medical examination were approached and included in the ICARIA cohort, provided they gave informed consent. Medical examinations were conducted, consisting of a structured interview, anthropometric and blood pressure measurements, and blood testing. For current analyses, all participants with 2 consecutive medical examinations approximately 1 year apart (365 ± 90 days), and therefore 2 subsequent global CVR estimates, were selected. Participants with coronary heart disease, cerebrovascular disease, peripheral artery disease, or diabetes diagnosed prior to the first medical assessment, were excluded. After the second CVR estimate was performed, data regarding all medically-certified sick leave episodes, and the total count of sick leave days, were obtained from the official register of the Ibermutuamur mutual insurance company during a 1-year follow-up (365 days).8 In Spain, mutual insurance companies provide health care for occupational injuries and diseases.7 They also collaborate with the National Social Security System in case management and distribution of economic support for both work-related and nonwork-related sickness absence episodes.7 The proportion of the working population covered by mutual insurance companies in Spain is 98% for work-related sickness absence and 83% for nonwork-related sickness absence.11 The official records held by these companies are fundamental to the conduction of epidemiological research into sickness absence (especially in the case of nonwork-related sickness absence) due to the lack of an official, centralized, nationwide registry in Spain.
All participants were informed about their CVR and were given recommendations regarding CVRFs control and lifestyle changes (diet and physical exercise). Furthermore, a clinical summary was sent to their primary care physician to encourage the implementation of lifestyle changes and to support any eventual introduction of drug therapy.
Variables MeasuredSociodemographic data, including sex, age (< 45 years old/≥ 45 years old), occupation (blue collar/white collar), occupational categories, and economic activity sector were documented.9 The SCORE system estimates the 10-year risk of a first fatal atherosclerotic event (heart attack, stroke, aortic aneurism, or other). In contrast to other CVR assessment tools, the SCORE charts are exclusively focused on fatal events.12–15 Participants were categorized into 4 groups depending on the change or stability of their CVR: stable at < 4%; improvement in CVR (decrease from ≥ 4% in the first estimate to < 4% in the second estimate); worsening of CVR (increase from < 4% in the first estimate to ≥ 4% in the second estimate); and stable at ≥ 4%. The cutoff point was set at 4% to enable comparison of the results with prior reports from the ICARIA study, in which participants with a SCORE ≥ 4% were considered at moderate-to-high CVR following European Society of Cardiology Guidelines.8,15
In addition, the following variables were assessed:
- •
Tobacco consumption at the time of the medical examination (smoker/nonsmoker).
- •
Progression of tobacco consumption: a) nonsmoker at both medical examinations; b) smoker at the first medical examination but nonsmoker at the second; c) nonsmoker at the first medical examination but smoker at the second, and d) smoker at both medical examinations.
- •
Systolic and diastolic blood pressure (mmHg).
- •
Prior diagnosis of hypertension (yes/no).
- •
Antihypertensive drugs (yes/no).
- •
Progression of hypertension: a) no hypertension at either of the medical examinations; b) no hypertension at the first medical examination but blood pressure ≥ 140/90mmHg without antihypertensive therapy at the second; c) no hypertension at the first medical examination but blood pressure ≥ 140/90mmHg despite antihypertensive therapy at the second; d) hypertension at the first medical examination but blood pressure < 140/90mmHg under antihypertensive therapy at the second; e) hypertension at the first medical examination but blood pressure < 140/90mmHg without antihypertensive therapy at the second; f) hypertension at the first medical examination and blood pressure ≥ 140/90mmHg despite antihypertensive therapy at the second, and g) hypertension at the first medical examination and blood pressure ≥ 140/90mmHg without antihypertensive therapy at the second.
- •
Total cholesterol, low-density lipoprotein cholesterol, high-density lipoprotein cholesterol, and triglyceride levels (mg/dL).
- •
Prior diagnosis of dyslipidemia (yes/no).
- •
Lipid-lowering therapy (yes/no).
- •
Dyslipidemia: defined as prior diagnosis of dyslipidemia, receipt of lipid-lowering therapy, total cholesterol ≥ 200mg/dL, low-density lipoprotein cholesterol ≥ 160mg/dL, high-density lipoprotein cholesterol < 40mg/dL (men)/< 50mg/dL (women), or triglycerides ≥ 200mg/dL.
- •
Progression of dyslipidemia: a) no dyslipidemia; b) no dyslipidemia at the first medical examination but uncontrolled lipid levels despite lipid-lowering therapy at the second; c) no dyslipidemia at the first medical examination but uncontrolled lipid levels without lipid-lowering therapy at the second; d) dyslipidemia at the first medical examination but controlled lipid levels under lipid-lowering therapy at the second; e) dyslipidemia at the first visit but controlled lipid levels without lipid-lowering therapy at the second; f) dyslipidemia at the first medical examination and uncontrolled lipid levels despite lipid-lowering therapy at the second, and g) dyslipidemia at the first medical examination and uncontrolled lipid levels without lipid-lowering therapy at the second.
- •
Body mass index (kg/m2).
- •
Diet: participants following a specific type of diet were identified (low carbohydrate, vegetarian, hypocaloric, low purine, macrobiotic, low sodium, gastric protection, low fat, hepatic protection).
- •
Physical exercise: no routine physical exercise or sport, or ≤ 2hours/week; > 2hours/week.
- •
Prior sickness absence (yes/no): occurrence or not of sick leave episodes between the first and the second CVR estimates.
Regarding dependent variables, the occurrence of sick leave episodes (yes/no) and the total count of sickness absence days during the 1-year follow-up period after the second CVR estimate, were registered. Both variables were assessed for sickness absence of all causes, with a distinction made between work-related sickness absence (sickness absence caused by work injuries and occupational diseases), nonwork-related sickness absence (sickness absence due to nonoccupational injuries and diseases), and sickness absence due to CVD. For sick leave episodes due to CVD, the International Classification of Diseases (Ninth Revision, Clinical Modification) codes 401-414 and 426-443 were considered, with the exception of codes 426.7, 429.0, 430.0, 432.1, 437.3, 437.4, and 437.5, which relate to nonatherosclerotic causes of death. This corresponds to the endpoints defined in the SCORE project.12
Contribution bases to the Social Security System: the contribution basis (€) used to calculate sick pay was also obtained to estimate sickness absence costs. These data are included in the official register of the Ibermutuamur mutual insurance company with the purpose of calculating sick pay during sickness absence. Contribution bases are mainly related to a worker's salary.
Statistical AnalysisDescriptive statistics were obtained for all variables. Categorical data are presented as percentages, with their 95% confidence intervals (95%CI), when appropriate. The total count of sickness absence days is described by medians with 25th and 75th percentiles, owing to the asymmetric distribution of this variable. Means ± standard deviation are also provided. Incidence density rates and their 95%CI for the different types of sickness absence episodes were calculated in the overall sample and by sex, age group, occupation, tobacco consumption progression, prior sickness absence, and CVR progression. Incidence density rates are expressed as incident cases per 100 worker-years. A chi-square test was used for univariate analysis of categorical data. A t test for independent samples, a Mann-Whitney U test, or Kruskal-Wallis 1-way ANOVA (analysis of variance) was used for quantitative data.
The association of changes in CVR profile with the total count of sickness absence days during the follow-up was tested using Poisson regression models (standard error correction), adjusted by sex, age, occupation, tobacco consumption progression, and prior sickness absence. Rate ratios (RR) and their 95%CI were calculated. Associations between changes in single CVRFs and the total number of sickness absence days during follow-up were assessed using Poisson regression analyses, with sex, age, occupation, prior sickness absence, and progression of hypertension, dyslipidemia, and tobacco consumption as covariables. Regression models were calculated for all sickness absence episodes, and for each type of sickness absence (work-related, nonwork-related, and due to CVD).
Finally, the economic impact of an eventual decrease in sickness absence among participants who improved their CVR was estimated by multiplying the mean contribution basis of employees by the estimated decrease in sickness absence days in participants with a SCORE of ≥ 4%, and then by the estimated number of workers with a SCORE of ≥ 4% in Spain (mean estimated decrease in sickness absence = mean sickness absence duration in the CVR ≥ 4% group * RR in the Poisson regression model for the improvement in CVR group). On the basis of the Economically Active Population Survey (fourth quarter of 2008), there were 19 154 000 workers in Spain at the end of the follow-up period.16 The percentage of Spanish workers with an index SCORE of ≥ 4% was estimated to be about 6.9%; ie, 1 321 626 participants were expected to have a SCORE equal to or higher than 4%.10
Ethics IssuesSigned informed consent was obtained from all participants before enrolment in the ICARIA study, in accordance with the principles stated in the Declaration of Helsinki. The protocol was reviewed and approved by the local Ethics Committee.
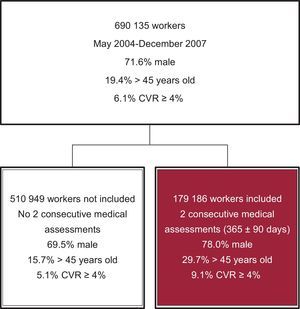
RESULTSFigure 1 shows patient flow. The sample consisted of 179 186 participants, 72.1% of whom were men (Table 1). The mean age (± standard deviation) was 36.7 ± 10.4 years. When the workers were categorized into the 4 groups according to changes in CVR, there were significant differences in their distribution by sex and age (P < .001): 92.9% of participants had a SCORE that was stable at < 4% in the 2 estimates (70.5% men; mean age: 35.7 ± 9.72 years); 2.4% of them displayed a worsening, from an initial SCORE of < 4%, to ≥ 4% in the second estimate (90.1% men; mean age: 48.0 ± 9.89 years); 1.9% of participants displayed an improvement, from an initial SCORE of ≥ 4%, to < 4% at the second medical examination (90.2% men; mean age: 47.3 ± 9.78 years); finally, 2.7% of participants remained stable at ≥ 4% (97.0% men; mean age: 55.06 ± 8.12 years).

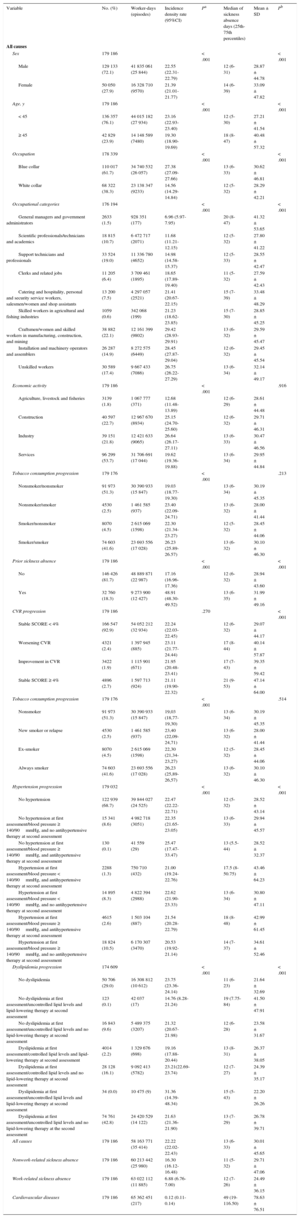
Incidence Densities per 100 Worker-years, and Duration of Sickness Absence Episodes During 1-year Follow-up, After the Second CVR Assessment, in a Cohort of Workers With 2 Consecutive (365 ± 90 Days) Estimates of Their CVR (SCORE Charts), Between 2004 and 2007
| Variable | No. (%) | Worker-days (episodes) | Incidence density rate (95%CI) | Pa | Median of sickness absence days (25th-75th percentiles) | Mean ± SD | Pb |
|---|---|---|---|---|---|---|---|
| All causes | |||||||
| Sex | 179 186 | < .001 | < .001 | ||||
| Male | 129 133 (72.1) | 41 835 061 (25 844) | 22.55 (22.31-22.79) | 12 (6-31) | 28.87 ± 44.78 | ||
| Female | 50 050 (27.9) | 16 328 710 (9570) | 21.39 (21.01-21.77) | 14 (6-39) | 33.09 ± 47.82 | ||
| Age, y | 179 186 | < .001 | < .001 | ||||
| < 45 | 136 357 (76.1) | 44 015 182 (27 934) | 23.16 (22.93-23.40) | 12 (5-30) | 27.21 ± 41.54 | ||
| ≥ 45 | 42 829 (23.9) | 14 148 589 (7480) | 19.30 (18.90-19.69) | 18 (8-47) | 40.48 ± 57.32 | ||
| Occupation | 178 339 | < .001 | < .001 | ||||
| Blue collar | 110 017 (61.7) | 34 740 532 (26 057) | 27.38 (27.09-27.66) | 13 (6-33) | 30.62 ± 46.81 | ||
| White collar | 68 322 (38.3) | 23 138 347 (9233) | 14.56 (14.29-14.84) | 12 (5-32) | 28.29 ± 42.21 | ||
| Occupational categories | 176 194 | < .001 | < .001 | ||||
| General managers and government administrators | 2633 (1.5) | 928 351 (177) | 6.96 (5.97-7.95) | 20 (8-47) | 41.32 ± 53.65 | ||
| Scientific professionals/technicians and academics | 18 815 (10.7) | 6 472 717 (2071) | 11.68 (11.21-12.15) | 12 (5-32) | 27.80 ± 41.22 | ||
| Support technicians and professionals | 33 524 (19.0) | 11 336 780 (4652) | 14.98 (14.58-15.37) | 12 (5-33) | 28.55 ± 42.47 | ||
| Clerks and related jobs | 11 205 (6.4) | 3 709 461 (1895) | 18.65 (17.89-19.40) | 11 (5-32) | 27.59 ± 42.43 | ||
| Catering and hospitality, personal and security service workers, salesmen/women and shop assistants | 13 200 (7.5) | 4 297 057 (2521) | 21.41 (20.67-22.15) | 15 (7-39) | 33.48 ± 48.29 | ||
| Skilled workers in agricultural and fishing industries | 1059 (0.6) | 342 068 (199) | 21.23 (18.62-23.85) | 15 (7-30) | 28.85 ± 45.25 | ||
| Craftsmen/women and skilled workers in manufacturing, construction, and mining | 38 882 (22.1) | 12 161 399 (9802) | 29.42 (28.93-29.91) | 13 (6-32) | 29.59 ± 45.47 | ||
| Installation and machinery operators and assemblers | 26 287 (14.9) | 8 272 575 (6449) | 28.45 (27.87-29.04) | 12 (6-32) | 29.45 ± 45.54 | ||
| Unskilled workers | 30 589 (17.4) | 9 667 433 (7086) | 26.75 (26.22-27.29) | 13 (6-34) | 32.14 ± 49.17 | ||
| Economic activity | 179 186 | < .001 | .916 | ||||
| Agriculture, livestock and fisheries | 3139 (1.8) | 1 067 777 (371) | 12.68 (11.48-13.89) | 12 (6-29) | 28.61 ± 44.48 | ||
| Construction | 40 597 (22.7) | 12 967 670 (8934) | 25.15 (24.70-25.60) | 12 (6-32) | 29.71 ± 46.31 | ||
| Industry | 39 151 (21.8) | 12 421 633 (9065) | 26.64 (26.17-27.11) | 13 (6-33) | 30.47 ± 46.56 | ||
| Services | 96 299 (53.7) | 31 706 691 (17 044) | 19.62 (19.36-19.88) | 13 (6-34) | 29.95 ± 44.84 | ||
| Tobacco consumption progression | 179 176 | < .001 | .213 | ||||
| Nonsmoker/nonsmoker | 91 973 (51.3) | 30 390 933 (15 847) | 19.03 (18.77-19.30) | 13 (6-34) | 30.19 ± 45.35 | ||
| Nonsmoker/smoker | 4530 (2.5) | 1 461 585 (937) | 23.40 (22.09-24.71) | 13 (6-32) | 28.00 ± 41.44 | ||
| Smoker/nonsmoker | 8070 (4.5) | 2 615 069 (1598) | 22.30 (21.34-23.27) | 12 (5-32) | 28.45 ± 44.06 | ||
| Smoker/smoker | 74 603 (41.6) | 23 693 556 (17 028) | 26.23 (25.89-26.57) | 13 (6-32) | 30.10 ± 46.30 | ||
| Prior sickness absence | 179 186 | < .001 | < .001 | ||||
| No | 146 426 (81.7) | 48 889 871 (22 987) | 17.16 (16.96-17.36) | 12 (6-32) | 28.94 ± 43.60 | ||
| Yes | 32 760 (18.3) | 9 273 900 (12 427) | 48.91 (48.30-49.52) | 13 (6-35) | 31.99 ± 49.16 | ||
| CVR progression | 179 186 | .270 | < .001 | ||||
| Stable SCORE < 4% | 166 547 (92.9) | 54 052 212 (32 934) | 22.24 (22.03-22.45) | 12 (6-32) | 29.07 ± 44.17 | ||
| Worsening CVR | 4321 (2.4) | 1 397 945 (885) | 23.11 (21.77-24.44) | 17 (8-44) | 40.14 ± 57.87 | ||
| Improvement in CVR | 3422 (1.9) | 1 115 901 (671) | 21.95 (20.48-23.41) | 17 (7-43) | 39.35 ± 59.42 | ||
| Stable SCORE ≥ 4% | 4896 (2.7) | 1 597 713 (924) | 21.11 (19.90-22.32) | 21 (9-53) | 47.14 ± 64.00 | ||
| Tobacco consumption progression | 179 176 | < .001 | .514 | ||||
| Nonsmoker | 91 973 (51.3) | 30 390 933 (15 847) | 19,03 (18,77-19,30) | 13 (6-34) | 30.19 ± 45.35 | ||
| New smoker or relapse | 4530 (2.5) | 1 461 585 (937) | 23,40 (22,09-24,71) | 13 (6-32) | 28.00 ± 41.44 | ||
| Ex-smoker | 8070 (4.5) | 2 615 069 (1598) | 22,30 (21,34-23,27) | 12 (5-32) | 28.45 ± 44.06 | ||
| Always smoker | 74 603 (41.6) | 23 693 556 (17 028) | 26,23 (25,89-26,57) | 13 (6-32) | 30.10 ± 46.30 | ||
| Hypertension progression | 179 032 | < .001 | < .001 | ||||
| No hypertension | 122 939 (68.7) | 39 844 027 (24 525) | 22.47 (22.22-22.71) | 12 (5-32) | 28.52 ± 43.14 | ||
| No hypertension at first assessment/blood pressure ≥ 140/90mmHg, and no antihypertensive therapy at second assessment | 15 341 (8.6) | 4 982 718 (3051) | 22.35 (21.65-23.05) | 13 (6-33) | 29.94 ± 45.57 | ||
| No hypertension at first assessment/blood pressure ≥ 140/90mmHg, and antihypertensive therapy at second assessment | 130 (0.1) | 41 559 (29) | 25.47 (17.47-33.47) | 13 (5.5-44) | 28.52 ± 32.37 | ||
| Hypertension at first assessment/blood pressure < 140/90mmHg, and antihypertensive therapy at second assessment | 2288 (1.3) | 750 710 (432) | 21.00 (19.24-22.76) | 17.5 (8-50.75) | 43.46 ± 64.23 | ||
| Hypertension at first assessment/blood pressure < 140/90mmHg, and no antihypertensive therapy at second assessment | 14 895 (8.3) | 4 822 394 (2988) | 22.62 (21.90-23.33) | 13 (6-34) | 30.80 ± 47.11 | ||
| Hypertension at first assessment/blood pressure ≥ 140/90mmHg, and antihypertensive therapy at second assessment | 4615 (2.6) | 1 503 104 (887) | 21.54 (20.28-22.79) | 18 (8-48) | 42.99 ± 61.45 | ||
| Hypertension at first assessment/blood pressure ≥ 140/90mmHg, and no antihypertensive therapy at second assessment | 18 824 (10.5) | 6 170 307 (3470) | 20.53 (19.92-21.14) | 14 (7-37) | 34.61 ± 52.46 | ||
| Dyslipidemia progression | 174 609 | < .001 | < .001 | ||||
| No dyslipidemia | 50 706 (29.0) | 16 308 812 (10 612) | 23.75 (23.36-24.14) | 11 (6-23) | 21.64 ± 32.69 | ||
| No dyslipidemia at first assessment/uncontrolled lipid levels and lipid-lowering therapy at second assessment | 123 (0.1) | 42 037 (17) | 14.76 (8.28-21.24) | 19 (7.75-84) | 41.50 ± 47.91 | ||
| No dyslipidemia at first assessment/uncontrolled lipid levels and no lipid-lowering therapy at second assessment | 16 843 (9.6) | 5 489 375 (3207) | 21.32 (20.67-21.98) | 12 (6-28) | 23.58 ± 31.67 | ||
| Dyslipidemia at first assessment/controlled lipid levels and lipid-lowering therapy at second assessment | 4014 (2.2) | 1 329 676 (698) | 19.16 (17.88-20.44) | 13 (8-31) | 26.37 ± 38.05 | ||
| Dyslipidemia at first assessment/controlled lipid levels and no lipid-lowering therapy at second assessment | 28 128 (16.1) | 9 092 413 (5782) | 23.21(22.69-23.74) | 12 (7-27) | 24.39 ± 35.17 | ||
| Dyslipidemia at first assessment/uncontrolled lipid levels and lipid-lowering therapy at second assessment | 34 (0.0) | 10 475 (9) | 31.36 (14.39-48.34) | 15 (5-43) | 22.20 ± 26.26 | ||
| Dyslipidemia at first assessment/uncontrolled lipid levels and no lipid-lowering therapy at the second assessment | 74 761 (42.8) | 24 420 529 (14 122) | 21.63 (21.36-21.90) | 13 (7-29) | 26.78 ± 39.71 | ||
| All causes | 179 186 | 58 163 771 (35 414) | 22.22 (22.02-22.43) | 13 (6-33) | 30.01 ± 45.65 | ||
| Nonwork-related sickness absence | 179 186 | 60 213 442 (25 980) | 16.30 (16.12-16.48) | 11 (5-32) | 29.71 ± 47.06 | ||
| Work-related sickness absence | 179 186 | 63 022 112 (11 885) | 6.88 (6.76-7.00) | 12 (7-26) | 24.49 ± 36.15 | ||
| Cardiovascular diseases | 179 186 | 65 362 451 (217) | 0.12 (0.11-0.14) | 49 (19-116.50) | 78.63 ± 76.51 | ||
95%CI, 95% confidence interval; CVR, cardiovascular risk; SD, standard deviation.
Table 1 and Table 2 show incidence densities of new sickness absence episodes per 100 worker-years during a 1-year follow-up after the second CVR estimate, as well as the number of sickness absence days. The total incidence density of sickness absence episodes of all causes was 22.22 per 100 worker-years (95%CI, 22.02-22.43). With regard to the specific cause of sickness absence, incidence density was 15.75 per 100 worker-years (95%CI, 15.57-15.92) for nonwork-related sickness absence, 6.88 per 100 worker-years (95%CI, 6.76-7.00) for work-related sickness absence, and 0.12 per 100 worker-years (95%CI, 0.11-0.14) for CVD-related sickness absence.
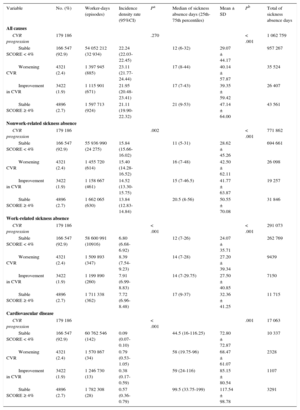
Incidence Densities per 100 Worker-years, and Duration of Sickness Absence Episodes During a 1-year Follow-up, After the Second CVR Assessment, in a Cohort of Workers With 2 Consecutive (365 ± 90 Days) Estimates of Their CVR (SCORE Charts), Between 2004 and 2007, as a Function of 1-year CVR Progression
| Variable | No. (%) | Worker-days (episodes) | Incidence density rate (95%CI) | Pa | Median of sickness absence days (25th-75th percentiles) | Mean ± SD | Pb | Total of sickness absence days |
|---|---|---|---|---|---|---|---|---|
| All causes | ||||||||
| CVR progression | 179 186 | .270 | < .001 | 1 062 759 | ||||
| Stable SCORE < 4% | 166 547 (92.9) | 54 052 212 (32 934) | 22.24 (22.03-22.45) | 12 (6-32) | 29.07 ± 44.17 | 957 267 | ||
| Worsening CVR | 4321 (2.4) | 1 397 945 (885) | 23.11 (21.77-24.44) | 17 (8-44) | 40.14 ± 57.87 | 35 524 | ||
| Improvement in CVR | 3422 (1.9) | 1 115 901 (671) | 21.95 (20.48-23.41) | 17 (7-43) | 39.35 ± 59.42 | 26 407 | ||
| Stable SCORE ≥ 4% | 4896 (2.7) | 1 597 713 (924) | 21.11 (19.90-22.32) | 21 (9-53) | 47.14 ± 64.00 | 43 561 | ||
| Nonwork-related sickness absence | ||||||||
| CVR progression | 179 186 | .002 | < .001 | 771 862 | ||||
| Stable SCORE < 4% | 166 547 (92.9) | 55 936 990 (24 275) | 15.84 (15.66-16.02) | 11 (5-31) | 28.62 ± 45.26 | 694 661 | ||
| Worsening CVR | 4321 (2.4) | 1 455 720 (614) | 15.40 (14.28-16.52) | 16 (7-48) | 42.50 ± 62.11 | 26 098 | ||
| Improvement in CVR | 3422 (1.9) | 1 158 667 (461) | 14.52 (13.30-15.75) | 15 (7-46.5) | 41.77 ± 63.87 | 19 257 | ||
| Stable SCORE ≥ 4% | 4896 (2.7) | 1 662 065 (630) | 13.84 (12.83-14.84) | 20.5 (8-56) | 50.55 ± 70.08 | 31 846 | ||
| Work-related sickness absence | ||||||||
| CVR progression | 179 186 | < .001 | < .001 | 291 073 | ||||
| Stable SCORE < 4% | 166 547 (92.9) | 58 600 991 (10916) | 6.80 (6.68-6.92) | 12 (7-26) | 24.07 ± 35.71 | 262 769 | ||
| Worsening CVR | 4321 (2.4) | 1 509 893 (347) | 8.39 (7.54-9.23) | 14 (7-28) | 27.20 ± 39.34 | 9439 | ||
| Improvement in CVR | 3422 (1.9) | 1 199 890 (260) | 7.91 (6.99-8.83) | 14 (7-29.75) | 27.50 ± 40.85 | 7150 | ||
| Stable SCORE ≥ 4% | 4896 (2.7) | 1 711 338 (362) | 7.72 (6.96-8.48) | 17 (9-37) | 32.36 ± 41.25 | 11 715 | ||
| Cardiovascular disease | ||||||||
| CVR progression | 179 186 | < .001 | .001 | 17 063 | ||||
| Stable SCORE < 4% | 166 547 (92.9) | 60 762 546 (142) | 0.09 (0.07-0.10) | 44.5 (16-116.25) | 72.80 ± 72.87 | 10 337 | ||
| Worsening CVR | 4321 (2.4) | 1 570 867 (34) | 0.79 (0.53-1.05) | 58 (19.75-96) | 68.47 ± 61.07 | 2328 | ||
| Improvement in CVR | 3422 (1.9) | 1 246 730 (13) | 0.38 (0.17-0.59) | 59 (24-116) | 85.15 ± 80.54 | 1107 | ||
| Stable SCORE ≥ 4% | 4896 (2.7) | 1 782 308 (28) | 0.57 (0.36-0.79) | 99.5 (33.75-199) | 117.54 ± 98.78 | 3291 | ||
95%CI, 95% confidence interval; CVR, cardiovascular risk; SD, standard deviation.
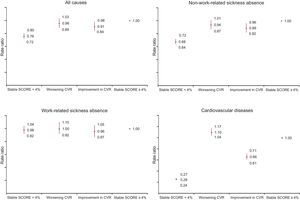
As shown in Figure 2, after adjustment for covariates, the 1-year change in CVR profile remained significantly associated with the total count of sickness absence days at the end of the study (P < .001). Participants with a stable CVR of < 4% in both routine medical examinations had a lower count of sickness absence days than participants with a stable CVR of ≥ 4% (Figure 2). The group of participants who improved their CVR level from ≥ 4% to < 4% also showed a lower count of sickness absence days during follow-up in comparison with participants with a stable SCORE of ≥ 4%. This decrease was observed for the whole group of sickness absence episodes (RR, 0.91; 95%CI, 0.84-0.98), for nonwork-related episodes (RR, 0.89; 95%CI, 0.82-0.96), and for sickness absence due to CVD (RR, 0.66; 95%CI, 0.61-0.71), but not for work-related sickness absence (RR, 0.96; 95%CI, 0.87-1.05). In contrast, the group of participants that displayed a worsening of their CVR did not differ from participants with a stable SCORE of ≥ 4% in terms of nonwork-related and work-related sickness absence (P ≥ .05), but showed increased sickness absence due to CVD during follow-up (RR, 1.10; 95%CI, 1.04-1.17). Mean savings per participant in terms of sick pay associated with improvement in CVR were estimated at €40.03 per year (± €1766.37). When extrapolated to the whole Spanish working population at CVR ≥ 4%, the potential savings amounted to €52 026 686.80 per year (95%CI, €80 084 480.40-€1 503 558.30).
 with the total count of sickness absence days during 1-year follow-up after the second evaluation of their CVR (SCORE charts). Poisson regression analyses (standard error correction). CVR, cardiovascular risk.")
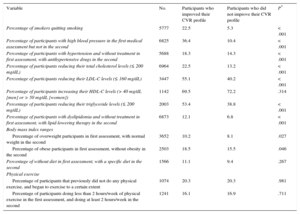
Table 3 shows the percentages of participants with differences in CVRFs and lifestyle, comparing those with improvement to those with no improvement in their CVR. These data show significantly higher percentages for those participants with an improvement in CVR, for all the parameters considered. The only exception was lifestyle (diet and physical exercise), which exhibited a positive trend that did not reach statistical significance.
Differences in Percentage of Participants With Changes in CVR Factors Between the First and Second CVR Assessment, Among Participants Who Improved and did not Improve Their CVR Profile, From a SCORE of ≥ 4% to < 4%
| Variable | No. | Participants who improved their CVR profile | Participants who did not improve their CVR profile | P* |
|---|---|---|---|---|
| Percentage of smokers quitting smoking | 5777 | 22.5 | 5.3 | < .001 |
| Percentage of participants with high blood pressure in the first medical assessment but not in the second | 6825 | 36.4 | 10.4 | < .001 |
| Percentage of participants with hypertension and without treatment in first assessment, with antihypertensive drugs in the second | 5688 | 18.3 | 14.3 | < .001 |
| Percentage of participants reducing their total cholesterol levels (≤ 200 mg/dL) | 6964 | 22.5 | 13.2 | < .001 |
| Percentage of participants reducing their LDL-C levels (≤ 160 mg/dL) | 3447 | 55.1 | 40.2 | < .001 |
| Percentage of participants increasing their HDL-C levels (> 40 mg/dL [men] or > 50 mg/dL [women]) | 1142 | 69.5 | 72.2 | .314 |
| Percentage of participants reducing their triglyceride levels (≤ 200 mg/dL) | 2003 | 53.4 | 38.8 | < .001 |
| Percentage of participants with dyslipidemia and without treatment in first assessment, with lipid-lowering therapy in the second | 6873 | 12.1 | 6.8 | < .001 |
| Body mass index ranges | ||||
| Percentage of overweight participants in first assessment, with normal weight in the second | 3652 | 10.2 | 8.1 | .027 |
| Percentage of obese participants in first assessment, without obesity in the second | 2503 | 18.5 | 15.5 | .046 |
| Percentage of without diet in first assessment, with a specific diet in the second | 1566 | 11.1 | 9.4 | .267 |
| Physical exercise | ||||
| Percentage of participants that previously did not do any physical exercise, and began to exercise to a certain extent | 1074 | 20.3 | 20.3 | .981 |
| Percentage of participants doing less than 2 hours/week of physical exercise in the first assessment, and doing at least 2 hours/week in the second | 1241 | 16.1 | 16.9 | .711 |
CVR, cardiovascular risk; HDL-C, high-density lipoprotein cholesterol; LDL-C, low-density lipoprotein cholesterol.
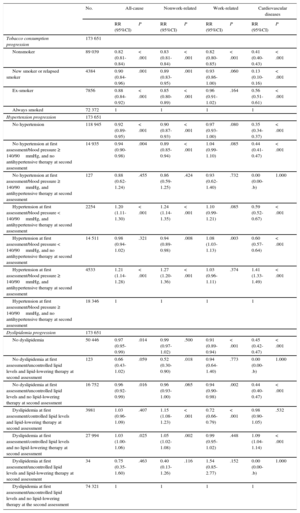
When associations between CVRF progression and sickness absence were tested, tobacco consumption progression was consistently associated with sickness absence (Table 4). Workers who stopped smoking between the 2 medical examinations had a lower risk of sickness absence than those who continued to smoke (RR, 0.88; 95%CI, 0.84-0.92), although the risk was lower still for patients who were nonsmokers at both medical examinations (RR, 0.82; 95%CI, 0.81-0.84). The same trend was observed for nonwork-related sickness absence and sickness absence due to CVD, but not for work-related sickness absence.
Associations Between 1-year CVR Factor Trend (365 ± 90 Days) and the Total Number of Sickness Absence Days During the 1-year Follow-up After the Second Evaluation of Their CVR (SCORE Charts), Stratified by Cause of Sickness Absence. Poisson Regression Analyses (Standard Error Correction), Adjusted by Sex, Age, Occupation, and Prior Sickness Absence
| No. | All-cause | Nonwork-related | Work-related | Cardiovascular diseases | |||||
|---|---|---|---|---|---|---|---|---|---|
| RR (95%CI) | P | RR (95%CI) | P | RR (95%CI) | P | RR (95%CI) | P | ||
| Tobacco consumption progression | 173 651 | ||||||||
| Nonsmoker | 89 039 | 0.82 (0.81-0.84) | < .001 | 0.83 (0.81-0.84) | < .001 | 0.82 (0.80-0.85) | < .001 | 0.41 (0.40-0.43) | < .001 |
| New smoker or relapsed smoker | 4384 | 0.90 (0.84-0.96) | .001 | 0.89 (0.83-0.95) | .001 | 0.93 (0.86-1.00) | .060 | 0.13 (0.10-0.16) | < .001 |
| Ex-smoker | 7856 | 0.88 (0.84-0.92) | < .001 | 0.85 (0.80-0.89) | < .001 | 0.96 (0.91-1.02) | .164 | 0.56 (0.51-0.61) | < .001 |
| Always smoked | 72 372 | 1 | 1 | 1 | 1 | ||||
| Hypertension progression | 173 651 | ||||||||
| No hypertension | 118 945 | 0.92 (0.89-0.95) | < .001 | 0.90 (0.87-0.93) | < .001 | 0.97 (0.93-1.00) | .080 | 0.35 (0.34-0.37) | < .001 |
| No hypertension at first assessment/blood pressure ≥ 140/90mmHg, and no antihypertensive therapy at second assessment | 14 935 | 0.94 (0.90-0.98) | .004 | 0.89 (0.85-0.94) | < .001 | 1.04 (0.99-1.10) | .085 | 0.44 (0.41-0.47) | < .001 |
| No hypertension at first assessment/blood pressure ≥ 140/90mmHg, and antihypertensive therapy at second assessment | 127 | 0.88 (0.62-1.24) | .455 | 0.86 (0.59-1.25) | .424 | 0.93 (0.62-1.40) | .732 | 0.00 (0.00-.b) | 1.000 |
| Hypertension at first assessment/blood pressure < 140/90mmHg, and antihypertensive therapy at second assessment | 2254 | 1.20 (1.11-1.30) | < .001 | 1.24 (1.14-1.35) | < .001 | 1.10 (0.99-1.21) | .085 | 0.59 (0.52-0.67) | < .001 |
| Hypertension at first assessment/blood pressure < 140/90mmHg, and no antihypertensive therapy at second assessment | 14 511 | 0.98 (0.94-1.02) | .321 | 0.94 (0.89-0.98) | .008 | 1.08 (1.03-1.13) | .003 | 0.60 (0.57-0.64) | < .001 |
| Hypertension at first assessment/blood pressure ≥ 140/90mmHg, and antihypertensive therapy at second assessment | 4533 | 1.21 (1.14-1.28) | < .001 | 1.27 (1.20-1.36) | < .001 | 1.03 (0.96-1.11) | .374 | 1.41 (1.33-1.49) | < .001 |
| Hypertension at first assessment/blood pressure ≥ 140/90mmHg, and no antihypertensive therapy at second assessment | 18 346 | 1 | 1 | 1 | 1 | ||||
| Dyslipidemia progression | 173 651 | ||||||||
| No dyslipidemia | 50 446 | 0.97 (0.95-0.99) | .014 | 0.99 (0.97-1.02) | .500 | 0.91 (0.89-0.94) | < .001 | 0.45 (0.42-0.47) | < .001 |
| No dyslipidemia at first assessment/uncontrolled lipid levels and lipid-lowering therapy at second assessment | 123 | 0.66 (0.43-1.02) | .059 | 0.52 (0.30-0.90) | .018 | 0.94 (0.64-1.40) | .773 | 0.00 (0.00-.b) | 1.000 |
| No dyslipidemia at first assessment/uncontrolled lipid levels and no lipid-lowering therapy at second assessment | 16 752 | 0.96 (0.92-0.99) | .016 | 0.96 (0.93-1.00) | .065 | 0.94 (0.90-0.98) | .002 | 0.44 (0.40-0.47) | < .001 |
| Dyslipidemia at first assessment/controlled lipid levels and lipid-lowering therapy at second assessment | 3981 | 1.03 (0.96-1.09) | .407 | 1.15 (1.08-1.23) | < .001 | 0.72 (0.66-0.79) | < .001 | 0.98 (0.90-1.05) | .532 |
| Dyslipidemia at first assessment/controlled lipid levels and no lipid-lowering therapy at second assessment | 27 994 | 1.03 (1.00-1.06) | .025 | 1.05 (1.02-1.08) | .002 | 0.99 (0.95-1.02) | .448 | 1.09 (1.04-1.14) | < .001 |
| Dyslipidemia at first assessment/uncontrolled lipid levels and lipid-lowering therapy at second assessment | 34 | 0.75 (0.35-1.60) | .463 | 0.40 (0.13-1.26) | .116 | 1.54 (0.85-2.77) | .152 | 0.00 (0.00-.b) | 1.000 |
| Dyslipidemia at first assessment/uncontrolled lipid levels and no lipid-lowering therapy at the second assessment | 74 321 | 1 | 1 | 1 | 1 | ||||
95%CI, 95% confidence interval; CVR, cardiovascular risk; RR, rate ratio.
Findings regarding the association between progression of hypertension and sickness absence were mixed (Table 4). Patients who were hypertensive at the first medical examination and under antihypertensive therapy at the second assessment had an increased risk of all-cause sickness absence, regardless of hypertensive status at the second visit (RR, 1.20; 95%CI, 1.11-1.30 for no hypertension; RR, 1.21; 95%CI, 1.14-1.28 for hypertension at the second visit). The same trend was also observed for nonwork-related sickness absence. Conversely, patients who were hypertensive at the first medical examination and under antihypertensive therapy at the second had a reduced risk of sickness absence due to CVD if blood pressure had been successfully controlled (RR, 0.59; 95%CI, 0.52-0.67), but not if blood pressure was still ≥ 140/90mmHg (RR, 1.41; 95%CI, 1.33-1.49). Findings regarding dyslipidemia progression were also mixed (Table 4).
DISCUSIONThe main finding of the present study was the decrease in sickness absence in participants showing an improvement in their CVR profile from ≥ 4% to < 4%, according to the SCORE chart, during the 1-year follow-up period. Such a reduction in sickness absence was observed for nonwork-related and CVD absence. The association of CVR reduction with decreased sickness absence was still significant after adjustment for sex, age, occupation, tobacco consumption, and the incidence of prior sickness absence.
Our results suggest that positive changes in CVRFs are involved in sickness absence reduction during a 1-year follow-up. The improvement in CVR profile was the result of higher percentages of participants achieving controlled blood pressure and total cholesterol, low-density lipoprotein cholesterol, and triglycerides levels, and stopping smoking by the second medical examination. The percentages of participants with hypertension taking antihypertensive drugs, and participants with dyslipidemia receiving lipid-lowering therapy, also increased in this group 1 year after the initial assessment. A consistent association between tobacco consumption and sickness absence was observed, ranging from the lowest risk in nonsmokers at both examinations to the highest risk in those who were smokers at both. Blood pressure control among hypertensive participants appeared to be associated with a decrease in the risk of sickness absence caused by CVD. In contrast, the consistent association between antihypertensive treatment and increase in the risk of all-cause (and, more specifically, nonwork-related) sickness absence suggests that antihypertensive drug prescription could be interpreted as a severity marker (ie, antihypertensive drugs were only prescribed in the most serious of cases). If this were true, it could imply the need for a revision of current prescription practice, especially when patients are theoretically “young and healthy”. Our findings regarding progression of dyslipidemia are complex and could be related to the small number of participants receiving lipid-lowering therapy.
Our results also demonstrate that sickness absence of nonwork-related and work-related origin among participants with a worsening of their CVR from < 4% to ≥ 4% was similar to that observed in participants whose risk remained stable at ≥ 4%. Furthermore, sickness absence due to new-onset CV illnesses increased during the 1-year follow-up for this group. These findings should encourage occupational health care providers to focus health promotion programs not only on participants at high risk, but also on those at low risk who could potentially experience worsening of their risk.5
Several mechanisms have been proposed to explain the link between CVR and non-CVD sickness absence: the association of CVR with proinflammatory or prothrombotic states, which may contribute to a number of non-CVD diseases (eg, respiratory diseases, musculoskeletal pathology, or infectious diseases); involvement of health risk behaviors that are risk factors for other diseases; and a hypothetical underlying risky personality type.8
In a previous report, we showed that high CVR is associated with enormous cost in terms of sickness absence among the working population.8 The present results suggest that those costs could be significantly reduced in the short-term if CVR was successfully improved. Our findings are in line with a previous report on changes in health care, pharmacy, and short-term disability costs among manufacturing participants who improved their metabolic syndrome status.5 Prior research has not always demonstrated a reduction in sickness absence as a consequence of lifestyle modification.17 The reasons for this apparent discrepancy with the results reported here could be differences in the explanatory variables (estimated CVR or lifestyle parameters) or in the methodology of the studies. In some cases, the scientific evidence was obtained from selected populations, or was exclusively based on self-reported data.17 If our findings were to be confirmed, a reduction in sickness absence costs should be added to the decrease in the incidence of absences and in mortality associated with improvement in the control of CVRFs in most developed countries.18
Of importance, in our experience, 40% of participants with an elevated CVR profile at baseline showed an improvement 1 year later. In the remaining individuals, the CVR profile remained at ≥ 4%. In addition, the number of workers with a SCORE of ≥ 4% in the second medical examination increased as a consequence of the more than 4000 participants that moved from the < 4% to the ≥ 4% risk category. These results strongly suggest a need to improve the level of intervention used for our workers, with Health Promotion at Workplace Programs being potentially useful for this purpose.17 Changes in lifestyle are critical for CVR reduction,19 and the significant decrease in the cost of sick leave episodes that is associated with improvement in CVR profile is notable.
Strengths and LimitationsThe strengths of the current study include the prospective design, with 2 consecutive assessments of CVR and CVRFs in a large sample of the Spanish working population. Data on sickness absence were based on the official registers of the Ibermutuamur mutual insurance company, and the association between CVR progression and sickness absence was also tested prospectively. In the ICARIA study, CVRFs were assessed by trained physicians, following a rigorous protocol by means of objective measures and structured interviews. In addition, the ICARIA cohort can be considered representative of the Spanish labor force.9
The limitations of the study are mainly related to the SCORE charts, which may overestimate CVR in individuals older than 65 years or in younger individuals. Another limitation is that important variables such as a family history of early-onset coronary heart disease, impaired glucose tolerance, and hypertriglyceridemia are not included in the charts. Furthermore, factors such as heart rate were not included in the current analysis, and there is a lack of information concerning the specific type and dosing of drugs prescribed for each patient. Mean age was significantly different among CVR progression groups, though this was adjusted for in the regression analyses. The 1-year follow-up in the current study could be too short. If that were true, we could hypothesize that the association of CVR with sickness absence reported here would have been underestimated. Finally, we cannot disregard the idea that workers who attend 2 consecutive medical assessments may be particularly health-conscious, and could therefore represent a select population. Indeed, data shown in Figure 1 suggest that there are differences between participants who attended 1 compared with > 1 medical assessment; however, these observations reveal that the latter participants were significantly less healthy.
CONCLUSIONSA stable or improved CVR level during a 1-year period, as estimated by SCORE charts for low-risk European countries, was significantly associated with shorter nonwork-related sickness absence, and shorter absence due to CVD, during a subsequent 1-year follow-up period. Further research will determine whether Health Promotion at Workplace Programs is cost-effective.
FUNDINGThis study was funded by a research project grant (FIS PI12/02812) from the Health Institute Carlos III and the Spanish Ministry of Economy and Competitiveness.
CONFLICTS OF INTERESTNone declared.
- –
There is a high prevalence of CVRF among the working Spanish population.
- –
More than 6% of Spanish workers have a CVR of ≥ 4%.
- –
Cardiovascular risk in asymptomatic participants is significantly associated with the duration and cost of sickness absence due to cardiovascular and non-CVD causes.
- –
A reduction in CVR translates into a reduction in sickness absence.
- –
This reduction could be explained by smoking cessation and control of blood pressure/lipid levels.
The authors thank Joan Minguet, Katherine Smith, and Helen Sims at the Institute for Research and Medicine Advancement for the editorial assistance provided in the preparation of this manuscript.