Adults with disability have higher risk of all-cause mortality, but evidence on their risk of cardiovascular mortality is scarce. This study aimed to evaluate the association between disability severity and mortality from cardiovascular causes among community-dwelling adults.
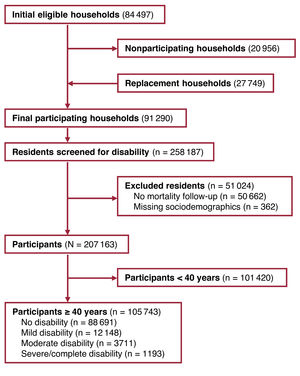
MethodsA representative cohort of 105 743 community-dwelling Spanish adults aged 40 years or older was screened for disability severity within the framework of the international classification of functioning, disability, and health from 2007 to 2008 and was followed up for cardiovascular mortality until 2017. Five- and 10-year cardiovascular mortality risks in each disability category were standardized by sociodemographic characteristics using inverse probability weighting and corrected for competing causes of death. Bias analyses were performed to quantify residual confounding by unmeasured baseline cardiovascular conditions.
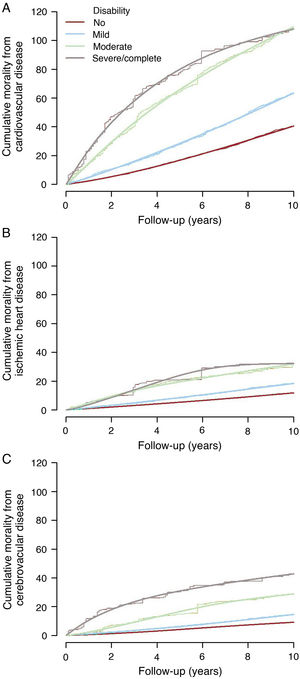
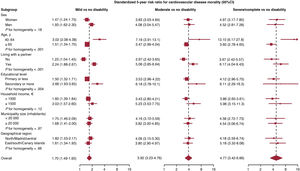
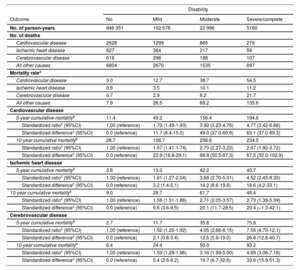
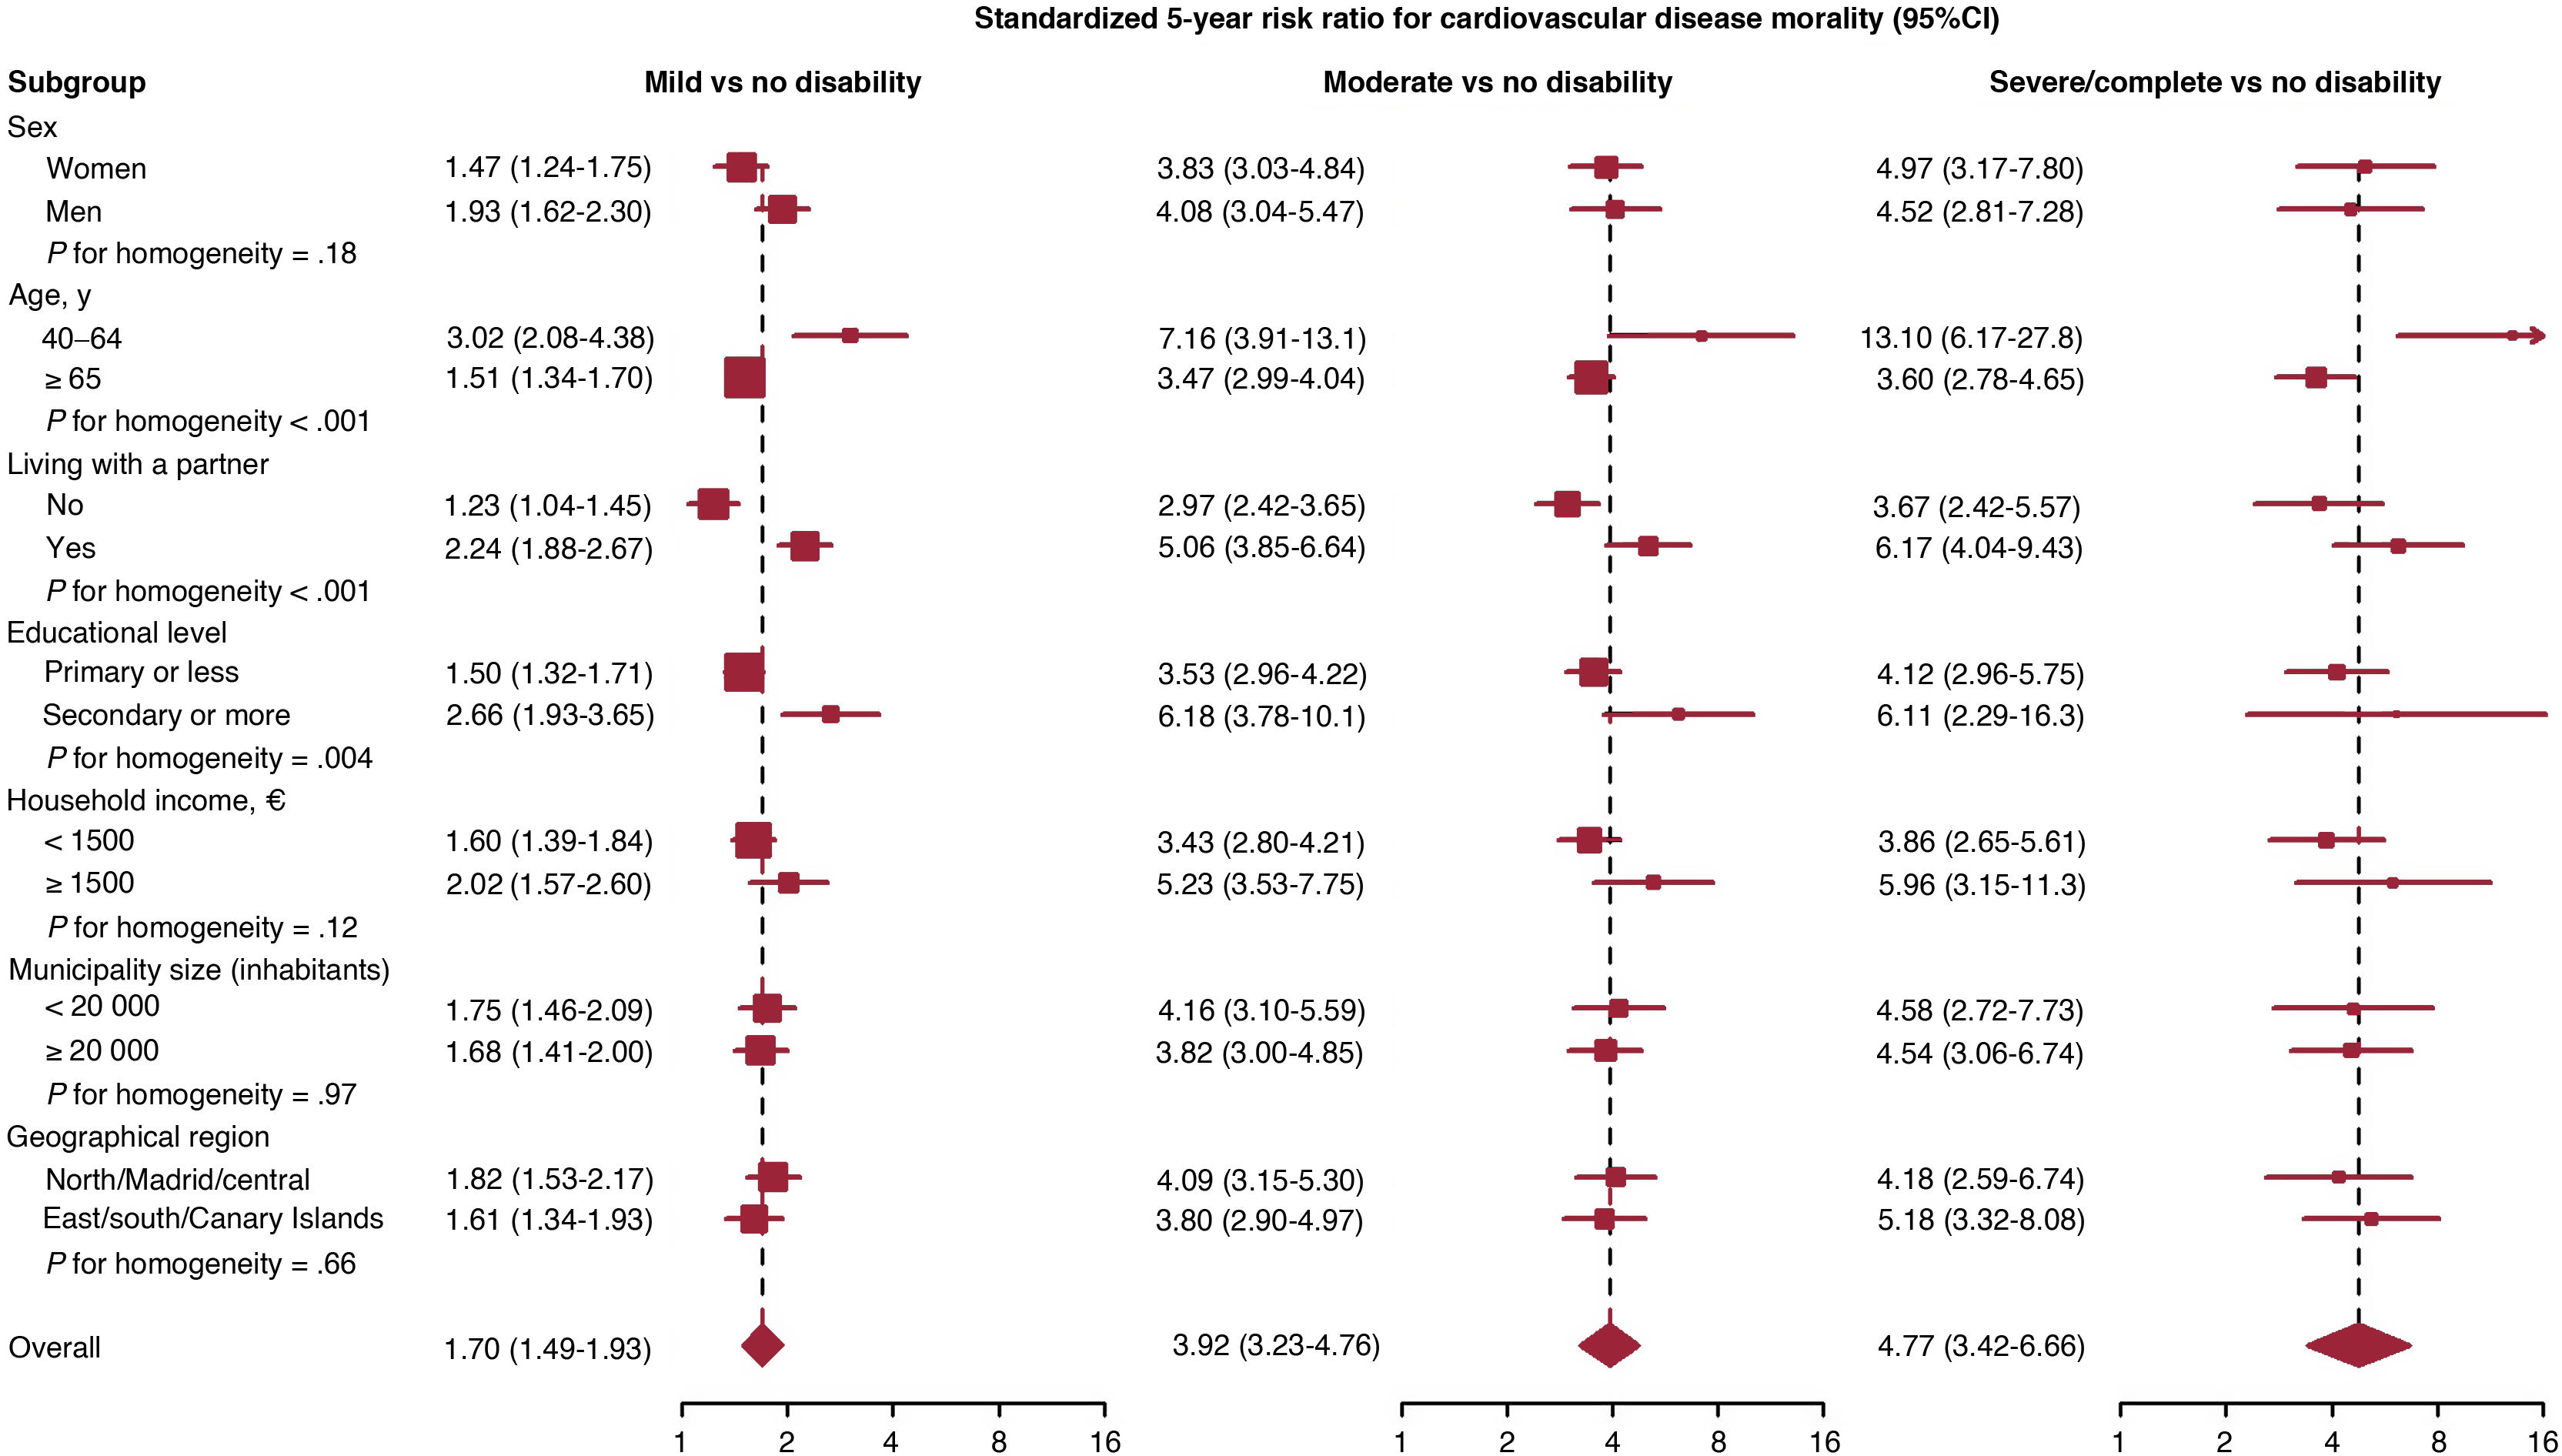
ResultsThe baseline prevalence of disability was 16.2% (95%CI, 15.9-16.4), including 11.5% with mild, 3.5% with moderate, and 1.1% with severe/complete disability. Compared with no disability, the standardized 5-year risk ratios for cardiovascular mortality (95%CI) were 1.70 (1.49-1.93), 3.92 (3.23-4.76), and 4.77 (3.42-6.66) for mild, moderate, and severe/complete disability, respectively, corresponding to 11.7 (8.4-15.0), 49.0 (37.0-60.9), and 63.1 (37.0-89.3) excess cardiovascular deaths per 1000 persons. The positive confounding in these risk ratios by unmeasured prevalent cardiovascular conditions was 5.9%. Results were similar for ischemic heart disease and cerebrovascular mortality and were sustained after 10 years of follow-up.
ConclusionsAdults with disability have higher mortality from cardiovascular causes. Conditions that increase cardiovascular risk in people with disability should be investigated. Preventive measures and health promotion initiatives are needed to reduce the risk of cardiovascular mortality in this population.
Keywords
The definition of disability includes “impairments, activity limitations, and participation restrictions”1 and disability arises from the interaction between contextual factors and the health condition of the person.1 The prevalence of disability is considerable, being approximately 18.0% in lower-income countries and 11.8% in higher-income countries.1 Moreover, it has been suggested that several risk factors1 and secondary health conditions2 could be more prevalent in people with disability, and they might increase the risk of cardiovascular disease and its consequences in this population.3
A limited number of studies with long follow-ups have reported the association between disability and cardiovascular mortality,4–10 all of them finding relevant associations. However, some of these studies only focused on older adults4,5,7 and/or did not perform specific analyses for different sociodemographic groups.4,6,7,10 Furthermore, only 3 of them studied the association by disability severity categories8–10 and 1 of them found that cardiovascular mortality by disability severity categories increased only in males.9 Finally, only Forman-Hoffman et al.8 assessed the association by several specific causes of cardiovascular death.
Thus, the main objective of this study was to assess the associations between disability and cardiovascular mortality (overall and for several specific causes) among disability severity categories, and for the different sociodemographic groups, in a large representative cohort of the population aged 40 years or older in Spain.
METHODSStudy populationThis cohort study used 10-year mortality follow-up data from the Survey on Disability, Personal Autonomy, and Dependency 2008 (Encuesta de Discapacidad, Autonomía Personal y Situaciones de Dependencia 2008, EDAD-08).11 The survey was conducted from November 2007 to February 2008 in a large representative sample of the community-dwelling population of Spain. Participants were selected through a 2-stage sampling method stratified by province and municipality size, in which 3843 census tracts were selected with probability proportional to their size, and 25 households were randomly sampled within each selected census tract. Of the 84 497 eligible households, 63 541 agreed to participate (response rate of 75.2%). Additionally, 27 749 ineligible or nonresponding households were randomly replaced with other households in the same census tracts. All 258 187 residents in the 91 290 participating households were screened for disability. Sampling weights were assigned to study participants to account for the different selection probabilities by province and household composition, as well as the diverse response rates by sex and age group.11
For the present study, we excluded 50 662 survey participants (19.6%) without sufficient identification data for mortality follow-up, and 362 participants (0.1%) with missing information on baseline sociodemographic characteristics. We also excluded 101 420 participants (39.3%) younger than 40 years, since the reduced number of cardiovascular deaths by disability category precluded accurate analyses in this age range (23, 5, 2, and 2 cardiovascular deaths after 10-year follow-up of participants aged 18 to 39 years with no, mild, moderate, and severe/complete disability, respectively). Thus, the final cohort consisted of 105 743 noninstitutionalized adults aged 40 years or older (figure 1).
Baseline disability and mortality follow-upBaseline information on the disability of each resident in the household was obtained through personal interviews, first with the main household informant and then with those residents identified as having a possible disability. In the EDAD-08 survey, disability was defined as any significant limitation in carrying out basic activities without external help or supervision, caused by an impairment that had lasted or was expected to last more than 1 year. The disability questionnaire included 44 items, grouped into the following 8 domains: vision, hearing, communication, learning and application of knowledge and performance of tasks, mobility, self-care, home life, and interactions and interpersonal relationships.11 People who responded affirmatively to any of these questions formed the disability group. To assess disability severity, 29 selected items of the EDAD-08 questionnaire were back-coded to specific d2–d7 domains of the International Classification of Functioning, Disability, and Health (ICF) checklist.12,13 Based on the reported difficulty in performing each task, a global ICF score was calculated and categorized into mild, moderate, and severe/complete disability according to ICF categories. Further details on disability assessment can be found elsewhere.14
Age, sex, living with a partner, attained educational level, and monthly household income were obtained by interview. For 6616 of 64 861 households (10.2%) with missing income, we assigned the most frequent income category within their census tracts (intraclass correlation of 0.21 between household incomes in the same census tract). Place of residence was classified according to municipality size and first-level NUTS region (northwest, northeast, Madrid, central, east, south, or Canary Islands). The physician's diagnosis of cardiovascular disease (heart or cerebrovascular disease) at baseline was collected from the disability questionnaire and was therefore only available in participants with a disability.
Mortality data were provided by the Spanish National Institute of Statistics, which registers all deaths in Spain and their underlying causes.15 The study outcomes were deaths from ischemic heart disease (codes I20–I25 of the International Statistical Classification of Diseases and Related Health Problems, 10th Revision), cerebrovascular disease (codes I60–I69), and cardiovascular disease (codes I00–I99). Participants contributed follow-up time from their 2007 to 2008 baseline interview until death from cardiovascular disease, death from all other causes (competing risk), or 31 December 2017 (administrative censoring).
Statistical analysisThe cumulative cardiovascular disease mortality for each disability category (none, mild, moderate, or severe/complete) was standardized to the sampling-weighted distribution of baseline sociodemographic characteristics in the entire community-dwelling Spanish population aged 40 years or older by using inverse probability of exposure weighs.16 We first fitted a sampling-weighted polytomous logistic model to estimate each participant's population probability of being in its own observed disability category given sex, age, living with a partner, educational level, household income, municipality size, and geographical region. The model included main terms for each category of sociodemographic characteristics displayed in table 1, as well as first-order interaction terms of sex and age group (< or ≥ 55 years) with partner, education, and income categories to allow for distinct sex- and age-specific confounding. Standardization weights were calculated as the inverse of the conditional probabilities estimated from the model, further rescaled by the sampling-weighted marginal proportions in each disability category to stabilize weights.16 Combined weights were then assigned to survey participants as the product of sampling and standardization weights, thus correcting for both selection bias and confounding by sociodemographic characteristics.17 After trimming 11 upper extreme weights, the mean [range] combined weight was 1.00 [0.01–30.0] (figure 1 of the supplementary data). This weighting provided effective standardization, since the fully weighted distributions of baseline sociodemographic characteristics were fairly similar among disability categories and matched their sampling-weighted distributions in the entire community-dwelling population (table 1 of the supplementary data).
Participants’ baseline characteristics by disability category in the survey on disability, personal autonomy, and dependency, Spain, 2007 to 2008a
| Disability | ||||||
|---|---|---|---|---|---|---|
| Characteristic | Overall | No | Mild | Moderate | Severe/complete | Pb |
| No. of participants | 105 743 (100) | 88 691 (83.8) | 12 148 (11.5) | 3711 (3.5) | 1193 (1.1) | |
| Sex | <.001 | |||||
| Women | 55 638 (52.7) | 45 158 (51.0) | 7222 (59.7) | 2472 (66.7) | 786 (66.5) | |
| Men | 50 105 (47.3) | 43 533 (49.0) | 4926 (40.3) | 1239 (33.3) | 407 (33.5) | |
| Age, y | <.001 | |||||
| 40-54 | 46 155 (44.1) | 43 299 (49.3) | 2316 (19.4) | 428 (12.1) | 112 (9.6) | |
| 55-64 | 23 471 (22.3) | 20 555 (23.3) | 2431 (20.1) | 397 (10.2) | 88 (7.1) | |
| 65-74 | 18 848 (17.4) | 15 102 (16.5) | 2934 (23.8) | 642 (16.9) | 170 (14.0) | |
| 75-84 | 13 623 (12.6) | 8469 (9.3) | 3454 (27.5) | 1305 (35.0) | 395 (33.0) | |
| ≥ 85 | 3646 (3.6) | 1266 (1.5) | 1013 (9.2) | 939 (25.7) | 428 (36.3) | |
| Living with a partner | <.001 | |||||
| No | 25 031 (25.3) | 18 042 (21.9) | 4331 (38.5) | 1937 (54.3) | 721 (61.1) | |
| Yes | 80 712 (74.7) | 70 649 (78.1) | 7817 (61.5) | 1774 (45.7) | 472 (38.9) | |
| Educational level | <.001 | |||||
| Less than primary | 25 583 (23.7) | 17 596 (19.3) | 5133 (41.9) | 2090 (55.3) | 764 (65.3) | |
| Primary | 35 015 (31.1) | 29 648 (31.2) | 4032 (32.1) | 1038 (27.2) | 297 (23.5) | |
| Secondary | 28 812 (28.5) | 26 120 (30.8) | 2182 (18.6) | 414 (12.4) | 96 (7.3) | |
| University | 16 333 (16.6) | 15 327 (18.6) | 801 (7.4) | 169 (5.1) | 36 (3.9) | |
| Monthly household income,€ | <.001 | |||||
| <1000 | 32 597 (28.4) | 24 199 (24.7) | 6062 (48.1) | 1838 (48.7) | 498 (40.7) | |
| 1000-1500 | 26 355 (24.3) | 22 238 (24.4) | 2892 (23.4) | 894 (23.6) | 331 (27.2) | |
| 1500-2000 | 18 033 (17.5) | 15 862 (18.3) | 1529 (13.4) | 476 (13.1) | 166 (14.9) | |
| 2000-2500 | 11 596 (11.6) | 10 486 (12.5) | 784 (6.8) | 219 (5.8) | 107 (9.1) | |
| ≥ 2500 | 17 162 (18.3) | 15 906 (20.2) | 881 (8.2) | 284 (8.8) | 91 (8.0) | |
| Municipality size (inhabitants) | <.001 | |||||
| <10 000 | 31 720 (22.6) | 26 213 (22.0) | 3885 (24.7) | 1190 (26.2) | 432 (29.8) | |
| 10 000-20 000 | 11 214 (10.1) | 9410 (10.1) | 1237 (9.7) | 441 (11.9) | 126 (11.0) | |
| 20 000-50 000 | 12 807 (13.8) | 10 934 (14.1) | 1337 (12.7) | 406 (12.6) | 130 (12.4) | |
| 50 000-100 000 | 8044 (9.6) | 6873 (9.9) | 810 (7.9) | 284 (9.0) | 77 (8.2) | |
| ≥ 100 000 | 41 958 (43.9) | 35 261 (43.9) | 4879 (45.1) | 1390 (40.3) | 428 (38.6) | |
| Geographical region | <.001 | |||||
| Northwest | 12 169 (10.7) | 10 007 (10.6) | 1423 (10.4) | 540 (13.3) | 199 (15.2) | |
| Northeast | 16 328 (11.0) | 14 237 (11.3) | 1495 (9.7) | 442 (9.2) | 154 (9.8) | |
| Madrid | 5972 (13.7) | 5187 (14.2) | 625 (12.8) | 118 (7.5) | 42 (8.6) | |
| Central | 24 539 (13.2) | 20 381 (12.8) | 3119 (15.7) | 785 (14.3) | 254 (13.5) | |
| East | 18 621 (28.6) | 15 694 (28.8) | 2044 (27.0) | 677 (28.8) | 206 (26.9) | |
| South | 24 772 (19.1) | 20 312 (18.5) | 3092 (21.1) | 1056 (24.1) | 312 (23.6) | |
| Canary Islands | 3342 (3.6) | 2873 (3.7) | 350 (3.2) | 93 (2.8) | 26 (2.6) | |
| Cardiovascular diseasec | <.001 | |||||
| No | —d | —d | 9920 (81.5) | 2513 (67.5) | 711 (60.1) | |
| Yes | 2228 (18.5) | 1198 (32.5) | 482 (39.9) | |||
| Heart disease | <.001 | |||||
| No | —d | —d | 10 332 (85.1) | 2844 (76.5) | 957 (80.3) | |
| Yes | 1816 (14.9) | 867 (23.5) | 236 (19.7) | |||
| Cerebrovascular disease | <.001 | |||||
| No | —d | —d | 11 533 (94.7) | 3152 (84.7) | 831 (69.7) | |
| Yes | 615 (5.3) | 559 (15.3) | 362 (30.3) | |||
Nonparametric and smooth estimates of the standardized cumulative cardiovascular disease mortality curves in each disability category were obtained by using Kaplan-Meier methods18 and spline-based survival models19 with the above combined weights while accounting for competing deaths from other causes. For models based on splines, disability-specific log cumulative hazards were modeled as different natural cubic splines of log time with 2 internal knots at the 33rd and 67th percentiles.19,20 Standardized ratios and differences in cardiovascular disease mortality risks at 5 and 10 years of follow-up among disability categories were estimated from spline-based survival models with combined weights and competing other-cause deaths, and 95% confidence intervals (95%CI) were obtained using delta methods on robust variance estimates of spline coefficients.19
Since baseline cardiovascular disease was not measured in participants without disability, we performed a bias analysis to quantify the expected residual confounding by baseline cardiovascular disease in the 10-year mortality risk ratio comparing people with and without disability after sex and age adjustment (the 2 major sociodemographic confounders controlled in the present study).21 This bias analysis combined the study data with external clinical information on the overall prevalence of cardiovascular disease among primary health care users in Spain.22 A detailed description of the bias analysis is provided in the methods of the supplementary data.
Heterogeneity in risk ratios among disability categories by subgroups of sex, age, living with a partner, educational level, household income, municipality size, and geographical region was evaluated by fitting spline-based survival models stratified by disability category and sociodemographic subgroup, weighted by combined weights, and accounting for competing deaths from other causes. For subgroup analyses, we modeled stratum-specific log cumulative hazards as natural cubic splines of log time with a single internal knot at the 50th percentile. Standardized 5-year risk ratios for cardiovascular disease mortality among disability categories and 95%CI were estimated within each sociodemographic subgroup and tested for homogeneity among subgroups by using joint Wald tests.
The same methods were used to compare mortality from ischemic heart disease and cerebrovascular disease among disability categories. Statistical analyses were performed using stcompet, stpm2, and stpm2cif commands in Stata, version 17 (Stata Corp), and graphics were produced in R, version 4 (R Foundation for Statistical Computing).
RESULTSIn the community-dwelling Spanish population aged 40 years or older, the prevalence of disability (95%CI) was 16.2% (15.9-16.4), including 11.5% (11.3-11.8) with mild, 3.5% (3.4-3.7) with moderate, and 1.1% (1.0-1.2) with severe/complete disability. People with a higher degree of disability were more likely to be female, older, less educated, and to live alone in small municipalities, while people with any degree of disability were more likely to have lower household incomes. Among people with disability, the baseline prevalence of cardiovascular disease (particularly cerebrovascular disease) increased with the degree of disability (table 1).
During 977 082 person-years of follow-up, 5070 participants died from cardiovascular disease, 1467 from ischemic heart disease, and 1211 from cerebrovascular disease, corresponding to mortality rates of 5.1, 1.5, and 1.2 deaths per 1000 person-years. There were also 11 706 deaths from other causes, with a mortality rate of 12.0 deaths per 1000 person-years. After standardizing to the distribution of baseline sociodemographic characteristics in the overall community-dwelling Spanish population and accounting for competing deaths from other causes, cardiovascular disease mortality was consistently higher in people with higher degrees of disability over the entire follow-up (figure 2A). Compared with people without disability, the standardized 5-year risk ratios for cardiovascular disease mortality (95%CI) were 1.70 (1.49-1.93) for mild, 3.92 (3.23-4.76) for moderate, and 4.77 (3.42-6.66) for severe/complete disability, corresponding to 11.7, 49.0, and 63.1 excess deaths per 1000 persons, respectively. The increased risk of death from cardiovascular disease was maintained after 10 years of follow-up, with standardized 10-year risk ratios (95%CI) of 1.57 (1.41-1.74) for mild, 2.70 (2.27-3.22) for moderate, and 2.67 (1.92-3.72) for severe/complete disability compared with no disability (table 2). Regarding the potential residual confounding by unmeasured cardiovascular disease at baseline, bias analysis indicated that, once standardized for sociodemographic characteristics (mainly age and sex), the 10-year mortality risk ratio for cardiovascular disease mortality comparing people with and without disability would be biased away from the null (positive confounding) by 5.9% (results of the supplementary data and table 2 of the supplementary data).
Central illustration. Standardized cumulative mortality (per 1000) from cardiovascular disease (A), ischemic heart disease (B), and cerebrovascular disease (C) by disability category in the community-dwelling Spanish population aged 40 years or older, 2007-2008 to 2017. Parametric cumulative mortality curves (smooth lines) were estimated from spline-based survival models, and nonparametric curves (step functions) were derived from Kaplan-Meier methods, both stratified by disability category, weighted by combined weights, and accounting for competing deaths from other causes. Combined weights were used to standardize cumulative mortality in each disability category to the distribution of baseline sociodemographic characteristics in the entire community-dwelling Spanish population aged 40 years or older, including sex, age, living with a partner, educational level, household income, municipality size, and geographical region.
Standardized ratios and differences in 5- and 10-year mortality risks from cardiovascular disease, ischemic heart disease, and cerebrovascular disease by disability category in the community-dwelling Spanish population aged 40 years or older, 2007-2008 to 2017
| Disability | ||||
|---|---|---|---|---|
| Outcome | No | Mild | Moderate | Severe/complete |
| No. of person-years | 846 351 | 102 576 | 22 996 | 5160 |
| No. of deaths | ||||
| Cardiovascular disease | 2628 | 1299 | 865 | 278 |
| Ischemic heart disease | 827 | 364 | 217 | 59 |
| Cerebrovascular disease | 618 | 298 | 188 | 107 |
| All other causes | 6804 | 2670 | 1535 | 697 |
| Mortality ratea | ||||
| Cardiovascular disease | 3.0 | 12.7 | 38.7 | 54.5 |
| Ischemic heart disease | 0.9 | 3.5 | 10.1 | 11.2 |
| Cerebrovascular disease | 0.7 | 2.9 | 8.2 | 21.7 |
| All other causes | 7.9 | 26.5 | 68.2 | 135.6 |
| Cardiovascular disease | ||||
| 5-year cumulative mortalityb | 11.4 | 49.2 | 156.4 | 194.6 |
| Standardized ratioc (95%CI) | 1.00 (reference) | 1.70 (1.49-1.93) | 3.92 (3.23-4.76) | 4.77 (3.42-6.66) |
| Standardized differencec (95%CI) | 0.0 (reference) | 11.7 (8.4-15.0) | 49.0 (37.0-60.9) | 63.1 (37.0-89.3) |
| 10-year cumulative mortalityb | 28.7 | 106.7 | 236.6 | 234.5 |
| Standardized ratioc (95%CI) | 1.00 (reference) | 1.57 (1.41-1.74) | 2.70 (2.27-3.22) | 2.67 (1.92-3.72) |
| Standardized differencec (95%CI) | 0.0 (reference) | 22.9 (16.8-29.1) | 68.9 (50.5-87.3) | 67.5 (32.0-102.9) |
| Ischemic heart disease | ||||
| 5-year cumulative mortalityb | 3.8 | 13.0 | 42.2 | 40.7 |
| Standardized ratioc (95%CI) | 1.00 (reference) | 1.61 (1.27-2.04) | 3.68 (2.70-5.01) | 4.52 (2.45-8.35) |
| Standardized differencec (95%CI) | 0.0 (reference) | 3.2 (1.4-5.1) | 14.2 (8.6-19.8) | 18.6 (4.2-33.1) |
| 10-year cumulative mortalityb | 9.0 | 29.7 | 61.7 | 48.4 |
| Standardized ratioc (95%CI) | 1.00 (reference) | 1.56 (1.31-1.86) | 2.71 (2.05-3.57) | 2.73 (1.39-5.39) |
| Standardized differencec (95%CI) | 0.0 (reference) | 6.6 (3.6-9.5) | 20.1 (11.7-28.5) | 20.4 (–1.3-42.1) |
| Cerebrovascular disease | ||||
| 5-year cumulative mortalityb | 2.7 | 11.7 | 35.8 | 75.8 |
| Standardized ratioc (95%CI) | 1.00 (reference) | 1.52 (1.20-1.92) | 4.05 (2.66-6.15) | 7.55 (4.70-12.1) |
| Standardized differencec (95%CI) | 0.0 (reference) | 2.1 (0.8-3.4) | 12.5 (5.9-19.0) | 26.8 (12.8-40.7) |
| 10-year cumulative mortalityb | 6.4 | 24.4 | 50.0 | 93.2 |
| Standardized ratioc (95%CI) | 1.00 (reference) | 1.59 (1.29-1.96) | 3.16 (1.99-5.00) | 4.69 (3.06-7.18) |
| Standardized differencec (95%CI) | 0.0 (reference) | 5.4 (2.6-8.2) | 19.7 (6.7-32.6) | 33.6 (15.9-51.3) |
95%CI, 95% confidence interval.
Unstandardized cumulative mortality risks per 1000 persons at the specified follow-up times were obtained using sampling-weighted Kaplan-Meier methods stratified by disability category and accounting for competing deaths from other causes.
Standardized ratios and differences in cumulative mortality risks at the specified follow-up times among disability categories were obtained from spline-based survival models stratified by disability category, weighted by combined weights, and accounting for competing deaths from other causes, with 95%CI derived by applying delta methods to robust variance estimates of spline coefficients. Combined weights were used to standardize cumulative mortality in each disability category to the distribution of baseline sociodemographic characteristics in the entire community-dwelling Spanish population aged 40 years or older, including sex, age, living with a partner, educational level, household income, municipality size, and geographical region.
The risk of death from ischemic heart disease increased similarly among people with moderate and severe/complete disability (figure 2B), with standardized risk ratios (95%CI) at 5 and 10 years of follow-up of 3.68 (2.70-5.01) and 2.71 (2.05-3.57) for moderate disability and 4.52 (2.45-8.35) and 2.73 (1.39-5.39) for severe/complete disability compared with no disability (table 2). However, mortality risk from cerebrovascular disease increased progressively with the degree of disability severity (figure 2C). Compared with people without disability, the standardized 5-year risk ratio for cerebrovascular disease mortality (95%CI) rose from 4.05 (2.66-6.15) for moderate to 7.55 (4.70-12.1) for severe/complete disability, and the 10-year risk ratio rose from 3.16 (1.99-5.00) to 4.69 (3.06-7.18), respectively (table 2). Bias analysis showed that, after controlling for sex and age, failure to adjust for unmeasured heart disease at baseline would result in a minor upward bias of 3.6% in the 10-year risk ratio for ischemic heart disease mortality associated with disability, whereas failing to adjust for baseline cerebrovascular disease would introduce a moderate upward bias of 12.5% in the association between disability and cerebrovascular mortality (results of the supplementary data and table 2 of the supplementary data).
In subgroup analyses, the risk of death from cardiovascular disease increased progressively with the degree of disability in all sociodemographic subgroups, albeit risk ratios associated with disability were larger among younger individuals (P for homogeneity <.001), those living with a partner (P <.001), and more educated individuals (P=.004), corresponding to population subgroups with lower baseline risks. The standardized 5-year risk ratios for cardiovascular disease mortality comparing mild, moderate, and severe/complete disability with no disability reached 3.02, 7.16, and 13.10 among individuals younger than 65 years, 2.24, 5.06, and 6.17 among individuals living with a partner, and 2.66, 6.18, and 6.11 among individuals with at least secondary education, respectively (figure 3). The standardized 5-year risk ratios for cardiovascular disease mortality among disability categories were roughly similar for women and men (P for homogeneity=.18).
Standardized 5-year risk ratios for cardiovascular disease mortality among disability categories by subgroup in the community-dwelling Spanish population aged 40 years or older, 2007-2008 to 2017. Subgroup-specific risk ratios (squares with area inversely proportional to the variance) and 95% confidence intervals (95%CI, horizontal lines) were obtained from spline-based survival models stratified by disability category and sociodemographic subgroup, weighted by combined weights, and accounting for competing deaths from other causes. Combined weights were used to standardize cardiovascular disease mortality in each disability category to the distribution of baseline sociodemographic characteristics in the entire community-dwelling Spanish population aged 40 years or older, including sex, age, living with a partner, educational level, household income, municipality size, and geographical region.
Subgroup analyses for ischemic heart disease mortality closely resembled those for cardiovascular disease, with higher risk ratios comparing disability categories among younger individuals (P for homogeneity=.03) and those living with a partner (P=.02) (figure 2 of the supplementary data). Mortality risk from cerebrovascular disease rose progressively among disability categories in all subgroups except for individuals with secondary or higher education (P for homogeneity=.02), whose standardized 5-year risk ratio for cerebrovascular disease mortality comparing severe/complete with no disability dropped to 1.33 (95%CI, 0.33-5.27) (figure 3 of the supplementary data).
DISCUSSIONIn this large adult population-based cohort study, the cumulative cardiovascular mortality (overall and for each specific diagnosis) was higher among individuals with any level of disability compared with individuals without a disability at any follow-up time. Additionally, the risk of death from cardiovascular disease increased progressively with the degree of disability in all the sociodemographic subgroups studied.
Our results are consistent with the findings of 2 representative studies of the general population8,9 and additional cohort studies4,5,7,10 that have assessed this association in older populations. However, it is important to highlight that the measurement of disability is not homogeneous among the studies, hampering comparison of disability research.3 This is coherent with the statement that a common definition of disability would strengthen research on this subject.3,23 For example, there is a marked difference in cardiovascular mortality rates among people with disability between our study (5.1 per 1000 person-years) and that of Son et al.9 (1.3 per 1000 person-years). While both cohorts were fairly similar in age and sex distribution and length of follow-up, their corresponding baseline prevalence of people with disability differed notably: 16.2% vs 0.39%.9 It seems that Son et al.9 used a stricter definition of disability than our own. Forman-Hoffman et al.8 reported a prevalence similar to that found in the present study, above 16% for a younger population, as they also included individuals aged 18 to 40 years. Other studies reported higher prevalences but studied older populations,4,10 and it is known that older individuals have a higher prevalence of disability.1
According to our results, the risk of death from cardiovascular disease increased progressively with the degree of disability in all sociodemographic subgroups studied. This finding was previously reported by Plichart et al.10 and Forman-Hoffman et al.,8 but not by Son et al.9
In line with our study, Plichart et al.10 used a global variable for disability (dichotomous or categorized by severity gradient). However, Son et al.9 and Forman-Hoffman et al.8, in addition to a global measure of disability, further analyzed the association by type of disability, although they made aggregations for different types of disability to increase sample sizes. Moreover, they reached different conclusions. According to Son et al. people with disability had higher cardiovascular mortality than people without disability, irrespective of the type of disability.9 In contrast, Forman-Hoffman et al.8 only found this association for those with mental/substance use impairment or movement disability.
Our estimates for the risk of death were also higher for specific causes of cardiovascular mortality in people with disability. This finding is consistent with the results of Forman-Hoffman et al.8 According to our results, the risk for ischemic heart disease mortality was remarkably higher for individuals with moderate and/or severe/complete disability; while the risk for cerebrovascular mortality also increased markedly but followed a clear gradient with disability severity levels. To our knowledge, no other study has addressed the association between the severity of disability and the risk of death by specific causes of cardiovascular mortality.
Our findings could be supported by several biological and psychosocial mechanisms. Persons with disability have a higher prevalence of some unhealthy behavioral risk factors (substance use/abuse, smoking,24 obesity,25,26 reduced physical activity4,7,27,28)1; they are more likely to have depression,1,29 anxiety,2 sleep disturbances,2 mental distress,30 and type 2 diabetes31 and they also have a higher burden of health care disparities (including preventive screening disparities),27,32 isolation and loneliness,2,33 discrimination,1 and worse socioeconomic status.1 These factors may be related to a higher risk of cardiovascular diseases34–36 and mortality.37–40 Of note, people with disability who meet physical activity recommendations had lower cardiovascular mortality than those without disability who do not adhere to physical activity recommendations.4,7 Thus, the implementation of physical activity recommendations, among other measures, could reduce the mortality risk among people with disability. Finally, people with disability may have less access to health care or preventive services.41
We have also provided interesting subgroup analyses. The subpopulations with higher cardiovascular mortality risk ratios were the younger population, those living with a partner, and individuals with secondary or higher education. However, these results can be partly explained by the fact that those population subgroups had a lower baseline risk. Finally, we found roughly similar risks for both sexes, as opposed to Son et al.,9 who found that cardiovascular mortality increased only in men, which could be partially explained by the wide 95%CI in women.
Strengths and limitationsOur study used a large representative sample of the noninstitutionalized Spanish population aged 40 years or older, with long-term mortality follow-up data obtained from official population registries. Consequently, our results can be applied to the entire community-dwelling adult population of Spain, as well as to other countries with similar patterns of disability and their associated risk factors for cardiovascular disease.
This study, however, has several limitations. First, 20% of the survey participants lacked mortality follow-up data, which reduced the effective cohort size and resulted in a loss of precision. However, since follow-up information was missing due to administrative deficiencies in participant identification, it can be expected that, given baseline disability status and sociodemographic factors, these administrative losses to follow-up were unrelated to subsequent mortality outcomes (ie, random losses in missing data taxonomy), thus introducing little or no bias in the estimated disability-mortality associations.
Second, disability status was self- or proxy-reported, and we cannot rule out some degree of nondifferential exposure misclassification, which could have diluted existing associations if disability was overreported. In addition, our global assessment of disability severity was based on an incomplete ICF checklist of all activity and participation domains, as the EDAD-08 questionnaire lacked appropriate items for ICF domains d1, d8, and d9 and included only a subset of all items for the remaining d2–d7 domains, some of which had a substantial proportion of missing data.14 Therefore, we were unable to perform domain-specific disability analyses, which may show distinct associations with long-term cardiovascular mortality.
Third, although we controlled for differences in sociodemographic characteristics among disability categories through inverse probability of exposure weighting, our estimates may reflect some degree of residual confounding by prevalent cardiovascular diseases (heart and cerebrovascular diseases) and other relevant risk factors (physical activity, body mass index, hypertension), which were only measured in participants with disability. Nevertheless, bias analyses indicated that after controlling for sociodemographic factors, failure to adjust for baseline cardiovascular diseases would result in small positive biases of 4% to 6% in the 10-year mortality risk ratios for cardiovascular and ischemic heart disease mortality associated with disability and a moderate upward bias of 12% for cerebrovascular disease mortality.
Fourth, we lacked longitudinal data on disability and confounders, and we cannot rule out some bias in the estimated associations for baseline disability if a substantial proportion of participants had developed new disabilities or increased their severity over follow-up. Residual confounding was also possible due to unmeasured time-varying factors affecting both subsequent disability and cardiovascular mortality.
Finally, this study only included community-dwelling adults and the association of disability with cardiovascular mortality may differ in the institutional setting.
Future studies should address the establishment of an operational definition of disability, the examination of cardiovascular mortality risks depending on the type and cause of disability, the assessment of further interventions aimed at preventing disability among people without disability and reducing the risk of cardiovascular disease among people with disability, and changes over time in the association between disability and cardiovascular mortality.
CONCLUSIONSThe risk of cardiovascular mortality (overall and for every specific diagnosis) is higher among adults with any level of disability compared to adults without a disability at any follow-up time. Moreover, the risk of death from cardiovascular disease increased progressively with the degree of disability for all sociodemographic subgroups. Conditions that increase cardiovascular risk in people with a disability should be investigated. Preventive measures and health promotion initiatives are needed to reduce the risk of mortality in this population.
FUNDINGThis work was supported by the Institute of Health Carlos III (grant number PI20CIII00045). The views expressed are those of the authors and not necessarily those of the Institute of Health Carlos III. The degree of accuracy or reliability of the quantitative information derived from this work is the sole responsibility of the authors and not of the institution that provides the data, the Spanish National Institute of Statistics (Instituto Nacional de Estadística).
ETHICAL CONSIDERATIONSAll procedures performed in studies involving human participants were in accordance with the ethical standards of the institutional and/or national research committee Institute of Health Carlos III Research Ethics Committee (number CEI PI 17_2020) and with the 1964 Helsinki declaration and its later amendments or comparable ethical standards. Written informed consent from the participants or their legal guardians/next of kin was not required for this study since it included participants in the Spanish Survey on Disability, Personal Autonomy, and Dependency 2008 (Encuesta de Discapacidad, Autonomía Personal y Situaciones de Dependencia 2008, EDAD-08) of the Spanish National Institute of Statistics (Instituto Nacional de Estadística) after asking for their collaboration (Instituto Nacional de Estadística. Survey on Disability, Personal Autonomy and Dependency Situations 200811). The authors had no role in the acquisition of information for the disability survey. The SAGER guidelines have been followed with respect to possible sex/gender bias.
Data are unavailable due to legal restrictions.
STATEMENT ON THE USE OF ARTIFICIAL INTELLIGENCENo artificial intelligence tools were used in the preparation of this manuscript.
AUTHORS’ CONTRIBUTIONSJ. Damián, R. Pastor-Barriuso, and F.J. García López designed the study and directed its implementation. R. Pastor-Barriuso, A. Padrón-Monedero, and F.J. García López wrote the manuscript. R. Pastor-Barriuso developed and wrote the methods. J. Damián, J. Almazán-Isla, and J. de Pedro-Cuesta provided relevant ideas during the implementation of the article and collaborated in the development of the manuscript. All authors have given final approval to the manuscript.
CONFLICTS OF INTERESTNone declared.
- –
Adults with disability have a higher risk of all-cause mortality.
- –
There is limited evidence on cardiovascular mortality risk in adults with disability.
- –
To our knowledge, no other study has addressed the association between the severity of disability and the risk of death due to specific cardiovascular mortality disorders.
- –
The risk of cardiovascular mortality globally and for specific disorders is higher among adults with disability.
- –
The risk of death from cardiovascular disease progressively increases with the degree of disability.
- –
Preventive measures are needed to reduce the cardiovascular mortality risk in this population.
Supplementary data associated with this article can be found in the online version, at https://doi.org/10.1016/j.rec.2025.03.008
