Ambulatory blood pressure (BP) better predicts cardiovascular disease (CVD) outcomes than office BP measurements (OBPM). Nonetheless, current CVD risk stratification models continue to rely on exclusively daytime OBPM along with traditional factors, eg, age, sex, smoking, dyslipidemia, and/or diabetes.
MethodsData from 19 949 participants of the primary care-based Hygia Project assessed by 48-hour ambulatory BP monitoring (ABPM) and without prior CVD events were used to compare the diagnostic accuracy, discrimination, and performance of the original Framingham risk score (RSOFG) and its adjusted version to the Hygia Project study population (RSAFG) with that of a novel CVD risk stratification model constructed by replacing OBPM with ABPM-derived prognostic parameters (RSABPM).
ResultsDuring the follow−up, lasting up to 12.7 years, 1854 participants experienced a primary CVD outcome of CVD death, myocardial infarction, coronary revascularization, heart failure, stroke, transient ischemic attack, angina pectoris, or peripheral artery disease. Asleep systolic BP (SBP) mean and sleep−time relative SBP decline were the only joint significant ABPM−derived predictive factors of CVD risk and were therefore used to substitute for in−clinic SBP in the RSABPM model. The RSABPM model, in comparison with the RSOFG and RSAFG models, showed significantly improved calibration, diagnostic accuracy, discrimination, and performance (always P<.001). The RSAFG−derived event−probabilities of 57.3% of the participants were outside the 95% confidence limits of the event probability determined by the RSABPM model.
ConclusionsThese collective findings reveal important limitations of CVD risk stratification when based upon OBPM, as in the Framingham score, and corroborate the clinical value of around−the−clock ABPM to properly diagnose true hypertension and reliably stratify CVD vulnerability.
Keywords
Numerous outcome trials have demonstrated that the association between blood pressure (BP) level and risk for target organ injury and cardiovascular disease (CVD) incidents is much more robust for parameters obtained from ambulatory BP (ABP) monitoring (ABPM) than from office BP measurements (OBPM).1–6 Additionally, independent prospective investigations have demonstrated that CVD events are much better predicted by ABPM−derived asleep than awake or 24−hour BP means.2–7 Multiple studies have also consistently corroborated a strong association between blunted sleep−time relative BP decline (nondipper/riser BP pattern) and risk of fatal and nonfatal CVD events.2,3,6,8,9 On the basis of the substantial evidence verifying that ABP predicts long−term CVD outcomes independently of daytime OBPM, several international guidelines and recommendations now propose that ABPM be required to confirm the diagnosis of adult hypertension.10–13 Algorithms of CVD risk stratification models, including the 10−year CVD Framingham risk score, incorporate traditional influential factors, eg, age, sex, smoking, dyslipidemia, and/or diabetes, plus exclusively daytime OBPM,14–17 despite convincing collective evidence from several prospective trials of the highly significant better prognostic value of ABP parameters, most notably the sleep−time BP mean and sleep−time relative BP decline.2–9 The Hygia Project is a research network established to extend the routine use of ABPM in primary care to diagnose and manage hypertension, evaluate treatment response, and estimate patient CVD and other risks.18 In this study, we used the current database of the Hygia Project to compare the discriminative/predictive value, discrimination, and performance of both the original Framingham risk score (RSOFG)17 and its specific adaptation to the study population (adjusted CVD Framingham risk score, RSAFG) with the CVD risk stratification model that incorporates the same variables as the RSOFG and RSAFG, but which replaces OBPM with stronger ABPM−derived prognostic parameters (RSABPM).
METHODSParticipant inclusion and exclusion criteriaThe study was approved by the Galician Clinical Research Ethics Committee. Details of its design, management, investigators’ training, quality control, safety and compliance assessment, clinical and ABPM procedures, criteria to request ABPM, sample size calculations, follow−up, and other relevant methodological aspects are described elsewhere.18 Participants consisted of a population of Caucasian men and women aged ≥ 18 years, adhering to a routine of daytime activity and nighttime sleep, and who gave written informed consent for inclusion.
Exclusion criteria were pregnancy, a history of alcoholism or narcotic addiction, night or rotating shift−work employment, acquired immunodeficiency syndrome, known secondary hypertension, certain CVD−associated medical conditions (unstable angina pectoris, heart failure, life−threatening arrhythmia, atrial fibrillation, and grade III−IV retinopathy), intolerance to ABPM, and inability to communicate and comply with all study requirements.18 In keeping with the inclusion/exclusion criteria used in the Framingham study,17 we excluded from analysis participants with a history of a previous CVD event. Participating primary care investigators referred 19 949 persons, 10 478 men/9471 women, aged 58.5±14.2 (mean±SD) years, who fulfilled these inclusion/exclusion criteria, and provided all the required information for the study.
ABP and other assessmentsUpon recruitment, at least 3 consecutive OBPM were made in each participant after resting in a seated position for ≥ 10minutes using a validated automatic oscillometric device (HEM−705IT, Omron Health Care Inc, United States). Immediately thereafter, ABPM was initiated using a calibrated and validated SpaceLabs 90207 device (SpaceLabs Inc, United States) to measure systolic blood pressure (SBP), diastolic blood pressure (DBP), and heart rate every 20minutes between 07:00 and 23:00hours and every 30minutes during the night for 48 consecutive hours to optimize reproducibility of results.19 Participants kept a diary to record, among other information, time of retiring to bed at night and awakening in the morning to enable accurate calculation of the awake and asleep BP means of each participant. ABP series were considered invalid for analysis and thus necessitated repeat ABPM (4.1% 95% confidence interval (CI) [3.9−4.4]) if ≥ 30% of scheduled measurements were missing, data were lacking for an interval of> 2hours or were obtained when the rest−activity schedule was inconsistent during the 2 days of monitoring, or the sleep span was <6hours or> 12hours. At each clinic visit when ABPM was conducted, morning (between 08:00 and 09:00 hours) urine and blood samples were collected after overnight fasting and were immediately analyzed by routine automatic techniques at laboratory facilities of the Galician Social Security Health Service (Servicio Galego de Saúde [SERGAS]) compliant with quality standards.
Follow−upInvestigators reviewed the complete electronic medical records of all participants at least annually and at least 1 year after their last ABPM evaluation. External noninvestigator medical specialists of the corresponding referring tertiary hospital services categorized CVD events upon hospitalization in accordance with defined current diagnostic criteria18 and recorded the entire report in the patient's electronic medical history. The Hygia Project Events Committee, composed of independent clinicians blinded to medical records and ABPM findings, periodically and collegiately evaluated these clinical reports devoid of personal identifiers to ascertain and certify each documented event. For the outlined RSOFG, RSAFG, and RSABPM comparisons, the primary CVD endpoint, as per the Framingham study,17 was: CVD death, myocardial infarction, coronary revascularization, heart failure, hemorrhagic stroke, ischemic stroke, transient ischemic attack, angina pectoris, or peripheral artery disease.
Statistical methodsTo avoid confounding by nonequidistant BP sampling of mean values, the 48−hour, awake, and asleep spans per participant were each divided into an integer number of classes of identical time length and the respective BP means were then determined as the average of the relevant time−classes mean values. Sleep−time relative BP decline (index of BP dipping) was calculated as: [(awake ABP mean – asleep ABP mean)/awake ABP mean] x 100, using all valid data of the 48−hour ABPM. Participants were designated as dipper if the sleep−time relative SBP decline was ≥ 10%, and as nondipper otherwise.13 Demographic and clinical variables were compared among groups of participants who did and did not experience an event by the Student t test (quantitative variables) or the nonparametric chi−square test (proportions).
The OBPM−based RSOFG for the defined CVD outcome endpoint includes office SBP plus the variables of age, sex, smoking, total and HDL−cholesterol, hypertension treatment, and diabetes.17 To avoid potential bias due to differences between the original Framingham population and the Hygia Project participants in the evaluation of the influence of ABPM on the RSOFG, we adjusted the original Framingham model to the Hygia Project participants by recalculating the Cox regression coefficients for each of the listed original covariates, including office SBP. Continuous variables were logarithmically transformed to minimize the influence of extreme observations.17 The tested RSABPM included those same variables, except OBPM, plus the ABP parameters of asleep SBP mean and sleep−time SBP decline. These 2 ABP parameters had been previously shown, and also corroborated herein, to be the only ABP characteristics jointly significant in Cox regression analysis as predictors of CVD risk.6 Lack of significant collinearity between office SBP, asleep SBP mean, and sleep−time SBP decline was ascertained by calculating tolerance coefficients and corresponding variance inflation factors.
We evaluated the calibration—the measure of agreement between observed and predicted CVD events—of the RSOFG, RSAFG, and RSABPM models, using the Greenwood−Nam−D’Agostino (GND) nonparametric test, which is the most reliable test when the censoring rate is low.20,21 For this purpose, we divided the participants per each tested risk model into deciles according to their individualized estimated event−probability and used the Kaplan−Meier estimator to obtain the observed incidence of CVD events.20,21 The C−statistic was used to compare the CVD outcome discrimination value between models. We also calculated, as a measure of diagnostic accuracy,17,22 the proportion of CVD events that occurred in the top quintile of predicted risk (ie, sensitivity of the top quintile) and the proportion of individuals without events not included in the top quintile of predicted risk (ie, specificity of the top quintile) per risk prediction model.
To overcome dependence on the choices of categories required to determine the classic net reclassification improvement index (NRI) (increase in risk category for individuals who developed an event and decrease in risk category for those who did not), the performance of the RSOFG and RSAFG vs RSABPM was evaluated by continuous NRI (also termed NRI> 0), integrated discrimination improvement (IDI),22 and relative−IDI (RIDI),23 using the RSABPM as the reference model. The corresponding 95%CI for these reclassification indices was established by bootstrap resampling techniques.23 We also calculated the equivalence of estimated probabilities (EEP), defined as the percentage of participants with an estimated event−probability predicted by the RSOFG or RSAFG model, respectively, that falls within the 95%CI of the corresponding individual event−probability determined from the RSABPM model. Under the null hypothesis, the estimated CVD event−probabilities of the compared models are equivalent, this percentage should be ≥ 95%; this hypothesis can be statistically verified by the 1−sided binomial test of proportions. A major advantage of the newly proposed EEP is that, beyond the values of the estimated probabilities, it also relies on the variability of the individualized estimates given by their 95%CI. The calculated individual event−probabilities and corresponding 95%CI determined from the RSABPM model were additionally used to further evaluate performance by establishing the statistical significance of any given increase/decrease in risk, which constitutes the net reclassification significant improvement (NRSI).
Limits of agreement between individual event probabilities predicted by each tested model were calculated by the Bland−Altman method.24 Finally, the Cox proportional−hazard model was applied to estimate hazard ratios (HR) with 95%CI for documented events of the participants divided into quintiles according to respective individualized RSOFG, RSAFG, and RSABPM scores. For survival analysis, follow−up was established as the time interval from the date of ABPM assessment to either the date of the confirmed CVD incident of event participants or the last clinical evaluation of nonevent participants, respectively. Statistical analyses were performed using SPSS version 20.0 (SPSS Inc, United States) and R version 3.3.3 (R Foundation for Statistical Computing).
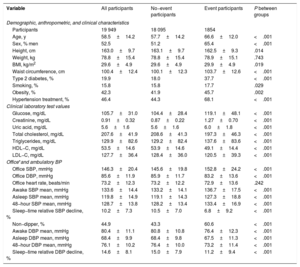
RESULTSBaseline demographic, laboratory, and BP variables as potential markers of CVD riskDuring the follow−up, which lasted up to 12.7 years, 1 854 participants experienced a primary CVD event (CVD death, n=203; myocardial infarction, n=208; coronary revascularization, n=216; heart failure, n=378; stroke, n=271; other minor events, n=578). Cox survival analyses indicated that, beyond BP, an increased risk of a CVD event was jointly and significantly associated with the RSOFG variables of male sex, older age, smoking, reduced HDL−cholesterol, hypertension treatment, and the presence of diabetes (table 1). Simultaneous examination of the potential joint combined contribution to CVD risk among multiple BP parameters revealed asleep SBP mean (HR, 1.32 [1.23−1.41] per SD elevation; P <.001), but not office SBP (1.04 [0.98−1.10]; P=.180) or awake BP mean (0.97 [0.90−1.05]; P=.418), was the most significant BP−derived marker of increased CVD risk. The joint contribution with the asleep SBP mean to CVD risk was significant only for diminished sleep−time relative SBP decline (HR, 1.29 [1.23−1.35] for asleep SBP mean and 0.92 [0.88−0.97] for sleep−time relative SBP decline, respectively, both P <.001).
Baseline characteristics of investigated participants
| Variable | All participants | No−event participants | Event participants | P between groups |
|---|---|---|---|---|
| Demographic, anthropometric, and clinical characteristics | ||||
| Participants | 19 949 | 18 095 | 1854 | |
| Age, y | 58.5±14.2 | 57.7±14.2 | 66.6±12.0 | <.001 |
| Sex, % men | 52.5 | 51.2 | 65.4 | <.001 |
| Height, cm | 163.0±9.7 | 163.1±9.7 | 162.5±9.3 | .014 |
| Weight, kg | 78.8±15.4 | 78.8±15.4 | 78.9±15.1 | .743 |
| BMI, kg/m2 | 29.6±4.9 | 29.6±4.9 | 29.9±4.9 | .019 |
| Waist circumference, cm | 100.4±12.4 | 100.1±12.3 | 103.7±12.6 | <.001 |
| Type 2 diabetes, % | 19.9 | 18.0 | 37.7 | <.001 |
| Smoking, % | 15.8 | 15.8 | 17.7 | .029 |
| Obesity, % | 42.3 | 41.9 | 45.7 | .002 |
| Hypertension treatment, % | 46.4 | 44.3 | 68.1 | <.001 |
| Clinical laboratory test values | ||||
| Glucose, mg/dL | 105.7±31.0 | 104.4±28.4 | 119.1±48.1 | <.001 |
| Creatinine, mg/dL | 0.91±0.32 | 0.87±0.22 | 1.27±0.70 | <.001 |
| Uric acid, mg/dL | 5.6±1.6 | 5.6±1.6 | 6.0±1.8 | <.001 |
| Total cholesterol, mg/dL | 207.6±41.9 | 208.6±41.3 | 197.3±46.3 | <.001 |
| Triglycerides, mg/dL | 129.9±82.6 | 129.2±82.4 | 137.6±83.6 | <.001 |
| HDL−C, mg/dL | 53.5±14.6 | 53.9±14.6 | 49.1±14.4 | <.001 |
| LDL−C, mg/dL | 127.7±36.4 | 128.4±36.0 | 120.5±39.3 | <.001 |
| Office*and ambulatory BP | ||||
| Office SBP, mmHg | 146.3±20.4 | 145.6±19.8 | 152.8±24.2 | <.001 |
| Office DBP, mmHg | 85.6±11.9 | 85.9±11.7 | 83.2±13.6 | <.001 |
| Office heart rate, beats/min | 73.2±12.3 | 73.2±12.2 | 72.9±13.6 | .242 |
| Awake SBP mean, mmHg | 133.6±14.4 | 133.2±14.1 | 136.7±17.5 | <.001 |
| Asleep SBP mean, mmHg | 119.8±14.9 | 119.1±14.3 | 127.3±18.8 | <.001 |
| 48−hour SBP mean, mmHg | 128.7±13.8 | 128.2±13.4 | 133.4±16.9 | <.001 |
| Sleep−time relative SBP decline, % | 10.2±7.3 | 10.5±7.0 | 6.8±9.2 | <.001 |
| Non−dipper, % | 44.9 | 43.3 | 60.6 | <.001 |
| Awake DBP mean, mmHg | 80.4±11.1 | 80.8±10.8 | 76.4±12.3 | <.001 |
| Asleep DBP mean, mmHg | 68.4±9.9 | 68.4±9.8 | 67.5±11.3 | <.001 |
| 48−hour DBP mean, mmHg | 76.1±10.2 | 76.4±10.0 | 73.2±11.4 | <.001 |
| Sleep−time relative DBP decline, % | 14.6±8.1 | 15.0±7.9 | 11.2±9.4 | <.001 |
ABPM, ambulatory blood pressure monitoring; BMI, body mass index; BP, blood pressure; CVD, cardiovascular disease; DBP, diastolic blood pressure; HDL−C, high−density lipoprotein cholesterol; LDL−C, low−density lipoprotein cholesterol; SBP, systolic blood pressure.
Data are expressed as No. (%) or mean±standard deviation.
Obesity: BMI ≥ 30 Kg/m2. Sleep−time relative BP decline, index of BP dipping, defined as percent decrease in mean BP during nighttime sleep relative to mean BP during daytime activity, calculated as: ([awake BP mean – asleep BP mean]/awake BP mean) x 100. Non−dipper: individuals with sleep−time relative SBP decline <10%, using data sampled by ABPM for 48 consecutive hours. Events: CVD death, myocardial infarction, coronary revascularization, heart failure, hemorrhagic stroke, ischemic stroke, transient ischemic attack, angina pectoris, or peripheral artery disease.
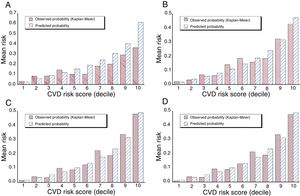
The original (unadjusted) RSOFG markedly overestimated the actual event−rate in the study population. This is evident by the comparison of the RSOFG−estimated and observed (Kaplan−Meier) incidence of CVD events for the participants divided into deciles shown in figure 1A and confirmed statistically by the poor calibration of the model shown in table 2 (GND goodness−of−fit test: 123.40, P <.001, indicating lack of fit). Diagnostic accuracy and discrimination were also poor, as indicated by the relatively small values of sensitivity/specificity of the top quintile and C−statistic, respectively (table 2, first column). Compared with the RSABPM as reference model, RSOFG performed badly, as consistently indicated by all calculated net reclassification parameters (continuous NRI, NRSI, IDI, and RIDI; table 2, first column). Only 21% of the participants had event−probabilities predicted by the RSOFG model within the respective 95%CI of each individual probability derived from the RSABPM model.
; B, Framingham adjusted for the study population (RSAFG); C, ABPM−based (RSABPM); and D, the later further corrected by OBPM models. CVD, cardiovascular disease.")
Calibration by decile of CVD −risk score comparing the observed Kaplan−Meier and model−based predicted probabilities of a CVD event by A, the original Framingham (RSOFG); B, Framingham adjusted for the study population (RSAFG); C, ABPM−based (RSABPM); and D, the later further corrected by OBPM models. CVD, cardiovascular disease.
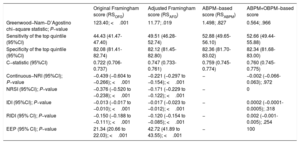
Calibration, diagnostic accuracy, discrimination value, and performance (reclassification improvement) of the original Framingham, adjusted Framingham, ABPM−based, and ABPM+OBPM−based score models for CVD risk stratification
| Original Framingham score (RSOFG) | Adjusted Framingham score (RSAFG) | ABPM−based score (RSABPM) | ABPM+OBPM−based score | |
|---|---|---|---|---|
| Greenwood−Nam−D’Agostino chi−square statistic; P−value | 123.40; <.001 | 11.77; .019 | 1.498; .827 | 0.564; .966 |
| Sensitivity of the top quintile (95%CI) | 44.43 (41.47-47.40) | 49.51 (46.28-52.74) | 52.88 (49.65-56.10) | 52.66 (49.44-55.88) |
| Specificity of the top quintile (95%CI) | 82.08 (81.41-82.74) | 82.12 (81.45-82.80) | 82.36 (81.70-83.02) | 82.34 (81.68-83.00) |
| C−statistic (95%CI) | 0.722 (0.706-0.737) | 0.747 (0.733-0.761) | 0.759 (0.745-0.774) | 0.760 (0.745-0.775) |
| Continuous−NRI (95%CI); P−value | −0.439 (−0.604 to −0.266); <.001 | −0.221 (−0.297 to −0.154); <.001 | − | −0.002 (−0.066-0.063); .972 |
| NRSI (95%CI); P−value | −0.376 (−0.520 to −0.238); <.001 | −0.171 (−0.229 to −0.122); <.001 | − | 0 |
| IDI (95%CI); P−value | −0.013 (−0.017 to −0.010); <.001 | −0.017 (−0.023 to −0.012); <.001 | − | 0.0002 (−0.0001-0.0005); .318 |
| RIDI (95% CI); P−value | −0.150 (−0.188 to −0.111); <.001 | −0.120 (−0.154 to −0.085); <.001 | − | 0.002 (−0.001-0.005); .254 |
| EEP (95% CI); P−value | 21.34 (20.66 to 22.03); <.001 | 42.72 (41.89 to 43.55); <.001 | − | 100 |
95%CI, 95% confidence interval; ABPM, ambulatory blood pressure monitoring; EEP, equivalence of estimated probabilities; IDI, integrated discrimination improvement; NRI, net reclassification improvement; NRSI, net reclassification significant improvement; OBPM, office blood pressure measurements; RIDI, relative integrated discrimination improvement.
Sensitivity of the top quintile: proportion of event−participants included within the top quintile of predicted risk. Specificity of the top quintile: proportion of nonevent participants not included in the top quintile of predicted risk. EEP, equivalence of estimated probabilities, ie, percentage of individuals with estimated event−probability determined from the compared model that falls within the 95%CI of their corresponding event−probability determined from the reference ABPM−based model. The EEP P−value was determined by 1−sided binomial test of proportions.
The RSAFG, calculated for the same variables included in the RSOFG but based on prediction coefficients adjusted to the study population, compared with the RSOFG model, provided the expected improved, but still poor, calibration (GND=11.77; P=.019 for goodness−of−fit; figure 1B), diagnostic accuracy (sensitivity/specificity of the top quintile 49.5/82.1), discrimination (C−statistic 0.747 vs 0.722, P <.001), and performance (P <.001 for all net reclassification parameters; table 2, second column).
The ABPM−based RSABPM model, compared with the RSAFG, showed improved calibration (GND, 1.498; P=.827 for goodness−of−fit; figure 1C), increased sensitivity of the top quintile (52.9 vs 49.5; P=.034), and greater discrimination (C−statistic 0.759 vs 0.747; P <.001) of participants who indeed had a CVD event during follow−up. All net reclassification parameters further substantiated significantly worse performance of the OBPM−based RSAFG than RSABPM (significant negative values of continuous NRI, NRSI, IDI, and RIDI; table 2, second column), ie, improved reclassification by the ABPM−based model of the participants to a more precise estimated event−probability. Finally, the EEP for the RSAFG vs RSABPM was 42.7 (P <.001), which means 57.3% of the participants had a RSAFG model−derived event−probability that fell beyond the 95%CI of the individualized event−probability determined by the more accurate RSABPM model.
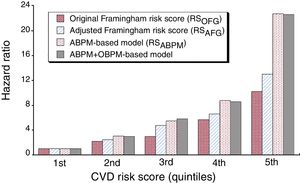
Figure 2 presents the comparative predictive value of the RSOFG, RSAFG, and RSABPM models for the study population divided into quintiles. Unadjusted Cox regression analyses performed with reference to the respective first quintile of each of the compared event−probability risk scores revealed markedly better predictive value of the RSABPM vs RSAFG and RSOFG, illustrated by the progressively greater HRs for the former throughout all quintiles.
 according to the original Framingham (RSOFG), adjusted Framingham (RSAFG), ABPM−based (RSABPM), and RSABPM corrected by OBPM risk models. ABPM, ambulatory blood pressure monitoring; CVD, cardiovascular disease; OBPM, office blood pressure measurements.")
HR of CVD event for the population divided into 5 classes of equal size (quintiles) according to the original Framingham (RSOFG), adjusted Framingham (RSAFG), ABPM−based (RSABPM), and RSABPM corrected by OBPM risk models. ABPM, ambulatory blood pressure monitoring; CVD, cardiovascular disease; OBPM, office blood pressure measurements.
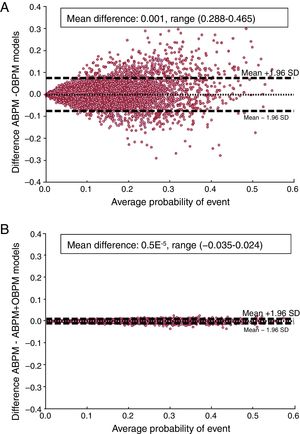
Figure 3A depicts the limits of agreement for the event–probabilities of each participant evaluated by the RSAFG and RSABPM models. The figure shows that the individual differences in event−probability between the OBPM and ABPM–based models were equally distributed around the average difference (shown by the central dotted horizontal line) across the range of event−probability (0.08 to 59.24%). Accordingly, the extent of disagreement in the calculated event−probability was independent of the actual probability level. The 95% upper and lower limits of agreement with their respective 95%CI were 7.44% [7.12–7.78] and −7.30% [(−6.98)−(−7.64)]; the total observed range of disagreement of –28.8% to 46.5% indicated the extremely poor reproducibility of the individual estimated event–probability scores when relying on daytime OBPM instead of more meaningful ABPM–derived asleep SBP mean and sleep−time relative SBP decline.
 and by the RSABPM model with and without correction by OBPM (B). The dotted horizontal line of each graph represents the average of the differences across the entire study population. Dashed lines represent the limits of agreement. ABPM, ambulatory blood pressure monitoring; OBPM, office blood pressure measurements.")
Bland−Altman plots assessing agreement in estimation of event−probability of each participant evaluated by the RSAFG and RSABPM models (A) and by the RSABPM model with and without correction by OBPM (B). The dotted horizontal line of each graph represents the average of the differences across the entire study population. Dashed lines represent the limits of agreement. ABPM, ambulatory blood pressure monitoring; OBPM, office blood pressure measurements.
We further evaluated the potential impact and complementary predictive value, if any, of including OBPM in the RSABPM model. Cox regression analysis indicated office SBP was not a significant predictor of CVD risk when asleep SBP mean and sleep−time relative SBP decline were already included in the model (HR, 1.00; 95%CI [0.94−1.07]; P=.395). There was no improvement when the RSABPM was further adjusted by OBPM in calibration (GND, 0.564; P=.966; figure 1D), diagnostic accuracy (sensitivity/specificity of the top quintile 52.7/82.3 vs 52.9/82.4 for the RSABPM model), discrimination (C−statistic 0.760 vs 0.759; P=.647), and performance (table 2, last column). Finally, the EEP for the OBPM−adjusted vs RSABPM model was 100%, ie, no single participant had an OBPM−adjusted derived event−probability that fell beyond the 95%CI of the corresponding event−probability determined by the RSABPM model, indicating again the lack of added predictive value afforded by OBPM.
Figure 3B depicts the Bland−Altman plot for the individual event−probabilities of the participants evaluated by the RSABPM model, both with and without further adjustment by OBPM. The 95% upper and lower limits of agreement, with their respective 95%CI, were extremely low (0.58% [0.56−0.61] and −0.58% [(−0.61)−(−0.56)], respectively) with the total range of disagreement of ([−3.5]-2.4)%. These findings indicate the very high reproducibility in the individual estimated event−probability of the ABPM−based prediction model and nonsignificant impact of its adjustment by inclusion of OBPM into it.
Impact of duration of ABPM on RSABPMMost past studies addressing the merit of BP biomarkers measured by ABPM vs OBPM as risk factors or even predictors for CVD events relied upon ≤ 24−hour ABPM evaluation per participant.1,2,4,5,7,8 It has been previously documented that the reproducibility/accuracy of estimating ABPM−derived parameters, and therefore their prognostic value, depends markedly on the duration of monitoring.19 In this regard, analyses of the first 24hours of the 48−hour ABPM evaluations per participant indicated: a) low reproducibility of asleep SBP mean and sleep−time relative SBP decline (Bland−Altman 95% limits of agreement [(−8.3)−8.0] mmHg and [(−7.3)−6.3]%, respectively; total range of error [(−38.5)−36.5] mmHg and [(−21.5)−36.5]%, respectively); b) high misclassification rate of true hypertension and dipping pattern (11.8% and 24.9%, respectively); and c) poorer calibration, discrimination, and performance in predicting CVD risk by the 24−hour−RSABPM than by the 48−hour−RSABPM model: GND−statistic 17.08; P=.047; C−statistic 0.753 95%CI [0.739−0.768]; P=.014; and EEP 83.0 95%CI [82.4−83.6]; P <.001. Finally, the Bland−Altman 95% upper and lower limits of agreement [with their respective 95%CI] for the event−probabilities estimated by the 24−hour−RSABPM vs 48−hour−RSABPM model were 3.15% [3.01−3.29] and −3.04% [(−2.91)−(−3.18)], with a total range of disagreement of −14.5% to 35.6%. These findings indicate poor accuracy and reproducibility of the individual estimated event−probability scores when relying on 24−hour instead of more reliable 48−hour ABPM. Nevertheless, the 24−hour−RSABPM, despite its limitations compared with the proposed more accurate 48−hour−RSABPM model, performed markedly better than the OBPM−based RSAFG model.
DISCUSSIONAccording to this prospective investigation that corroborates and extends the conclusions of previous studies,2–9 elevated asleep SBP mean, but not daytime OBPM or awake ABP mean, and diminished sleep−time relative SBP decline are the only BP–derived joint significant prognostic indicators of increased risk for CVD morbidity and mortality. In keeping with these findings, 24.5% of the participants exhibited “masked hypertension” (here defined as elevated asleep SBP mean and/or nondipper BP pattern but normal daytime OBPM) and 17.1% isolated−office hypertension (normal asleep SBP mean and dipper BP pattern but elevated daytime OBPM). These results indicated that diagnosis of hypertension (ie, elevated CVD risk) in 41.6% of the participants, and most likely all other clinical patients, would be incorrect when based solely on OBPM.
Our study further documents that: a) the original RSOFG prediction model, as well as its adjusted version to the population at hand (RSAFG), based on daytime OBPM performs very poorly compared with the ABPM−based RSABPM model; and b) the already high predictive value of the RSABPM is not improved when OBPM is added to the model. Compared with the OBPM−based RSAFG, the ABPM−based RSABPM model showed markedly improved calibration (significantly better goodness−of−fit as determined by the GND test), diagnostic accuracy (significantly increased sensitivity of the top quintile), discrimination (significantly greater C−statistic), and performance (significantly improved reclassification of the participants to a more precise estimate of event−probability) (table 2). Most important, the RSAFG−derived event−probability score of almost 60% of all participants fell beyond the 95%CI of their corresponding event−probability determined by the more accurate RSABPM model. Indeed, the extent of disagreement in the calculated event−probability when relying on less accurate OBPM, as determined by the Bland−Altman 95% limits of agreement, is a very large (−7.30%, 7.44%) interval, 50% larger than the 10% event−probability threshold currently recommended for defining high CVD risk.12 The total range of disagreement (−28.8 to 46.5%) further substantiated the extremely poor and clinically unacceptable reproducibility of the individual estimation of event−probability when relying on OBPM. Collectively, these findings not only establish important limitations of CVD risk stratification when based upon OBPM, as provided currently by the Framingham score,12,17 but also corroborate the clinical requirement of ABPM to both properly diagnose true hypertension and accurately quantify CVD risk.
The major limitations of our study are: a) findings on the prognostic value of the asleep SBP mean and sleep−time relative SBP decline require independent prospective validation as well as extrapolation to diverse ethnic groups; b) OBPM were obtained by health care practitioners in the clinic and thus BP may have been potentially overestimated due to a potential “white−coat” effect, although this approach reflects current medical practice and that used in most previously reported studies, including the Framingham study 1–5,7,17 and c) we used the most recent 2008−RSOFG prediction model17 without generalized correction for the Spanish population but rather specifically adjusted for the study population. The only currently available corrected RSOFG for Spain25 was developed as an adaptation of the oldest 1998−RSF.14 This corrected scale, however, is based on: a) a relatively small cohort of a single Northeast province of Spain, characterized by lower prevalence of CVD outcomes than the average for the country, and b) only a rather low number of coronary events instead of the more comprehensive CVD endpoint defined above used in the 2008−RSOFG. Accordingly, the RSAFG used herein for comparison with the ABPM−based model might well be more representative than the previously reported corrected scale.25
Our analyses also have important strengths. The Hygia Project is the only large−scale prospective CVD outcomes study completely integrated into routine primary care and thus representative of the population most frequently assessed for CVD risk stratification. Additional strengths are use of: a) 48−hour instead of the usual 24−hour ABPM to increase the reproducibility of BP findings; b) a properly designed participant diary to ascertain the beginning and end of activity and sleep spans to accurately derive on an individual basis awake and asleep SBP/DBP means, rather than relying on assumed and inaccurate arbitrary fixed clock hours to obtain daytime and nighttime values provided by device−manufacturer software, as done in most previous ABPM studies2,7; and c) use of multiple statistical measures (including the novel ones of NRSI and EEP first described herein) to objectively assess calibration, diagnostic accuracy, discrimination, and performance of the evaluated risk score models.
CONCLUSIONSThis prospective evaluation documents that the use of OBPM, as in the Framingham and other current models, markedly limits the accuracy of CVD risk stratification, resulting in misleading identification of individuals at either low or high susceptibility. The collective findings reported in this study support the critical importance of incorporating ABPM into routine clinical medicine, as recently recommended,10–13 but additionally from our perspective to accurately detect abnormal sleep−time BP to diagnose true hypertension and reliably stratify CVD vulnerability.
FUNDINGThe Hygia Project is an independent investigator−promoted research network supported by unrestricted grants from Ministerio de Ciencia e Innovación, Spanish Goverment (SAF2009−7028−FEDER); Instituto de Salud Carlos III, Ministerio de Economía y Competitividad, Spanish Government (PI14−00205); Consellería de Economía e Industria, Dirección Xeral de Investigación e Desenvolvemento, Galician Regional Government (INCITE08−E1R−322063ES; INCITE09−E2R−322099ES; 09CSA018322PR; IN845B−2010/114); Consellería de Cultura, Educación e Ordenación Universitaria, Galician Regional Government (CN2012/251; GPC2014/078; ED431B−2017/78); European Regional Development Fund (ERDF) and the Galician Regional Government under agreement for funding the Atlantic Research Center for Information and Communication Technologies (AtlantTIC); and Vicerrectorado de Investigación, University of Vigo. This funding body has no role in the study design, analysis and interpretation of data, writing of the reports, or the decision to submit articles for publication. A complete list of the Hygia Project investigators has been provided elsewhere.6,18
CONFLICTS OF INTERESTR.C. Hermida, D.E. Ayala, A. Mojón, M.H. Smolensky, and J.R. Fernández have shares of Circadian Ambulatory Technology & Diagnostics (CAT&D), a technology−based company developed by and in partnership with the University of Vigo. The remaining authors have nothing to disclose.
- –
The association between BP level and risk for CVD incidents is much more robust for parameters obtained from ABPM than from daytime OBPM.
- –
Current CVD risk stratification models continue to rely on OBPM exclusively along with traditional factors including age, sex, smoking, dyslipidemia, and/or diabetes.
- –
Data from 19 949 participants in a prospective, multicenter, 48−hour ABPM−based, CVD outcomes study, conducted in the primary care setting were used to compare the diagnostic accuracy, discrimination, and performance of the Framingham risk score (RSOFG) and its adjusted adaptation to the study population (RSAFG) with a novel CVD risk stratification model (RSABPM) constructed by replacing OBPM with ABPM−derived prognostic parameters.
- –
Asleep SBP mean and sleep−time relative SBP decline were the only joint significant BP−derived CVD risk factors and should therefore be used for diagnosis of hypertension and proper CVD risk stratification.
- –
Compared with RSOFG and RSAFG, the RSABPM model showed significantly improved calibration, diagnostic accuracy, and performance, indicating that vulnerability described by the RSABPM significantly improves discrimination of participants who developed a CVD event during follow-up.