
The American Heart Association has recently developed the Life's Essential 8 (LE8) score to encourage prevention of cardiovascular disease (CVD). This study assessed the distribution of LE8 in the Spanish adult population and its association with all-cause and CVD death.
MethodsWe used data from 11 616 individuals aged 18 years and older (50.5% women) from the ENRICA study, recruited between 2008 and 2010 and followed up until 2020 to 2022. The LE8 score includes 8 metrics (diet, physical activity, nicotine exposure, sleep health, body mass index, blood lipids and glucose, and blood pressure) and ranges from 0 to 100. The association of LE8 score with mortality was summarized with hazard ratios (HR), obtained from Cox regression.
ResultsIn total, 13.2% of participants (range, 6.1%-16.9% across regions) had low cardiovascular health (LE8 ≤ 49). During a median follow-up of 12.9 years, 908 total deaths occurred, and, during a median follow-up of 11.8 years, 207 CVD deaths were ascertained. After adjustment for the main potential confounders and compared with being in the least healthy (lowest) quartile of LE8, the HR (95%CI) of all-cause mortality for the second, third and fourth quartiles were 0.68 (0.56-0.83), 0.63 (0.51-0.78), and 0.53 (0.39-0.72), respectively. The corresponding figures for CVD mortality, after accounting for competing mortality risks, were 0.62 (0.39-0.97), 0.55 (0.32-0.93), and 0.38 (0.16-0.89).
ConclusionsA substantial proportion of the Spanish population showed low cardiovascular health. A higher LE8 score, starting from the second quartile, was associated with lower all-cause and CVD mortality.
Keywords
Cardiovascular disease (CVD) is the main global cause of death in adults, accounting for 17.9 million lives annually1 and generating an economic burden of 19% of the total health care expenditure in high-income European countries.2 To address the burden of CVD, international organizations have increasingly focused on preventing the development of key risk factors3 under the concept of primordial prevention.4 In 2010, the American Heart Association (AHA) defined a new model to assess and promote cardiovascular health (CVH), referred to as Life's Simple 7 (LS7). This model was composed of ideal levels of 7 metrics: 3 health behaviors (diet, physical activity, and nicotine) and 4 health factors (body mass index [BMI], blood total cholesterol, blood glucose, and blood pressure [BP])5. It was estimated that achieving optimal levels of LS7 would potentially prevent about 2 million CVD events in the United Stetes annually.6 In this line, there is extensive research evidence showing that ideal CVH metrics are strongly associated with a lower risk of all-cause and CVD death in North American,7 Asian,8 European9 and North African10 adults.
The AHA has recently updated its assessment tool to overcome certain limitations, renaming it as Life's Essential 8 (LE8). The LE8 optimized the measurement methods of the LS7 metrics, restructuring them on a scale of 0-100, and added sleep health as a new behavioral metric.11 Consequently, the LE8 is more sensitive in identifying group differences in CVH and recognizes the social and neuropsychological determinants for improving it, but keeps the aim of the LS7 to serve as a tool to measure and monitor health trajectories over time.
A higher LE8 score has recently been associated with lower all-cause and CVD mortality in US adults.12 However, little is known about the role of the LE8 score in mortality in European countries. To expand the use of this score in primordial prevention, it is essential to assess its implication in regions other than the United States, including Europe and particularly Mediterranean countries such as Spain, where CVD mortality is relatively low compared with that of the US population.13 Indeed there is a large difference in the age-standardized CVD mortality in Spain (107/100 000 habitants) and the United States (157/100 00).14 Despite these differences, CVD remains the main cause of mortality in adults in Spain, representing 26.4% of all deaths in 2021.15 Thus, assessing the LE8 score and its association with mortality could provide valuable insights on how to reduce the impact of CVD in Spain. Accordingly, the aims of the present study were: a) to evaluate the distribution of CVH using the LE8 score in a representative sample of the noninstitutionalized adult population in Spain, and b) to examine the association of the LE8 score with all-cause and CVD mortality.
METHODSStudy design and participantsThe ENRICA cohort is a prospective study of 13 105 individuals aged ≥ 18 years. The methods for that study have been previously reported and are described in the supplementary data.16,17 Of the 13 105 participants, we excluded 1489 (11.4%) with incomplete data on the LE8 score. Thus, the analytical sample comprised 11 616 individuals (5506 men, 6110 women) (figure 1 of the supplementary data).
Study participants gave written informed consent, and the study was approved by the Clinical Research Ethics Committee of La Paz University Hospital in Madrid (Trial registration: NCT02804672).
Study variablesLife's Essential 8 metricsThe LE8 score includes 4 health behaviors (diet, physical activity, nicotine exposure, sleep health) and 4 health factors (BMI, blood lipids, blood glucose, BP). Each metric was graded on a scale from 0 to 100 points, and the global score was calculated as the mean of the 8 metrics, following the AHA instructions.11 Moreover, the LE8 score incorporates a negative scoring system for nicotine exposure in cases where individuals live with active indoors smokers, as well as for those undergoing drug treatment for BP, sleep problems, and blood glucose and lipids.11 The overall CVH was considered as high (80-100 points), moderate (50-79 points), or low (0-49 points). The definitions and categorization of each metric in our study are shown in the Methods section of the supplementary data and in table 1 of the supplementary data.
Ascertainment of deathAscertainment of death is detailed in the supplementary data.
Other study variablesAt baseline, information on age and sex, drug treatment, physician-diagnosed diseases, use of health care services, and self-rated health was collected. Educational level was categorized as primary or lower, secondary, and university. Social class was classified as lowest, medium, and highest depending on the participant's occupation. Occupation was based on self-reported (current/last) employment, and it was coded according to the National Classification of Occupation in Spain.18
Statistical analysisAnalyses used weights to account for the complex sampling design. Variances were also corrected to calculate appropriate 95% confidence intervals (95%CI). The baseline characteristics of the study participants including the LE8 global score and each individual metric are expressed as the mean (95%CI) for continuous variables and as percentage for categorical variables. Additionally, for each autonomous community, we reported the LE8 global score, and the prevalence of individuals categorized as low CVH (0-49 points) according to the AHA.
Kaplan-Meier survival curves were constructed to graphically represent the association between quartiles of LE8 and all-cause and CVD mortality. To assess the association of the LE8 with all-cause and CVD mortality we used Cox proportional hazards models. The LE8 score was modeled as quartiles using the lowest (the least healthy) as the reference. We further conducted stratified analyses based on sociodemographic characteristics comparing the least healthy vs the healthiest quartile of the LE8 score. To examine whether the main results varied across strata, we fitted interaction terms between the LE8 score and each of the sociodemographic variables and assessed them with the Wald test.
Cox models were adjusted for age, sex, educational level, social class, and self-reported physician-diagnosed CVD (myocardial infarction, stroke, or heart failure; n=243) and cancer (n=123). People with a history of CVD or cancer were excluded from the analyses of CVD mortality because LE8 focuses on primordial CVD prevention. However, we replicated the analyses for all-cause mortality, also excluding individuals with CVD or cancer. The analyses regarding CVD mortality were performed with the Fine-Gray model for competing risks to assess the marginal probability of the “sub-distribution” as sub-hazard ratio (sHR), considering other causes of death as competing events.19 The proportional hazards assumption was checked using the Schoenfeld residuals method.
To examine the potential nonlinear relationship between the LE8 score and all-cause and CVD mortality, we used a restricted cubic spline analysis with 3 knots (10th, 50th, 90th percentile of the LE8 score) adjusted for the same covariates.
Some additional analyses were performed, including a) the association between each LE8 score metric (comparing the extreme categories of each metric) and mortality, b) estimation of the means of the scores of the individual LE8 metrics in each region, c) correlation analysis between the LE8 score and the age- and sex-adjusted mortality rates for all-causes20 and CVD21 in 2018 (before the COVID-19 pandemic to represent usual mortality) were performed across the 17 Spanish autonomous communities.
Statistical analyses were conducted with Stata v.16.0 (StataCorp) and statistical significance was defined as a 2-sided P value < .05.
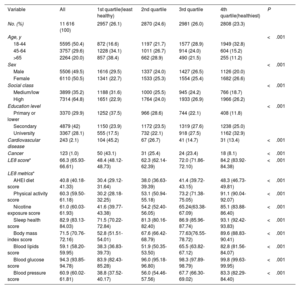
RESULTSAmong 11 616 adults included in the analysis, the mean (95%CI) age was 47.4 (47.0-47.7) years, 50.5% were women, and 97.5% self-reported being white (Caucasians). The baseline characteristics of the study participants are shown in table 1.
Baseline characteristics of the participants in the ENRICA total cohort and by Life's Essential 8 (LE8) quartiles
| Variable | All | 1st quartile(least healthy) | 2nd quartile | 3rd quartile | 4th quartile(healthiest) | P |
|---|---|---|---|---|---|---|
| No. (%) | 11 616 (100) | 2957 (26.1) | 2870 (24.6) | 2981 (26.0) | 2808 (23.3) | |
| Age, y | <.001 | |||||
| 18-44 | 5595 (50.4) | 872 (16.6) | 1197 (21.7) | 1577 (28.9) | 1949 (32.8) | |
| 45-64 | 3757 (29.6) | 1228 (34.1) | 1011 (26.7) | 914 (24.0) | 604 (15.2) | |
| >65 | 2264 (20.0) | 857 (38.4) | 662 (28.9) | 490 (21.5) | 255 (11.2) | |
| Sex | <.001 | |||||
| Male | 5506 (49.5) | 1616 (29.5) | 1337 (24.0) | 1427 (26.5) | 1126 (20.0) | |
| Female | 6110 (50.5) | 1341 (22.7) | 1533 (25.3) | 1554 (25.4) | 1682 (26.6) | |
| Social class | <.001 | |||||
| Medium/low | 3899 (35.2) | 1188 (31.6) | 1000 (25.5) | 945 (24.2) | 766 (18.7) | |
| High | 7314 (64.8) | 1651 (22.9) | 1764 (24.0) | 1933 (26.9) | 1966 (26.2) | |
| Education level | <.001 | |||||
| Primary or lower | 3370 (29.9) | 1252 (37.5) | 966 (28.6) | 744 (22.1) | 408 (11.8) | |
| Secondary | 4879 (42) | 1150 (23.9) | 1172 (23.5) | 1319 (27.6) | 1238 (25.0) | |
| University | 3367 (28.1) | 555 (17.5) | 732 (22.1) | 918 (27.5) | 1162 (32.9) | |
| Cardiovascular disease | 243 (2.1) | 104 (45.2) | 67 (26.7) | 41 (14.7) | 31 (13.4) | <.001 |
| Cancer | 123 (1.0) | 50 (43.1) | 31 (25.4) | 24 (23.4) | 18 (8.1) | <.001 |
| LE8 score* | 66.3 (65.93-66.61) | 48.4 (48.12-48.73) | 62.3 (62.14-62.39) | 72.0 (71.86-72.10) | 84.2 (83.92-84.38) | <.001 |
| LE8 metrics* | ||||||
| AHEI diet score | 40.8 (40.18-41.33) | 30.4 (29.12-31.64) | 38.0 (36.63-39.39) | 41.4 (39.72-43.15) | 48.3 (46.73-49.81) | <.001 |
| Physical activity score | 60.3 (59.50-61.18) | 30.2 (28.18-32.25) | 53.1 (50.94-55.18) | 73.2 (71.38-75.05) | 91.1 (90.04-92.07) | <.001 |
| Nicotine exposure score | 61.0 (60.03-61.93) | 41.6 (39.77-43.38) | 54.2 (52.40-56.05) | 65.24(63.38-67.09) | 85.1 (83.88-86.40) | <.001 |
| Sleep health score | 82.9 (83.13-84.03) | 71.5 (70.22-72.84) | 81.3 (80.16-82.40) | 86.9 (85.96-87.74) | 93.1 (92.42-93.83) | <.001 |
| Body mass index score | 71.5 (70.76-72.16) | 52.8 (51.51-54.01) | 67.6 (66.42-68.79) | 77.63(76.55-78.72) | 89.6 (88.83-90.41) | <.001 |
| Blood lipids score | 59.1 (58.20-59.95) | 38.3 (36.83-39.73) | 51.9 (50.35-53.50) | 65.5 (63.82-67.12) | 82.8 (81.56-84.07) | <.001 |
| Blood glucose score | 94.3 (93.85-94.78) | 83.9 (82.43-85.28) | 96.0 (95.18-96.80) | 98.3 (97.89-98.79) | 99.8 (99.63-99.95) | <.001 |
| Blood pressure score | 60.9 (60.02-61.81) | 38.8 (37.52-40.17) | 56.0 (54.46-57.56) | 67.7 (66.30-69.02) | 83.3 (82.29-84.40) | <.001 |
AHEI, Alternative Healthy Eating index; CI, confidence interval.
Data are expressed as No. (%) or mean (95% confidence interval).
In the overall population, the mean (95%CI) LE8 score was 66.3 (65.9-66.6), with 16.8% of the participants being classified as high CVH, 70.0% as moderate CVH, and 13.2% as low CVH. The highest and lowest scoring metrics were blood glucose 94.3 (93.9-94.8) and diet 39.89 (38.5-40.1), respectively (table 1). Participants in the lowest LE8 quartile (least healthy) were older, more likely to be men, from the lowest social class and with lower education than those in the other quartiles.
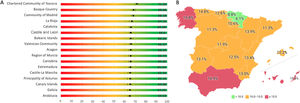
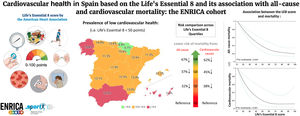
The highest LE8 scores were observed in Navarre (71.6), the Basque Country (68.9), and Madrid (68.2), whereas the lowest scores were found in Andalusia (64.5), Galicia (64.5), and the Canary Islands (65.0) (figure 1A). Correspondingly the highest prevalence of individuals with low CVH score corresponded to the latter 3 regions (figure 1B and table 2 of the supplementary data). Diet was the metric with the lowest score in those regions with lower LE8 scores (table 3 of the supplementary data).

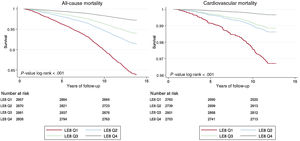
During a median follow-up of 12.9 years [interquartile range (IQR), 12.6-13.3], there were 908 all-cause deaths, and during a median follow-up of 11.8 years (IQR, 11.5-12.2), there were 207 CVD deaths. Kaplan-Meir survival curves showed an inverse gradient in all-cause and CVD deaths over time according to LE8 score quartiles (figure 2). Table 2 shows the association of quartiles of LE8 score with all-cause and CVD mortality. After adjustment for potential confounders, compared with being in the least healthy (lowest) LE8quartile, the HR (95%CI) of all-cause mortality for the second, third and fourth quartiles were 0.68 (0.56-0.83), 0.63 (0.51-0.78), and 0.53 (0.39-0.72), respectively. Corresponding figures for CVD mortality, after accounting for competing mortality risks, were 0.62 (0.39-0.97), 0.55 (0.32-0.93) and 0.38 (0.16-0.89. After exclusion of individuals with CVD or cancer, the results for the association between LE8 and total mortality remained similar (table 4 of the supplementary data).
, and cardiovascular death (B) by quartiles of the Life")
Association of Life's Essential 8 score quartiles with all-cause and cardiovascular mortality in the ENRICA cohort
| All-cause mortality | Cardiovascular mortality a | |||||
|---|---|---|---|---|---|---|
| LE8 score | Deaths/N | HR (95%CI) | P | Deaths/Na | sHR (95%CI) b | P |
| Q1 (least healthy) | 426/2957 | 1 [Reference] | - | 80/2805 | 1 [Reference] | - |
| Q2 | 257/2870 | 0.68 (0.56-0.83) | <.001 | 46/2774 | 0.62 (0.39-0.97) | .036 |
| Q3 | 157/2981 | 0.63 (0.51-0.78) | <.001 | 28/2918 | 0.55 (0.32-0.93) | .027 |
| Q4 (healthiest) | 68/2808 | 0.53 (0.39-0.72) | <.001 | 8/2761 | 0.38 (0.16-0.89) | .026 |
95%CI, 95% confidence interval; HR, hazard ratio; sHR, subhazard ratio.
Analyses were adjusted for age (as a continuous variable), sex, social class, education level, cardiovascular disease, and cancer (for all-cause mortality).
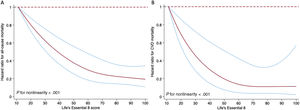
Figure 3 displays the restricted cubic spline of mortality by LE8 score. The risk of all-cause death decreased progressively with increasing LE8 score (P for nonlinearity <.001). The risk for CVD mortality decreased progressively with increasing LE8 up to a score of about 50, and then levelled off (P for nonlinearity <.001).

Dose-response relationship between the Life's Essential 8 (LE8) score and all-cause mortality (A) and cardiovascular disease (CVD) mortality (B). Plotted values are hazard ratios (95% confidence intervals) of mortality adjusted for age, sex, social class, education level, CVD, and cancer. For CVD mortality, individuals with cardiovascular disease and cancer at baseline were excluded, and so these 2 variables were not adjusted for in the analysis. The restricted cubic spline knots are located at the 10th, 50th and 90th percentile of the LE8 score. Hazard ratio (solid black lines) and 95% confidence intervals (blue lines).
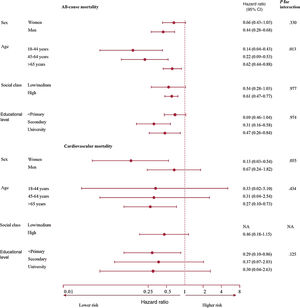
Analyses of the association between the LE8 score and mortality stratified by sociodemographic characteristics are presented in figure 4. In general, the associations showed the expected direction in all strata, although the association for all-cause mortality was somewhat stronger among those of younger age (P for interaction=.013). The corresponding results for each LE8 metric are presented in figure 2 of the supplementary data. Physical activity, nicotine exposure, and blood glucose were significantly associated with reduced risk of all-cause death (HR <1, P <.05), and blood glucose with a reduced risk of CVD death (HR <1, P<.05).
 65 years: 56/255; social class, low/medium: 13/766, high: 51/1966; education level,
 The Life's Essential 8 score and the risk of all-cause and cardiovascular death stratified by sociodemographic characteristics. Plotted values are hazard ratios (95% confidence intervals) of mortality for the highest vs lowest quartile of the LE8 score and were adjusted age, sex, social class, educational level, cardiovascular disease, and cancer (on a logarithmic scale on the x-axis). For cardiovascular disease mortality, individuals with cardiovascular disease and cancer at baseline were excluded, and so these 2 variables were not adjusted for in the analysis. 95%CI, 95% confidence interval. NA: not applicable.
The number of deaths/total number of people within the healthiest quartile in each category was as follows:
-All-cause mortality analyses: sex, women: 34/1682, men: 34/1126; age, 18-44 years: 6/1949, 45-64 years: 6/604,> 65 years: 56/255; social class, low/medium: 13/766, high: 51/1966; education level, <primary: 38/408, secondary: 14/4879, university: 16/3367.
-Cardiovascular mortality analyses: sex, women: 2/1655, men: 6/1106; age, 18-44 years: 1/1935, 45-64 years: 1/592,>65 years: 6/234; social class, low/medium: 0/756, high: 7/1933; educational level, <primary: 5/394, secondary: 2/1215, university: 1/1152.
The regional distribution of the age- and sex-adjusted all-cause and CVD mortality in Spain in 2018 is shown in figure 3 of the supplementary data. Table 5 of the supplementary data displays the correlation between the LE8 score from 2008 to 2010 from the ENRICA study and the adjusted mortality rates in 2018 across the 17 autonomous communities. An inverse correlation was observed between the LE8 score and both all-cause (r=−0.72) and CVD mortality (r=−0.66). Conversely, a direct correlation was found between the percentage of individuals with low CVH (0-49 points) and all-cause (r=0.70) or CVD mortality (r=0.70). Figure 5 represents the main results of the article.

Central illustration. Description of the components of the American Heart Association's Life's Essential 8 score. Prevalence of low cardiovascular health. The numbers represent the percentages of individuals with less than 50 points in the Life's Essential 8 score. The risk comparison across the Life's Essential 8 score quartiles with quartile 1 (least healthy) as the reference. The nonlinear association between the score and mortality risk assessed by the restricted cubic splines.
The main findings of this study were: a) About 13% of Spanish adults had low CVH according to the AHA LE8 score; b) some regions such as Andalusia, Galicia, and the Canary Islands had the highest prevalence of low CVH; c) a higher LE8 score, starting from the second quartile, was associated with lower all-cause and CVD mortality; d) the association between LE8 score and mortality showed a nonlinear dose-response, especially for CVD deaths, for which the reduced mortality levelled off at values above LE8 50. Taken together, these findings highlight the role of the LE8 as a valuable tool for raising awareness and providing education for patients and clinicians regarding primordial prevention of CVD in Spain.
Previous studies have also reported low levels of CVH in Spain using the previous AHA LS7.22,23 To the best of our knowledge, this is the first study reporting representative whole country and region-specific values of the LE8, as well as its association with all-cause and CVD mortality in a European cohort. The prevalence of low CVH in our study (13.2%) is comparable to that in studies in North American (12.2%)12 and Asian (10.8% in the Kailuan cohort) populations.24 Our results concur with previous research12,24,25 that diet corresponds to the metric with the lowest score, while sleep and glucose are those with the highest score. This finding might be explained by factors such as marketing of unhealthy foods,26 cultural influences,27 busy lifestyles,28 lack of knowledge, and low nutritional education.29
The highest prevalence of low CVH was observed in Andalusia, Galicia, and the Canary Islands. Similar patterns were observed in previous reports on the prevalence of obesity30 and diabetes31,32 in Spain. We identified that diet was again the metric with significantly lower scores in those regions with lower LE8 scores, such as Andalusia, Galicia, and the Canary Islands. However, the aim of our study was not to explain in detail the distribution of CVD mortality risk in Spain, since it is known that the classic cardiovascular risk factors, such as those included in LE8, do not fully explain the geographical variations in CVD mortality within a country or between countries. Nevertheless, the results of the regional distribution of low CVH (LE8 0-49 points) in our study do show some relationship with all-causes20 and CVD mortality21 in Spain; indeed, some regions, such Andalusia and the Canary Islands, showed both low CVH and high CVD mortality, while others, including Madrid, Navarre, the Basque Country and Castile and Leon, with a low prevalence of low CVH according to the LE8, consistently had low CVD mortality. Moreover, our analyses also found a good correlation between the LE8 score in each region from 2008 to 2010 and the mortality rates in each region in 2018. Considering these factors, strategies for improving dietary habits are required, especially in those regions where CVH is poorer. In Spain, The Cardiovascular Health Strategy was developed in 2022 to reduce the burden of CVD and prioritizes citizen training on healthy dietary habits.33 Our results indicate that these strategies should clearly be strengthened.
We found that participants in the highest vs lowest LE8 quartile had a 47% and 62% lower risk of all-cause and CVD death, respectively. These results are similar to those in a small sample of Finnish men in which those in the highest vs lowest LE8 quartile had 48% lower all-cause and 60% lower CVD mortality.25 Similarly, in the NHANES cohort, those with high CVH (80-100 points) had 40% lower all-cause and 54% lower CVD mortality than those with low CVH (0-49 points).12
When we analyzed the LE8 score as a continuous variable using splines, we identified an inverse relationship between the score and mortality risks, with higher LE8 scores being associated with lower mortality. However, mortality reduction had a nonlinear trend, indicating that the relationship between the LE8 score and mortality risk exhibits varying degrees of risk reduction at different score values. In the case of all-cause mortality, the graph shows a greater risk reduction in the lower scores, suggesting that once a score of 60-70 points is reached, the decrease in the risk of mortality is less steep than for lower scores. In terms of CVD mortality, the minimum score associated with a reduced risk of mortality appears to be around 50 points. The continuous approach of the LE8 is not only interesting for monitoring, but also to clinicians in their efforts to motivate the population to improve their habits under an easy-to-understand graphic format. A similar risk reduction is also shown in the previously mentioned studies exploring the effects of the LE8 score on mortality,12,25 and in a recent investigation describing the risk of major adverse cardiovascular events in the UK BIOBANK population.34
These findings underscore the importance of targeted interventions and strategies aimed at improving LE8 metrics among individuals with low LE8 scores. Strategies like TANSNIP-PESA35 have demonstrated significant improvements in CVH among at-risk people through modification of health behaviors in Spain. To further enhance CVH in populations with low LE8 scores, it is crucial to implement additional actions of a similar nature.
Overall, our stratified analyses suggest a protective trend of higher LE8 scores in most population subgroups; for all-cause death, our results also suggest that greater benefits could be achieved when targeting interventions to younger adults. More research is needed to confirm these results.
Strengths and limitationsA main strength of the present study is its large and representative sample from Spain. Another is that all the study variables were measured with valid instruments and standardized methods. However, this study is not without limitations. The new LE8 score has been proposed to monitor health changes over time, but we could not assess the long-term changes in LE8 due to a lack of temporal data. Health behaviors were self-reported, which may entail some recall bias. In addition, the percentage of people in high social classes was somewhat high, according to the National Classification of Occupation; this is because most people in Spain have nonmanual jobs, a large percentage works in the services sector, and there is a substantial proportion of self-employed individuals. In addition, population-based studies usually over-represent people with higher education.16 Moreover, the score of each metric of LE8 is somewhat arbitrary (table 1 of the supplementary data). It is also noteworthy that receiving drug treatment for elevated blood cholesterol, glucose or blood pressure entails a 20-point reduction in the corresponding metric score; the AHA argues that, despite drug treatment, some residual excess death risk remains in individuals with initially elevated but treated CVD risk factors. It is possible that the procedures to calculate the LE8 metrics might have contributed to finding only a small or null association between some of them and mortality in figure 2 of the supplementary data. Lastly, the observational design does not allow causality to be inferred between the LE8 score and death risk. The study did not follow the SAGER guidelines, although our sample is sex balanced.
Future research based on a larger population sample with objective measurements (eg, accelerometry to assess physical activity or sleep) and more precise socioeconomic status variables is needed to assess the effectiveness of healthy lifestyle programs in improving the LE8 score.
CONCLUSIONSA substantial proportion of Spanish adults had low CVH according to the AHA LE8 score. Certain geographical regions, such as Andalusia, Galicia and the Canary Islands, had a higher prevalence of low CVH than the average in Spain. Over a long follow-up, people with a higher LE8, starting from the second quartile of the score, showed lower all-cause and CVD mortality. These findings suggest that implementing targeted interventions aimed at improving the scores or achieving a minimum of 50 points (moderate CVH), could have a significant impact on reducing mortality in Spain. Since it is a straightforward and practical tool, the LE8 score could be useful for educating patients and helping clinicians to identify individuals at higher risk who might derive the greatest benefit from lifestyle interventions. However, further research is needed to test the potential applications of this score.
FUNDINGThis work was supported by the Institute of Health Carlos III, Secretary State for R+D+I, and the European Regional Development Fund/European Social Fund (FIS grants 19/319; 22/1111; 22/1164; 20/00896; 20/00657); the National Plan on Drugs (grant 2020/17); the MCIN/AEI/10.13039/501100011033/CNS2022-135623/RYC 2018-02069I and the European Union “NextGenerationEU/PRTR” (PLEC2022-009352 grant); the ISCIII-CDTI and the European Union “NextGenerationEU/PRTR” (PMPTA22/00107 grant); and the REACT EU Program, Comunidad de Madrid, Spain, the European Regional Development Fund (FACINGLCOVID-CM project).
A. Hernández-Martínez was supported by Plan Propio de Investigación from the Universidad de Almería, Programa Gerty Cori. The funders had no role in study design, data collection and analysis, decision to publish, or preparation of the manuscript.
ETHICAL CONSIDERATIONSStudy participants gave written informed consent, and the study was approved by the Clinical Research Ethics Committee of La Paz University Hospital in Madrid (Trial registration: NCT02804672).
The present study did not follow the SAGER guidelines, although our sample is sex balanced.
STATEMENT ON THE USE OF ARTIFICIAL INTELLIGENCEDuring the preparation of this work, the authors did not use any artificial intelligent tool.
AUTHORS’ CONTRIBUTIONSA. Hernández-Martínez: study design, statistical analysis, interpretation of results, drafting the manuscript; MA Duarte-Junior: statistical analysis supervision, interpretation of results, reviewing the manuscript for important intellectual content; R. Ortolá, J.R. Banegas, M. Sotos-Prieto: interpretation of results, reviewing the manuscript for important intellectual content; A. Soriano-Maldonado, D. Martínez-Gómez, F. Rodríguez-Artalejo: study design, interpretation of results, reviewing the manuscript for important intellectual content, study supervision. All authors have read and approved the final version of this manuscript and provided written consent for its publication accepting complete responsibility for its content. The authors’ contributions were agreed prior to manuscript submission.
CONFLICTS OF INTERESTThe authors declare no competing interests.
- -
As a strategy for primordial CVD prevention, the AHA has introduced a new algorithm, called the LE8, which determines cardiovascular health (CVH) and addresses the limitations of the LS7 score.
- -
The LE8 score is based on 8 health metrics: diet, physical activity, nicotine exposure, sleep, body mass index, blood glucose, and blood pressure.
- -
Higher CVH assessed by the LE8 score is associated with lower all-cause and CVD mortality in North American adults.
- -
About 13% of the Spanish population aged ≥ 18 years showed low CVH according to the LE8 score. The regions with the highest prevalence of low CVH were Andalusia, Galicia, and the Canary Islands.
- -
Spanish adults with higher LE8 score, starting from the second quartile, had lower all-cause and CVD mortality.