To estimate the prevalence of cardiovascular risk factors in individuals aged 35-74 years in 10 of Spain's autonomous communities and determine the geographic variation of cardiovascular risk factors distribution.
MethodsPooled analysis with individual data from 11 studies conducted in the first decade of the 21st century. The average response rate was 73%. Lipid profile (with laboratory cross-validation), glucose level, blood pressure, waist circumference, height, and weight were measured and standard questionnaires administered. Age-standardized prevalence of smoking, diabetes, hypertension, dyslipidemia, and obesity in the European population were calculated. Furthermore, the coefficient of variation between component studies was determined for the prevalence of each risk factor.
ResultsIn total, 28,887 participants were included. The most prevalent cardiovascular risk factors were high blood pressure (47% in men, 39% in women), total cholesterol ≥250mg/dL (43% and 40%, respectively), obesity (29% and 29%, respectively), tobacco use (33% and 21%, respectively), and diabetes (16% and 11%, respectively). Total cholesterol ≥190 and ≥250mg/dL were the respective minimum and maximum coefficients of variation (7%-24% in men, 7%-26% in women). Average concordance in lipid measurements between laboratories was excellent.
ConclusionsPrevalence of high blood pressure, dyslipidemia, obesity, tobacco use and diabetes is high. Little variation was observed between autonomous communities in the population aged 35-74 years. However, presence of the most prevalent cardiovascular risk factors in the Canary Islands, Extremadura and Andalusia was greater than the mean of the 11 studies.
Keywords
Cardiovascular disease is the primary cause of death in the Spanish population.1 The detection and control of cardiovascular risk factors remains the essential preventive strategy.2 In Spain, data from population-based studies on cholesterol trends in the past decade are inconclusive. Some studies show a fall in cholesterol,3 whereas other authors indicate an increase.4 Furthermore, improved control of high blood pressure (HPB) has been observed,3 in contrast with the increased prevalence of obesity,5 diabetes mellitus,6 and tobacco use, particularly in women.3
The absence of objective measures in Spain's National Health Survey (NHS)7 prevents us from determining the real countrywide prevalence of cardiovascular risk factors. However, population-based epidemiologic studies including anthropometric measures, blood pressure data and laboratory tests do enable us to accurately determine prevalence in representative samples.
Earlier studies indicated substantial variability in cardiovascular risk factors prevalence between autonomous communities.8,9 The epidemiologic wing of the present study (DARIOS-Epidemiológico) examines dyslipidemia, atherosclerotic risk, increased high-sensitivity C-reactive protein (hsCRP), and inflammatory and oxidative status in the Spanish population. It is a pooled analysis with individual data from studies using comparable methods that have been conducted in Spain in the population aged 35-74 since 2000.
The objective is to analyze combined cardiovascular risk factors prevalence in 11 studies conducted in 10 of Spain's autonomous communities in the first decade of the 21st century and determine the level of geographic variability of cardiovascular risk factors distribution.
Methods Study PopulationPooled analysis with individual data from 11 population-based studies conducted in different geographical areas of Spain (in parentheses) since 2000 with similar methodological designs: ARTPER10 (Catalonia-Barcelona), CDC de Canarias11 (the Canary Islands), CORSAIB12 (Balearic Islands), DINO13 (Region of Murcia), DRECA-214 (Andalusia), HERMEX15 (Extremadura), PREDIMERC16 (Community of Madrid), RECCyL17 (Castile and Leon), REGICOR3 (Catalonia-Girona), RIVANA18 (Community of Navarra) and TALAVERA19 (Castile-La Mancha) (Table 1). These studies included patients aged 35-74 years, except ARTPER, which enrolled participants in the 49-74 age range.10 All participants gave written informed consent to take part in the component studies. The DARIOS study was approved by the Municipal Healthcare Institute's Clinical Research Ethics Committee (authorization n° 2009/3640).
Table 1. General Characteristics of the DARIOS Study and Each Components Study.
| ARTPER 10 (45-74 years) | CDC 11 | CORSAIB 12 | DINO 13 | DRECA-2 14 | HERMEX 15 | PREDIMERC 16 | RECCyL 17 | REGICOR 3 | RIVANA 18 | TALAVERA 19 | General | |
| Participants, n (%) | 3232 (11) | 4715 (16) | 1669 (6) | 945 (3) | 1599 (6) | 2204 (8) | 2003 (7) | 2436 (8) | 5694 (20) | 3862 (13) | 528 (2) | 28 887 (100) |
| Age (years), mean ± SD | 62±7 | 49±9 | 54±11 | 53±12 | 53±11 | 52±11 | 53±12 | 54±12 | 54±11 | 52±11 | 57±12 | 54±11 |
| Men, % | 46 | 44 | 48 | 47 | 46 | 48 | 48 | 50 | 47 | 46 | 46 | 46 |
| Age groups | ||||||||||||
| 35-44, n (%) | — | 1772 (38) | 442 (26) | 304 (32) | 489 (31) | 671 (30) | 684 (34) | 698 (29) | 1346 (24) | 1193 (31) | 104 (20) | 7703 (27) |
| 45-54, n (%) | 572 (18) | 1424 (30) | 442 (26) | 239 (25) | 422 (26) | 615 (28) | 444 (22) | 554 (23) | 1566 (28) | 1124 (29) | 123 (23) | 7525 (26) |
| 55-64, n (%) | 1476 (46) | 1347 (29) | 425 (25) | 200 (21) | 380 (24) | 502 (23) | 443 (22) | 585 (24) | 1514 (27) | 880 (23) | 121 (23) | 7873 (27) |
| 65-74, n (%) | 1184 (37) | 172 (4) | 360 (22) | 202 (21) | 308 (19) | 416 (19) | 432 (22) | 599 (25) | 1268 (22) | 665 (17) | 180 (34) | 5786 (20) |
| Geographical area | Two districts in Barcelona province | Autonomous Community of the Canary Islands | Autonomous Community of the Balearic Islands | Region of Murcia | Autonomous Community of Andalusia | HCA D. Benito-Villanueva de la Serena (Badajoz) | Autonomous Community of Madrid | Autonomous Community of Castile and Leon | 6 districts in Girona province | Community of Navarra | HCA Talavera de la Reina (Toledo) | — |
| Reference population (35-74) | 178 624 | 1 055 370 | 340 675 | 516 609 | 3 695 353 | 54 098 | 3 129 232 | 1 201 873 | 290 336 | 268 470 | 29 773 | 10 760 413 |
| Response rate, % | 63 | 70 | 77 | 63 | 95 | 81 | 58 | 81 | 72 | 74 | 75 | 73 |
| Sample type | Random | Random | Random | Random | Random | Random | Random | Random | Random | Random | Random | — |
| Context of sampling | Healthcare ID card census | Population census | Healthcare ID card census | Healthcare ID card census | Population census | Healthcare ID card census | Healthcare ID card census | Healthcare ID card census | Population census | Population census | Municipal census | — |
| Enrollment period | 2006-2008 | 2000-2005 | 2000 | 2001-2003 | 2006-2007 | 2008-2009 | 2007 | 2004 | 2004-2006 | 2004-2005 | 2006 | — |
HCA, health care area; ID, identity; SD, standard deviation.
The component studies’ questionnaires were based on standardized World Health Organization (WHO) surveys.20 Sociodemographic variables and data on tobacco use and history of HBP, dyslipidemia, and diabetes were recorded. Prevalence of current smokers, ex-smokers (>1 year), and non-smokers was calculated.
Trained healthcare workers conducted the physical examinations. The participants’ waist circumference, weight, and height were measured. Body mass index (BMI) was calculated, dividing weight by height squared (kg/m2) to define the categories of overweight and obesity as in the Spanish Society for the Study of Obesity classification.21 Adult Treatment Panel III cutoff points for waist circumference (>102cm in men,>88cm in women) were used.22
Prevalence of HBP was estimated using the lower of the first 2 blood pressure measurements, in line with 7th Joint National Committee Report cutoff points.23 The following definitions were established: a) diagnosed HBP: participants diagnosed by a standardized questionnaire, and b) real HBP: participants diagnosed or presenting with systolic blood pressure ≥140 mmHg or diastolic blood pressure ≥90 mmHg.23
Laboratory MeasurementsBlood samples were taken following a>10h fast. Analysis was performed in local laboratories on fresh blood or aliquots of serum stored at –80°C in samples not previously thawed. Triglycerides, glucose, and total cholesterol were measured using enzymatic methods. All local laboratories satisfied external quality-control requirements.3,10,11,12,13,14,15,16,17,18,19 When triglycerides were<300mg/dL, low density lipoprotein cholesterol (LDLc) was calculated using the Friedewald formula, to avoid underestimating LDLc.
A concordance study of the CDC-Canarias, CORSAIB, DRECA-2, HERMEX, PREDIMERC, RECCyL, and RIVANA laboratories (64% of the sample) was conducted. From each study, 100 samples were analyzed for total cholesterol, high density lipoprotein cholesterol (HDLc), and triglycerides using the IMIM laboratory–originally used by REGICOR and TALAVERA (22% of the sample)–as reference. The IMIM laboratory used esterase-oxidase-peroxidase (CHOD-PAP, ABX-Horiba, Montpellier, France) to measure cholesterol. Triglycerides were measured with glycerol-phosphate oxidase-peroxidase (GPO-PAP, ABX-Horiba). Direct HDLc measurement was with selective accelerator detergent (ABX-Horiba). The ARTPER and DINO studies (14% of the sample) were unable to provide samples for the concordance study.
Prevalence was calculated for: a) diagnosed diabetes mellitus (participants diagnosed by a standardized questionnaire); b) real diabetes mellitus (participants diagnosed or with glucose level ≥126mg/dL), and c) impaired fasting glucose (participants not diagnosed with diabetes mellitus and with glucose level 110-125mg/dL).24
Prevalence was calculated for: a) diagnosed dyslipidemia (participants diagnosed by a standardized questionnaire), and b) real dyslipidemia (participants diagnosed or presenting total cholesterol ≥190, ≥240 or ≥250mg/dL or LDLc ≥115 or ≥160mg/dL, depending on clinical practice guidelines).24,25,26 Prevalence of hypoalphalipoproteinemia was determined (LDLc<40 in men and<50mg/dL in women).
Statistical AnalysisAge-standardized prevalence was determined for each RF in each component study. To do this, individuals were categorized in 5-year age groups and a rough prevalence figure calculated. This was later standardized by the direct method, with reference to the European population.27 These figures were accompanied by the 95% confidence interval for the cardiovascular risk factors, stratified by sex for each component study and for the combined studies. Heterogeneity between individual studies was determined with the Levene test for homogeneity of variances between all participating centers for the principle variables. Individuals were classified in 8 groups by age and sex. To calculate the mean or general prevalence of each cardiovascular risk factors and the corresponding confidence intervals, we combined the estimates obtained individually for each study using the DerSimonian-Laird random-effects method to compensate for differences in sample size. Prevalences were compared by age group with NHS results for 2006. Continuous variables are described as mean and 95% confidence interval, also standardized for the European population. The standardized ratio of prevalences was calculated, centering the mean of all component studies to 100% and calculating deviations from this point for each component study and risk factor: tobacco use, systolic blood pressure ≥140 mmHg or diastolic blood pressure ≥90 mmHg, total cholesterol ≥250 and ≥190mg/dL, BMI ≥30, and glucose level ≥126mg/dL.
The coefficient of variation (CV) was estimated to determine variability between component studies in the prevalence of each risk factor, calculating the percentage deviation of each study versus the average of all studies using the following formula:

This CV corresponded to the standard deviation of the 11 studies.
Pearson's correlation coefficients were calculated to analyze deviations in each study with respect to mortality from ischemic heart disease for 2007, standardized for the European population, in each autonomous community.28 Data from ARTPER were excluded because of differences in the age distribution (individuals aged>49 years) with respect to the other studies.
Concordance of lipid measurements with the reference laboratory was measured using the coefficient of determination R2, intraclass correlation coefficient, and Bland-Altman graphics that analyze the relation between mean values of the original measurement and the reference mean, and the differences between the two.29 The effect of outliers was analyzed through a graphic representation of residuals. Points that differed by>40mg/dL for total cholesterol,>10mg/dL for HDLc, and>40mg/dL for triglycerides, between the original measurement and that of the reference laboratory were considered sampling errors and eliminated; the graphics were redrawn. When 95% of differences were within±5% of the reference laboratory mean determination, participating center and reference laboratory results were considered equivalent. When the value range was outside of±5%, the Deming regression was used to correct the original values30 if systematic bias was observed in the figures.
Statistical Analysis was conducted with R Version 2.10 (R Foundation for Statistical Computing, Vienna, Austria).
ResultsThe study enrolled 28 887 participants from the following 10 autonomous communities: Andalusia, Balearic Islands, Canary Islands, Castile-La Mancha, Castile and Leon, Catalonia, Extremadura, Community of Madrid, Region of Murcia and Community of Navarra. Their total population represents approximately 70% of the Spanish population aged 35-74. Table 1 presents the characteristics of each component study. Significant heterogeneity (P<.05) was found for systolic blood pressure in all age groups of women, whereas in men it was found in all age groups except the 55-64 year range. Significant heterogeneity was found for diastolic blood pressure in men aged<45 years and in all age groups in women. For total cholesterol, we found heterogeneity only in women aged>45 years.
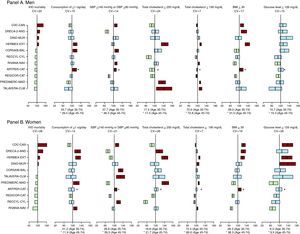
Table 2 presents values of glucose level, blood pressure and prevalences of impaired fasting glucose, diabetes mellitus and diagnosed and real HBP by sex. Independently of the diagnosis of diabetes mellitus, women in the CDC, DINO and HERMEX studies presented a prevalence of baseline glucose level ≥126mg/dL significantly greater than the mean (Figure 1). Similarly, independently of the diagnosis of HBP, prevalence of systolic blood pressure ≥140 mmHg or diastolic blood pressure ≥90 mmHg was significantly greater than the mean in the ARTPER, CDC and CORSAIB studies in both men and women; in men, in the RIVANA study; and in women, in the RECCYL and TALAVERA studies (Figure 1).
Table 2. Glucose Level, Systolic Blood Pressure and Diastolic Blood Pressure and Prevalence of Diabetes and High Blood Pressure Standardized to the European Population by Component Study and General Study in Men and Women Aged 35-74 Years.
| ARTPER(45-74 years) | CDC | CORSAIB | DINO | DRECA-2 | HERMEX | PREDIMERC | RECCyL | REGICOR | RIVANA | TALAVERA | General | |
| Men, n | 1493 | 2054 | 804 | 443 | 736 | 1046 | 966 | 1198 | 2685 | 1765 | 235 | 13 425 |
| Glucose level, mg/dL | 110 (108-112) | 105 (104-106) | 106 (104-109) | 105 (102-108) | 100 (97-103) | 109 (107-110) | 104 (102-106) | 102 (101-104) | 102 (101-103) | 106 (104-107) | 103 (100-106) | 105 (103-106) |
| IFG, % | 13 (11-15) | 12 (10-14) | 12 (9-14) | 11 (8-14) | 5 (4-7) | 20 (18-23) | 11 (8-13) | 12 (10-14) | 9 (8-10) | 17 (15-18) | 11 (6-16) | 12 (10-14) |
| Diagnosed DM, % | 25 (22-27) | 13 (12-15) | 12 (10-14) | 14 (10-17) | 14 (12-16) | 11 (9-13) | 10 (8-11) | 7 (6-9) | 12 (11-14) | 10 (9-11) | 13 (8-17) | 13 (10-15) |
| Real DM, % | 27 (25-30) | 17 (15-19) | 17 (14-19) | 16 (12-19) | 17 (15-20) | 16 (14-18) | 13 (11-15) | 11 (10-13) | 15 (14-16) | 13 (11-14) | 15 (10-20) | 16 (14-18) |
| SBP, mmHg | 137 (136-138) | 128 (127-129) | 131 (130-133) | 132 (131-134) | 124 (123-125) | 130 (129-131) | 131 (130-132) | 130 (129-131) | 127 (126-127) | 133 (132-134) | 132 (130-134) | 131 (128-133) |
| DBP, mmHg | 79 (79-80) | 80 (80-81) | 81 (81-82) | 81 (80-82) | 75 (74-76) | 76 (75-77) | 80 (79-81) | 79 (79-80) | 80 (79-80) | 80 (79-80) | 80 (79-82) | 79 (78-80) |
| Diagnosed HBP, % | 44 (42-47) | 31 (29-33) | 27 (24-29) | 25 (21-29) | 30 (27-33) | 30 (27-33) | 35 (32-38) | 19 (17-22) | 31 (29-33) | 27 (25-29) | 23 (18-28) | 29 (26-33) |
| Real HBP, % | 64 (61-66) | 50 (47-52) | 46 (42-49) | 46 (42-51) | 42 (39-45) | 43 (40-45) | 47 (44-50) | 44 (41-46) | 41 (39-43) | 45 (43-48) | 44 (38-50) | 47 (42-51) |
| Women, n | 1739 | 2661 | 865 | 502 | 863 | 1158 | 1037 | 1238 | 3009 | 2097 | 293 | 15 462 |
| Glucose level, mg/dL | 102 (101-103) | 100 (98-101) | 99 (97-101) | 96 (94-99) | 91 (89-93) | 101 (100-103) | 96 (95-97) | 96 (94-97) | 94 (93-94) | 97 (96-98) | 97 (94-101) | 97 (95-99) |
| IFG, % | 7 (5-8) | 6 (5-8) | 8 (6-9) | 5 (3-7) | 4 (2-5) | 9 (7-11) | 6 (5-8) | 6 (5-8) | 4 (4-5) | 6 (5-7) | 3 (1-5) | 6 (5-7) |
| Diagnosed DM, % | 16 (14-18) | 13 (12-15) | 10 (8-12) | 11 (8-14) | 11 (9-13) | 10 (9-12) | 6 (5-7) | 5 (4-6) | 8 (7-9) | 7 (6-8) | 8 (5-10) | 10 (8-11) |
| Real DM, % | 18 (16-20) | 14 (13-16) | 11 (9-12) | 11 (8-13) | 13 (11-15) | 13 (11-15) | 7 (5-8) | 7 (6-8) | 10 (9-11) | 8 (7-10) | 10 (7-13) | 11 (9-13) |
| SBP, mmHg | 133 (132-133) | 123 (122-124) | 126 (125-127) | 121 (119-122) | 118 (117-119) | 119 (118-120) | 121 (120-122) | 127 (126-128) | 120 (120-121) | 123 (123-124) | 126 (124-129) | 122 (121-126) |
| DBP, mmHg | 78 (77-78) | 76 (76-76) | 79 (78-79) | 74 (73-75) | 71 (70-72) | 71 (71-72) | 74 (74-75) | 77 (77-78) | 76 (76-76) | 76 (76-77) | 78 (77-79) | 75 (74-77) |
| Diagnosed HBP, % | 45 (42-47) | 32 (30-34) | 25 (23-28) | 27 (23-30) | 29 (27-32) | 28 (26-30) | 33 (30-36) | 22 (20-24) | 27 (25-28) | 22 (20-24) | 25 (21-30) | 29 (25-33) |
| Real HBP, % | 57 (55-60) | 42 (40-44) | 39 (36-41) | 36 (32-40) | 35 (33-38) | 34 (32-36) | 38 (35-41) | 39 (36-41) | 32 (31-34) | 32 (30-34) | 40 (34-45) | 39 (34-43) |
DBP, diastolic blood pressure; DM, diabetes mellitus; HBP, high blood pressure; IFG; impaired fasting glucose, baseline glucose level in participants without diagnosed DM 100-125mg/dL; Real DM, diagnosed DM + glucose level ≥126 mg/dL; Real HBP, diagnosed HBP + SBP/DBP ≥140/90 mmHg; SBP, systolic blood pressure.
Values are expressed as mean (95% confidence interval).

Figure 1. Death from ischemic heart disease, standardized for the European population by autonomous community, and standardized ratio of prevalence (mean percentage deviation with 95% confidence interval of percentage deviations) for tobacco use of ≥1 cigarettes/day, systolic blood pressure ≥140 mmHg or diastolic blood pressure ≥90 mmHg, total cholesterol ≥250mg/dL and ≥190mg/dL, body mass index ≥30, baseline glucose level ≥126mg/dL. The component studies compare each risk factor with global prevalence in the DARIOS study (100% indicated by the vertical line) in rank order of population-wide cardiovascular mortality. At the foot of each factor appears mean prevalence of the corresponding factor for the 2 age groups (35-74 years and 45-74 years). BMI, body mass index; Cig, cigarette; CV, coefficient of variation; DBP, diastolic blood pressure; IHD, ischemic heart disease; SBP, systolic blood pressure.
Prevalence of obesity, overweight, high waist circumference, and tobacco use is shown in Table 3. The ARTPER, CDC, DRECA-2 and HERMEX studies presented significantly greater prevalence of obesity than the mean in men and women (Figure 1). Tobacco use presented little variability between studies, particularly in men. Even so, men in the ARTPER, CORSAIB and HERMEX studies and women in the DRECA-2, HERMEX, PREDIMERC, and RIVANA studies were significantly more often smokers than the mean (Table 3 and Figure 1).
Table 3. Body Mass Index, Waist Circumference, and Prevalence of Obesity and Tobacco Use Standardized to the European Population by Component Study and General Study in Men and Women Aged 35-74 Years.
| ARTPER(45-74 years) | CDC | CORSAIB | DINO | DRECA-2 | HERMEX | PREDIMERC | RECCyL | REGICOR | RIVANA | TALAVERA | General | |
| Men (n) | 1493 | 2054 | 804 | 443 | 736 | 1046 | 966 | 1198 | 2685 | 1765 | 235 | 13 425 |
| BMI | 29 (28-29) | 28 (28-28) | 28 (27-28) | 28 (28-28) | 29 (28-29) | 29 (29-30) | 28 (28-28) | 28 (28-28) | 28 (27-28) | 28 (27-28) | 28 (28-29) | 28 (28-28) |
| BMI 25-29.9, % | 49 (46-52) | 48 (45-50) | 48 (45-52) | 56 (51-61) | 50 (46-53) | 47 (44-50) | 52 (49-55) | 50 (47-53) | 53 (51-55) | 55 (52-57) | 50 (43-57) | 51 (49-52) |
| BMI ≥30, % | 34 (32-37) | 32 (29-34) | 25 (22-28) | 27 (23-31) | 34 (31-37) | 38 (35-41) | 26 (23-29) | 26 (23-29) | 23 (22-25) | 22 (20-24) | 30 (24-37) | 29 (26-32) |
| WC | 101 (100-102) | 98 (98-99) | 97 (96-98) | 100 (99-101) | 101 (100-102) | 101 (100-101) | 96 (95-96) | 96 (96-97) | 96 (95-97) | 98 (97-98) | 100 (98-102) | 99 (97-100) |
| WC>102cm, % | 42 (40-45) | 34 (31-36) | 29 (26-32) | 39 (34-43) | 42 (38-45) | 39 (36-42) | 25 (22-28) | 27 (24-29) | 27 (24-30) | 30 (28-32) | 39 (33-46) | 34 (30-38) |
| Smoker, % | 33 (30-36) | 31 (29-33) | 39 (35-42) | 33 (28-37) | 32 (29-36) | 39 (36-42) | 29 (26-32) | 34 (31-37) | 33 (31-35) | 35 (32-37) | 29 (22-35) | 33 (32-35) |
| Non-smoker, % | 22 (19-24) | 34 (31-36) | 21 (19-24) | 50 (45-54) | 34 (31-37) | 28 (25-30) | 33 (30-36) | 32 (29-34) | 30 (28-31) | 38 (36-40) | 31 (25-38) | 32 (28-36) |
| Ex-smoker, % | 45 (43-48) | 35 (33-38) | 40 (36-43) | 17 (14-22) a | 34 (30-37) | 33 (31-36) | 38 (35-41) | 34 (32-37) | 37 (36-39) | 27 (25-29) | 40 (34-47) | 36 (33-40) |
| Women (n) | 1739 | 2661 | 865 | 502 | 863 | 1158 | 1037 | 1238 | 3009 | 2097 | 293 | 15 462 |
| BMI | 29 (29-30) | 29 (28-29) | 27 (27-28) | 28 (28-28) | 29 (28-29) | 28 (28-29) | 27 (27-27) | 27 (27-28) | 27 (26-27) | 26 (26-26) | 28 (27-29) | 28 (27-28) |
| BMI 25-29.9, % | 41 (39-44) | 38 (36-40) | 33 (30-36) | 41 (37-46) | 37 (34-40) | 35 (32-38) | 37 (34-40) | 35 (32-38) | 33 (31-35) | 33 (31-35) | 41 (35-47) | 36 (34-38) |
| BMI ≥30, % | 40 (37-42) | 36 (33-38) | 27 (25-30) | 30 (26-34) | 35 (32-38) | 35 (32-37) | 23 (21-26) | 28 (25-30) | 22 (21-24) | 20 (18-22) | 28 (22-33) | 29 (25-34) |
| WC | 95 (94-95) | 91 (90-91) | 87 (86-87) | 91 (90-91) | 96 (95-96) | 96 (95-96) | 83 (83-84) | 91 (91-92) | 88 (87-89) | 88 (87-88) | 94 (93-96) | 91 (88-93) |
| WC>88 cm | 68 (65-70) | 56 (54-58) | 41 (38-44) | 56 (52-60) | 68 (65-71) | 66 (64-69) | 29 (27-32) | 56 (53-58) | 43 (40-46) | 42 (40-44) | 62 (56-67) | 53 (46-61) |
| Smoker, % | 11 (10-13) | 18 (17-19) | 20 (18-23) | 21 (18-25) | 26 (23-29) | 26 (24-29) | 25 (22-27) | 20 (18-23) | 19 (18-21) | 24 (22-26) | 20 (15-25) | 21 (18-24) |
| Non-smoker, % | 80 (78-82) | 72 (70-74) | 66 (63-69) | 74 (71-78) | 63 (60-66) | 59 (56-61) | 54 (51-57) | 64 (62-67) | 66 (64-67) | 60 (58-62) | 66 (60-71) | 66 (61-70) |
| Ex-smoker, % | 9 (7-10) | 10 (9-11) | 14 (12-16) | 5 (3-6) a | 11 (9-13) | 15 (13-17) | 21 (18-23) | 15 (13-18) | 15 (13-16) | 16 (15-18) | 15 (10-19) | 14 (12-16) |
BMI, body mass index; WC, waist circumference.
Values are expressed as mean (95% confidence interval).
a Ex-smoker for>6 months.
Analysis of concordance of lipid measurements showed limits of concordance of the 95%, coefficient of determination R2, and intraclass correlation coefficient between±14 and±33; 0.82 and 0.97, and 0.91 and 0.98, respectively, for total cholesterol, between±5 and±8; 0.84 and 0.94, and 0.92 and 0.97 for HDLc, and between±10 and±25; 0.94 and 0.99, and 0.97 and 0.99 for triglycerides.
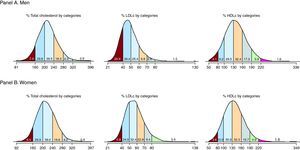
Prevalence of real dyslipidemia varied notably between total cholesterol or LDLc and the chosen cutoff point (Table 4). Figure 2 shows the distribution of total cholesterol and its fractions in men and women. Prevalence of dyslipidemia (total cholesterol ≥250mg/dL) was significantly greater than the mean in men in the HERMEX, PREDIMERC, and PREDIMERC studies, and in women in the DRECA-2, HERMEX, and TALAVERA studies (Figure 1). With the ≥190mg/dL total cholesterol cutoff, variability between studies fell considerably. Even so, men and women in the HERMEX, PREDIMERC, and RIVANA studies; men in the TALAVERA study, and women in the DINO study presented prevalences significantly greater than the mean for DARIOS.
Table 4. Lipid Profile and Prevalence of Dyslipidemia Standardized to the European Population by Component Study and General Study in Men and Women Aged 35-74 Years.
| ARTPER(45-74 years) | CDC | CORSAIB | DINO | DRECA-2 | HERMEX | PREDIMERC | RECCyL | REGICOR | RIVANA | TALAVERA | General | |
| Men, n | 1493 | 2054 | 804 | 443 | 736 | 1046 | 966 | 1198 | 2685 | 1765 | 235 | 13 425 |
| TC, mg/dL | 212 (210-214) | 211 (209-213) | 217 (214-219) | 215 (211-219) | 214 (212-217) | 226 (224-229) | 222 (220-225) | 207 (205-209) | 210 (208-211) | 217 (215-219) | 227 (222-233) | 216 (213-229) |
| HDLc, mg/dL | 50 (49-51) | 48 (47-48) | 47 (47-48) | 49 (48-50) | 50 (49-50) | 53 (52-53) | 46 (45-47) | 48 (48-49) | 47 (47-48) | 49 (49-50) | 52 (51-53) | 49 (48-50) |
| HDLc<40 mg/dL, % | 18 (16-20) | 23 (21-25) | 25 (22-28) | 19 (16-23) | 17 (15-20) | 10 (9-12) | 26 (23-29) | 20 (17-22) | 27 (25-29) | 18 (16-20) | 11 (7-16) | 20 (16-23) |
| LDLc, mg/dL | 136 (134-138) | 134 (132-136) | 139 (136-141) | 142 (138-145) | 134 (132-137) | 149 (146-151) | 150 (148-153) | 130 (128-132) | 138 (137-140) | 143 (141-145) | 151 (147-156) | 140 (137-144) |
| Triglycerides, mg/dL | 140 (135-145) | 152 (147-157) | 163 (155-170) | 140 (130-151) | 158 (151-166) | 133 (127-138) | 139 (133-144) | 150 (144-155) | 130 (126-133) | 132 (128-136) | 125 (115-136) | 142 (135-149) |
| Diagnosed DL, % | 59 (57-62) | 35 (33-37) | 25 (22-28) | 33 (28-38) | 34 (30-37) | 31 (28-34) | 36 (33-39) | 27 (24-29) | 34 (32-36) | 36 (34-38) | 39 (32-46) | 35 (30-41) |
| Real DL, % | ||||||||||||
| TC<190 mg/dL, % | 85 (83-87) | 75 (73-78) | 75 (72-78) | 81 (78-85) | 81 (78-84) | 88 (86-90) | 87 (84-89) | 73 (71-76) | 75 (73-77) | 81 (79-83) | 88 (84-93) | 81 (78-84) |
| TC<240 mg/dL, % | 64 (61-66) | 44 (41-46) | 40 (37-43) | 46 (41-51) | 48 (44-51) | 53 (50-56) | 50 (47-53) | 35 (32-38) | 42 (40-44) | 46 (43-48) | 53 (46-60) | 47 (42-52) |
| TC<250 mg/dL, % | 62 (59-64) | 41 (38-43) | 34 (31-38) | 41 (36-46) | 43 (40-47) | 46 (43-49) | 46 (42-49) | 33 (30-35) | 40 (38-42) | 42 (40-45) | 49 (42-56) | 43 (38-48) |
| LDLc<115 mg/dL, % | 84 (82-86) | 73 (71-75) | 73 (70-76) | 81 (77-84) | 78 (75-81) | 87 (84-89) | 86 (83-88) | 69 (66-71) | 73 (72-75) | 79 (77-81) | 88 (83-93) | 79 (75-83) |
| LDLc<160 mg/dL, % | 65 (62-67) | 44 (42-47) | 40 (37-44) | 50 (45-55) | 48 (44-51) | 55 (52-58) | 54 (51-57) | 36 (33-39) | 45 (43-47) | 49 (46-51) | 56 (49-63) | 49 (44-54) |
| Women, n | 1739 | 2661 | 865 | 502 | 863 | 1158 | 1037 | 1238 | 3009 | 2097 | 293 | 15 462 |
| TC, mg/dL | 222 (221-224) | 210 (209-212) | 215 (213-218) | 216 (213-219) | 216 (214-219) | 225 (223-227) | 225 (222-227) | 204 (202-206) | 209 (208-211) | 216 (215-218) | 219 (215-224) | 216 (212-220) |
| HDLc, mg/dL | 60 (59-61) | 54 (54-55) | 56 (55-57) | 59 (58-60) | 59 (58-59) | 60 (59-61) | 54 (54-55) | 56 (55-56) | 57 (56-57) | 59 (59-60) | 60 (59-62) | 58 (56-59) |
| HDLc<50 mg/dL, % | 25 (23-27) | 41 (39-43) | 31 (27-34) | 24 (20-28) | 24 (22-27) | 21 (19-23) | 39 (36-42) | 31 (28-33) | 32 (30-33) | 21 (20-23) | 19 (14-24) | 28 (24-32) |
| LDLc, mg/dL | 140 (138-141) | 132 (131-134) | 136 (134-139) | 137 (134-140) | 135 (133-137) | 145 (143-147) | 150 (147-152) | 126 (124-128) | 134 (132-135) | 138 (137-140) | 141 (137-145) | 138 (134-141) |
| Triglycerides, mg/dL | 118 (115-121) | 123 (120-126) | 117 (113-121) | 101 (97-106) | 117 (113-121) | 102 (99-105) | 108 (105-112) | 113 (110-115) | 98 (96-100) | 97 (94-99) | 94 (88-101) | 108 (102-114) |
| Diagnosed DL, % | 58 (55-60) | 39 (37-41) | 25 (22-27) | 31 (27-36) | 28 (25-31) | 29 (26-31) | 30 (28-33) | 24 (21-26) | 29 (27-31) | 30 (28-32) | 26 (21-31) | 32 (26-38) |
| Real DL, % | ||||||||||||
| TC<190 mg/dL, % | 89 (87-90) | 75 (74-77) | 76 (73-79) | 83 (79-86) | 78 (76-81) | 86 (84-88) | 84 (82-86) | 70 (68-73) | 71 (69-72) | 79 (77-80) | 82 (77-87) | 79 (75-83) |
| TC<240 mg/dL, % | 65 (62-67) | 45 (43-47) | 36 (33-39) | 43 (38-47) | 42 (39-45) | 49 (46-52) | 47 (44-50) | 32 (29-34) | 38 (36-40) | 42 (40-44) | 43 (38-49) | 44 (38-49) |
| TC<250 mg/dL, % | 62 (60-64) | 43 (41-45) | 32 (29-35) | 39 (34-43) | 38 (35-42) | 43 (41-46) | 42 (39-45) | 28 (25-30) | 35 (34-37) | 37 (35-39) | 37 (32-43) | 40 (34-45) |
| LDLc<115 mg/dL, % | 85 (83-87) | 72 (70-74) | 71 (68-74) | 78 (75-82) | 73 (70-76) | 84 (82-86) | 82 (80-84) | 66 (63-68) | 67 (65-69) | 76 (74-77) | 79 (74-84) | 76 (71-80) |
| LDLc<160 mg/dL, % | 64 (62-66) | 45 (43-47) | 35 (32-38) | 43 (39-48) | 42 (38-45) | 49 (46-51) | 49 (46-52) | 31 (29-34) | 39 (37-41) | 42 (40-44) | 41 (35-47) | 44 (38-49) |
DL, dyslipidemia; HDLc, high density lipoprotein cholesterol; LDLc, low density lipoprotein cholesterol; Real DL, diagnosed DL + TC or LDLc above the limit indicated or HDLc below the value indicated; TC, total cholesterol.
Values are expressed as mean (95% confidence interval).

Figure 2. Population-wide distribution of total cholesterol, high density lipoprotein cholesterol and low density lipoprotein cholesterolin the population aged 35-74 years in the DARIOS study. HDLc, high density lipoprotein cholesterol; LDLc, low density lipoprotein cholesterol.
Prevalence of cardiovascular risk factors in the population aged 35-74 years was similar in the component studies (coefficient of variation 7%-24% in men and 7%-26% in women) (Figure 1).
In women, prevalence of obesity and glucose level ≥126mg/dL correlated significantly with death from ischemic heart disease in the autonomous community where the study was conducted (correlation coefficient, 0.9, P<.001, and 0.82, P=.004 for obesity and glucose level ≥126mg/dL, respectively). In men, this correlation was significant for glucose level ≥126mg/dL (correlation coefficient, 0.7, P=.025), whereas obesity did not achieve statistical significance (correlation coefficient, 0.5).
DiscussionThe distribution of most cardiovascular risk factors presents<20% variability in the population aged 35-74 years in the Spanish autonomous communities. Our results put standardized prevalence of HBP at 43% and of dyslipidemia (total cholesterol ≥250mg/dL) at 41%. Finally,>25% of the population were smokers, 29% were obese, and 13% had diabetes. Over 75% of the population were far from the cutoff points of total cholesterol<190mg/dL or LDLc<115mg/dL proposed by the more demanding clinical practice guidelines.24 These data improve our understanding of risk factor prevalence in the current century. They add information obtained with a more rigorous methodology than that used previously.8,9 The low incidence of coronary disease and high life expectancy associated with being born into the Spanish population1 suggest that aspects of the underlying mechanisms of coronary disease development should be studied in greater depth.
We found no great differences between the autonomous communities in prevalence of diabetes mellitus, HBP, dyslipidemia, obesity, and tobacco use, with coefficients of variation ranging from 7% to 26%. Geographical variability in prevalence of tobacco use, diabetes mellitus, and dyslipidemia with total cholesterol>250mg/dL was similar to that reported in the ERICE study, conducted with data from the 1990's.8 Prevalence of total cholesterol>200mg/dL was significantly less variable in DARIOS than in ERICE (CV, 10% and 22%, P=.003), whereas prevalence of HBP (CV, 18% and 8%, P<.001) and obesity (CV, 19% and 13%, P=.021) was significantly more variable in DARIOS. The autonomous communities of the Canary Islands, Andalusia, and Extremadura stand out for the greater prevalence of obesity, diabetes mellitus, HBP, or dyslipidemia in both men and women. Moreover, they also present greater mortality for ischemic heart disease than the other communities in the component studies.
Differences in age range, method of standardization, and the absence of laboratory cross-validation makes it difficult to compare our results with those of other, similar studies.8,9 Despite this, our results indicate greater prevalence of obesity and diabetes mellitus in the first decade of the 21st century than that reported some decades ago.8,9 Both cardiovascular risk factors correlate with mortality from ischemic heart disease in the population aged 35-74 years in the autonomous communities, especially among women. The ecological nature of this relationship prevents us from making definitive conclusions about the consequences of this finding. Should they be confirmed, these results would indicate we need a more intensive approach to the prevention of obesity and diabetes mellitus in Spain. Cohort studies with long-term follow-up are needed to provide greater insight into the role of both of these cardiovascular risk factors in the development of ischemic heart disease.
In DARIOS, prevalence of HBP and nondiagnosed diabetes mellitus was lower than that observed previously.3 It has fallen from approximately 56% and 43% in the 1990's to 38% and 26% currently in hypertensive men and women, respectively; and from 28% and 21% to 19% and 10%, respectively, in men and women with diabetes. The screening for both illnesses, encouraged by the Spanish Society of Family and Community Medicine's Program of Preventative Activities and Health Promotion,26 together with the contract programs of several autonomous communities, may have played a key role in this.
In DARIOS, prevalence of diabetes mellitus, HBP, and dyslipidemia differed substantially from that obtained by the 2006 NHS6 (Table 5). This difference may be due to the fact that DARIOS obtained information via questionnaires, which was complemented by blood tests (lipids and glucose level) and measurements of blood pressure, weight, height, and waist circumference. Nonetheless, prevalence estimated exclusively from self-reported information (eg, tobacco use) was similar in both DARIOS and the NHS.7
Table 5. Comparison of Prevalence Stratified by Age Between DARIOS and the National Health Survey 2006 (NHS 2006).
| Smoker | High blood pressure | Dyslipidemia | Obesity | Type II diabetes mellitus | ||||||
| DARIOS | NHS 2006 | DARIOS | NHS 2006 | DARIOS * | NHS 2006 | DARIOS | NHS 2006 | DARIOS | NHS 2006 | |
| Men | ||||||||||
| 35-44 years | 40% | 41% | 24% | 10% | 32% | 14% | 22% | 15% | 5% | 1% |
| 45-54 years | 38% | 41% | 42% | 20% | 46% | 21% | 30% | 21% | 14% | 1% |
| 55-64 years | 29% | 31% | 61% | 38% | 49% | 29% | 33% | 21% | 23% | 6% |
| 65-74 years | 22% | 21% | 72% | 44% | 47% | 31% | 30% | 26% | 29% | 14% |
| Women | ||||||||||
| 35-44 years | 36% | 34% | 12% | 8% | 19% | 7% | 15% | 12% | 3% | 2% |
| 45-54 years | 26% | 31% | 31% | 18% | 37% | 17% | 26% | 16% | 8% | 4% |
| 55-64 years | 9% | 13% | 55% | 35% | 55% | 31% | 38% | 24% | 16% | 9% |
| 65-74 years | 3% | 5% | 72% | 56% | 59% | 37% | 44% | 29% | 24% | 16% |
* Total cholesterol ≥250mg/dL.
The DARIOS study includes 11 studies with population-based random samples conducted in the first decade of the 21st century. Despite the fact that not all of Spain is covered in the study, the sample appears to be representative of approximately 70% of the Spanish population aged 35-74 years. Furthermore, the response rate was generally good (73%); in only 3 studies (representing 21% of participants) was it<70%. We do not believe the use of healthcare ID cards in 6 of the 11 studies constitutes a selection bias, as>98% of the population uses public health services, according to the NHS.7
All the component studies followed a standard WHO method20 and took measurements with calibrated apparatus. Moreover, we performed an analysis of concordance of lipid profile results using a reference laboratory to correct the few deviations observed. Lipid values prior to standardization and adaptation can be consulted in individual study reports.3,10,11,12,13,14,15,16,17,18,19 Prevalence of HBP based on 2 blood pressure measurements presented differences if it was calculated from the mean of both or if only the lower of the two measurements was used. In order to minimize the “white-coat” effect,31 we chose the lower of the 2 blood pressure measurements.
ConclusionsIn the Spanish population aged 35-74 years, standardized prevalence of HBP and dyslipidemia was>40%; for obesity and tobacco use, 27%; and for diabetes, 13% in the first decade of the 21st century. Variability between autonomous communities in prevalence of cardiovascular risk factors was relatively low, although differences between those areas with the most extreme levels of prevalence were considerable. The Canary Islands, Extremadura, and Andalusia had a greater accumulation of significantly more prevalent factors than the mean for the 11 component studies.
FUNDINGThis study was financed in its entirety with unconditional support from AstraZeneca.
Data from the original component studies was obtained with financial support from: FEDER, Ministerio de Ciencia e Innovación, Instituto de Salud Carlos III (Red HERACLES RD06/0009; Fondos para investigación. Acuerdo del Consejo Interterritorial de 8 de abril de 2003; EMER07/046 RCESP C3/09); Fondo de Investigación Sanitaria (FIS-FEDER) (PI01/0711, PI02/1158, PI02/1179, PI02/1717, PI03/20471, PI05/2364, PI05/2751, PI07/040, PI07/0934, PI07/1213, G03-045, FIS-ETES 2007, CP06/00100, CM08/00141); Ministerio de Sanidad y Consumo, Plan Nacional I+D+i 2004-7 (IP071218); Agència de Avaluació de Tecnologia i Recerca Mèdica (034/33/02); Agència de Gestió d’Ajuts Universitaris i de Recerca (2005SGR00577); Departament de Salut de la Generalitat de Catalunya; Fundación Canaria de Investigación y Salud (45/98); Departamento de Salud del Gobierno de Navarra; Junta de Castilla y León; Beca Intensificación de la investigación (INT 07/289); Subdirección General de Promoción de la salud y Prevención. Consejería de Sanidad de la Comunidad de Madrid; Govern Balear; Servicio Andaluz de Salud; Programa de Iniciativa Comunitaria INTERREG IIIA (SP5.E51); Consejería de Salud de la Junta de Andalucía, Ayuda a Proyectos de Investigación (290/04 y 036/06); Sociedad Andaluza de Medicina Familiar y Comunitaria (SAMFYC 2008); Sociedad Española de Medicina de Familia y Comunitaria (semFYC 2009); Consejería de Sanidad y Consumo de la Región de Murcia; Consejería de Salud y Bienestar Social, Junta de Comunidades de Castilla-La Mancha.
Conflicts of interestNone declared.
Acknowledgements
The authors wish to thank Susanna Tello, Marta Cabañero and Leny Franco for their contribution to the data management of this project.
☆ A full list of the DARIOS study researchers is available from: http://www.regicor.org/darios_inv.
Received 21 June 2010
Accepted 4 November 2010
Corresponding author: Grupo de Epidemiología y Genética Cardiovascular, Programa de Investigación en Procesos Inflamatorios y Cardiovasculares, Instituto Municipal de Investigación Médica, Dr. Aiguader 88, 08003 Barcelona, Spain. jmarrugat@imim.es