Neuron-specific enolase (NSE) is a prognostic marker in out-of-hospital cardiopulmonary arrest (OHCA) survivors treated with mild therapeutic hypothermia (MTH). The objectives were to analyze the correlation between dynamic changes in NSE and outcomes and to determine the measurement timing that best predicts neurological status.
MethodsMulticenter cohort study including patients admitted after shockable rhythm OHCA and treated with MTH. Serum NSE was sampled at 2 different times and Δ-NSE (%) was calculated as 100 x (NSE2-NSE1)/NSE1. In-hospital mortality and neurological outcome, as assessed by the Cerebral Performance Category (CPC) scale, were evaluated during admission and after a 6-month follow-up.
ResultsWe included 166 patients admitted to 4 hospitals. In-hospital mortality was 31.9%. Almost 60% of patients had a good neurological recovery (CPC 1-2). On univariate and multivariate logistic regression analyses, an increase in NSE levels was associated with higher in-hospital mortality and worse CPC on discharge and after 6-months (P<.001). Positive Δ-NSE showed an OR=9.28 (95% CI 4.40-19.57) for mortality, OR=11.23 (95% CI 5.24-24.11) for CPC 3-5 at discharge and OR=11.14 (95% CI 5.05-24.55) for CPC 3-5 after 6-months’ follow-up (P<.001). The first NSE measurement, conducted at 18 to 24hours, and the second measurement at 69 to 77hours after OHCA showed a high area under the curve in predicting CPC at discharge (0.9389 and 0.9909, respectively; 0.8096 for the whole cohort).
ConclusionsDynamic changes in NSE serum levels are good markers of hard clinical outcomes after an OHCA due to shockable rhythm in an MTH-treated cohort. NSE measurements at specific intervals after OHCA may predict events even more precisely.
Keywords
Neurological injury is the main cause of death in out-of-hospital cardiopulmonary arrest (OHCA) initial survivors.1 Mild therapeutic hypothermia (MTH) is widely used in an attempt to improve neurological function and survival in shockable rhythm OHCA survivors, despite the existing controversy about targeted temperature management.2,3
Several markers of poor neurological prognosis such as clinical examination, electroencephalography and somatosensory evoked potentials have been proposed for the first days after OHCA.4,5
Some of these diagnostic tools are not always available and the results might be affected by sedatives. Thus, biomarkers play a complementary role in neurological prognosis assessment. Neuron-specific enolase (NSE), the isoform of enolase produced in neuronal and neuroendocrine tissues, is the best studied of these biomarkers.6 In comatose OHCA survivors, NSE is a marker of hypoxic brain damage.
In patients not treated with MTH, NSE serum concentration measurements 24 to 48 hours after OHCA predicted in-hospital mortality7 and mortality or persistent unconsciousness at 1 month with a cutoff value of 33 ng/mL.8,9 These results were supported by a meta-analysis10 showing the usefulness of NSE in predicting neurological outcome.
In the MTH era, with an initial period of sedation and/or neuromuscular blockade when neurological assessment is particularly difficult, NSE evaluation can be even more useful.
Since absolute cutoff values to predict neurological prognosis are controversial, several studies have assessed the predictive capacity of NSE kinetics with promising results.11–16 However, there are few studies considering shockable rhythm OHCA only.14 Other studies have focused on the capacity of serial NSE measurements to predict mortality.17 Little is known about the timing of NSE measurement that best predicts outcomes.
The aims of the study were 2-fold: to establish the correlation between changes in NSE serum levels and neurological outcomes on discharge and after 6 months of follow-up in a cohort of shockable rhythm OHCA survivors treated with MTH for persistent unconsciousness, and to determine the measurement timing that best predicts outcome on discharge.
METHODSStudy populationThis multicenter cohort prospective study was conducted in the area of Barcelona (Spain). We included consecutive patients (≥ 16 years) admitted from May 2011 to January 2017 to the intensive cardiac care unit of 4 referral hospitals after an OHCA with shockable rhythm who completed the MTH protocol and who had at least 2 serum NSE measurements during hospitalization. The patients were treated according to the current practice of each hospital and NSE measurement timing was at the discretion of the treating physician. Data for 6 months’ follow-up after hospital discharge were obtained using electronic medical record systems.
The study was approved by the Vall d’Hebron Hospital Research Ethics Committee.
Mild therapeutic hypothermia protocolAfter assessment of persistent unconsciousness, the initial cooling phase was achieved by cold saline solution infusion. When patients were admitted to the cardiac care unit, an intravascular cooling system (CoolGard Thermal Regulation System, Alsius Corporation, Irvine, USA) or a cooling system with cutaneous pads (Arctic Sun Temperature Management System, Medivance, Louisville, USA) were used with a target temperature of 33°C. The protocol for all participating hospitals included hypothermia at 33°C for a 24-hour period, with controlled progressive rewarming at a rate of 0.25°C/h until ≥ 36.5°C.
Neuron-specific enolase measurementsSerum NSE measurements were performed on fresh blood samples using a Liaison XL chemiluminescence test (DiaSorin, Saluggia, Italy). The normality threshold was 18 ng/mL. The variable Δ-NSE was defined as the percentage change in NSE from the first to the second value and was calculated as 100 x (NSE2-NSE1) / NSE1 (%). Δ-NSE was also considered in the analysis as a binary variable: Δ-NSE ≤ 0 (invariable or decreasing NSE) and Δ-NSE >0 (increasing NSE).
VariablesThe following variables were collected: demographics, cardiovascular risk factors, time from OHCA to initiation of life support (cardiopulmonary resuscitation), time from OHCA to return of spontaneous circulation, time from OHCA to initiation of MTH, arterial blood pH and lactate (mmol/L) on arrival, time from OHCA to the first NSE sampling, time from OHCA to the second NSE sampling, and time from the first to the second NSE measurements.
OutcomesIn-hospital mortality and its causes (neurologic, cardiac or multifactorial) were analyzed. Neurological function was assessed by the Cerebral Performance Category (CPC) scale,18 which classifies patients in 5 different categories, from CPC 1 (no or mild disability) to CPC 5 (brain death). In-hospital CPC scale evaluation was conducted by the consultant neurologist who was unaware of NSE values. The time of evaluation was at discharge or before death, and also after 6 months of follow-up using health electronic records.
Neuron-specific enolase sampling distribution and best measurement timingWe carried out an exploratory analysis of NSE sampling distribution over time. To assess the timing of NSE measurements that could more accurately predict outcomes, we selected different measurement periods according to the median of NSE1 and NSE2 sampling distributions. We established that every tested interval had to include a minimal number of 20 patients. For OHCA-NSE1 timing, we tested 6 hour-width intervals; and for OHCA-NSE2 timing, due to wider interquartile range (IQR), we tested 8 hour-width intervals.
Statistical analysisQuantitative variables are expressed as median and IQR. For our analysis, CPC was considered a binary variable: patients with CPC 1 or 2 were considered as having a good neurological outcome and patients with CPC 3-5 as having a poor neurological outcome. We performed a binary logistic regression analysis with poor or good clinical outcome as the dependent variable and Δ-NSE as the independent variable; diabetes mellitus (dichotomous variable), age, pH and lactate were considered as potential variables to be included in a predictive model (backward stepwise selection, P<.05 for inclusion and P ≥ .10 for exclusion).
To assess the timing of serial NSE determinations that best predicted outcomes, we created receiver operating characteristic curves of Δ-NSE and compared the areas-under-curve (AUC) of different periods of OHCA to NSE1 and of OHCA to NSE2 with the AUC in the global cohort.
Data analysis was performed with Stata/IC 14.2 (StataCorp LP).
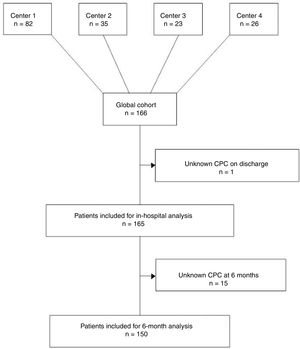
RESULTSThe cohort consisted of 166 patients. In 1 patient, CPC on discharge was unknown because the patient needed prolonged sedation and invasive mechanical ventilation due to flail chest and he was transferred to his country in this condition before CPC assessment could be performed. Thus, 165 patients were finally available for analysis. CPC at 6 months was missing in 15 patients; thus, analysis could be completed in 150 of the 165 patients (Figure 1).

One additional patient had missing values for measurement timing, so 164 patients were available for this part of the analysis.
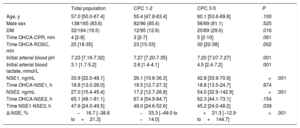
Baseline characteristicsBaseline characteristics are shown in Table 1. The median age of the cohort was 57.0 (range, 16-88 years). A total of 83.6% of patients were male and 19.5% had diabetes mellitus. Median time from OHCA to initiation of life support was 4 minutes, and was 25 minutes from OHCA to return of spontaneous circulation. Metabolic acidosis was prominent on arrival, with a median pH of 7.23; 13 patients (7.9%) had blood pH<7.0. Initial arterial blood lactate was high (> 2.0 mmol/L) in 67.3% of the patients; 19 patients (11.5%) had a lactate level above 8.0 mmol/L.
Comparison between low and high CPC patients at discharge
| Total population | CPC 1-2 | CPC 3-5 | P | |
|---|---|---|---|---|
| Age, y | 57.0 [50.0-67.4] | 55.4 [47.8-63.4] | 60.1 [53.6-69.8] | .100 |
| Male sex | 138/165 (83.6) | 82/96 (85.4) | 56/69 (81.1) | .525 |
| DM | 32/164 (19.5) | 12/95 (12.6) | 20/69 (29.0) | .016 |
| Time OHCA-CPR, min | 4 [2-8] | 3 [2-7] | 5 [2-10] | .061 |
| Time OHCA-ROSC, min | 25 [18-35] | 23 [15-33] | 30 [22-38] | .002 |
| Initial arterial blood pH | 7.23 [7.16-7.32] | 7.27 [7.20-7.35] | 7.20 [7.07-7.27] | .001 |
| Initial arterial blood lactate, mmol/L | 3.1 [1.7-5.2] | 2.6 [1.4-4.1] | 4.5 [2.4-7.2] | .001 |
| NSE1, ng/mL | 33.9 [22.0-48.1] | 26.1 [19.8-36.3] | 42.8 [33.9-70.9] | <.001 |
| Time OHCA-NSE1, h | 18.8 [13.0-26.0] | 18.5 [12.7-27.3] | 18.8 [13.5-24.7] | .874 |
| NSE2, ng/mL | 27.0 [15.4-45.4] | 17.2 [12.7-26.8] | 54.0 [32.9-142.9] | <.001 |
| Time OHCA-NSE2, h | 65.1 [48.1-81.1] | 67.4 [54.9-84.7] | 62.3 [44.1-73.1] | .154 |
| Time NSE1-NSE2, h | 47.6 [24.0-49.5] | 48.0 [24.6-52.6] | 45.2 [24.0-48.2] | .039 |
| Δ-NSE, % | −16.7 [−38.8 to+21.3] | −33.3 [−49.0 to −14.0] | +21.3 [−12.9 to+144.7] | <.001 |
CPC, Cerebral Performance Category scale; CPR, cardiopulmonary resuscitation; DM, diabetes mellitus; IQR, interquartile range; NSE, neuron-specific enolase; NSE1, first neuron-specific enolase measurement; NSE2, second neuron-specific enolase measurement; OHCA, out-of-hospital cardiopulmonary arrest; ROSC, return of spontaneous circulation.
This table shows baseline characteristics, NSE serum levels and measurement intervals of the study global cohort, and also of the subgroups of patients with good and poor neurological outcome on discharge.
Δ-NSE (relative change in NSE)=100 x (NSE2-NSE1) / NSE1.
Data are expressed as No. (%) or median [interquartile range].
Patients with poor neurological status on discharge were more frequently diabetic, had longer time from OHCA to return of spontaneous circulation, lower pH and a higher lactate level on arrival (Table 1). In addition, advanced age and longer time from OHCA to initiation of life support showed a tendency to worse prognosis, but was not statistically significant.
Neuron-specific enolase levelsNSE1 was obtained at a median of 18.8 (IQR, 13.0-26.0) hours after OHCA and NSE2 was obtained at a median of 65.1 (IQR, 48.1-81.1) hours after OHCA. Median time between the 2 measurements was 47.6 (IQR, 24.0-49.5) hours. Box plots showing the distribution of OHCA-NSE1 and OHCA-NSE2 timings are depicted in Figure 1 of the supplementary data.
Median NSE1 was 33.9 ng/mL, while median NSE2 was 27.0 ng/mL. Δ-NSE had high variability, with a median value of−16.7% (IQR−38.8% to 21.3%). One-hundred-and-eight patients (65.5% of the cohort) had a negative Δ-NSE value (decreasing NSE levels), and 57 patients (34.6%) had a positive value (increasing levels). The median Δ-NSE in the group of Δ-NSE ≤ 0 was−34.7% (IQR,−49.6% to−17.6%). For Δ-NSE >0, the median value was 75.0% (IQR, 20.6%-204.1%).
OutcomesIn-hospital mortality was 31.9% (53 of 166 patients). The main cause of death was severe anoxic encephalopathy (44 cases; 83.0%); cardiac death occurred in only 2 patients (3.8%).
In the whole cohort, CPC distribution at discharge was: CPC 1 in 72 patients (43.6%), CPC 2 in 24 patients (14.6%), CPC 3 in 11 patients (6.7%), CPC 4 in 33 patients (20.0%), and CPC 5 in 25 patients (15.2%). More than half of the patients (96, 58.2%) had a good neurological recovery according to the CPC scale.
Of the overall cohort, 89 patients (59.3%) were alive and had good neurological status at 6 months (CPC 1 or 2). Among patients who survived after discharge, 88 out of 97 (90.7%) were neurologically recovered after 6 months.
Δ-NSE and outcomesBoth high NSE1 and NSE2, in absolute values, were significantly associated with mortality, CPC at discharge, and CPC at 6 months. For CPC at discharge, median NSE1 was 26.1 ng/mL for patients with CPC 1-2 and 42.8 ng/mL for those with CPC 3-5 (P<.001); median NSE2 was 17.2 ng/mL for CPC 1-2 and 54.0 ng/mL for CPC 3-5 (P<.001).
For patients with CPC 1-2 median Δ-NSE was−33.3% (IQR−49.0% to−14.0%) and for those with CPC 3-5 median Δ-NSE was+21.3% (IQR,−12.9% to+144.7%). Median Δ-NSE for patients who survived to discharge was−28.3% (IQR,−44.0% to−10.2%), and for those who died during admission, median Δ-NSE was+28.1% (IQR,−6.6% to+160.9%).
On univariate analysis, Δ-NSE was significantly associated with in-hospital all-cause mortality (OR, 1.013, 95% CI, 1.007-1.018; P<.001, for 1% increase), CPC 3-5 at discharge (OR, 1.017, 95% CI, 1.010-1.025; P<.001) and CPC 3-5 at 6 months (OR, 1.015, 95% CI, 1.008-1.023; P<.001). Thus, an increase in Δ-NSE was associated with poor neurological outcome, while a decrease was associated with good neurological outcome. Odd ratios are easier to interpret when Δ-NSE is considered as a binary variable (Δ-NSE >0 [increasing NSE] vs Δ-NSE ≤ 0 [invariable or decreasing NSE]): OR 9.28 (95% CI, 4.40-19.57) for in-hospital mortality, OR 11.24 (95% CI, 5.24-24.11) for CPC 3-5 at discharge and OR 11.14 (95% CI, 5.05-24.55) for CPC 3-5 at 6 months (Figure 2).
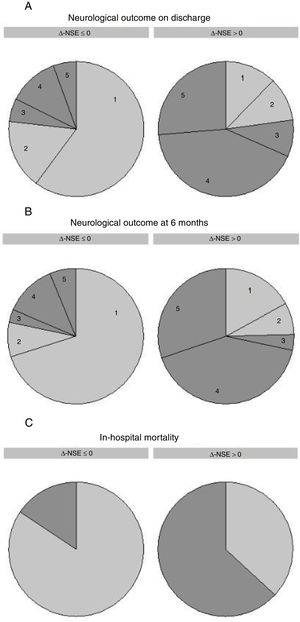
![Δ-NSE and outcomes. Neurological prognosis on discharge (A), neurological prognosis at 6 months (B) and in-hospital mortality (C) classified by relative change in NSE serum levels [Δ-NSE=100 x (NSE2-NSE1) / NSE1]. Δ-NSE ≤ 0 refers to invariable or decreasing levels, while Δ-NSE >0 refers to increasing NSE levels. Neurological prognosis was assessed by the CPC scale; numbers in the graphs correspond to CPC scale 1-5. Good neurological outcome is depicted in light gray (CPC 1 and 2) and poor neurological outcome is depicted in dark gray (CPC 3-5). CPC, Cerebral Performance Category; NSE, neuron-specific enolase; NSE1, first neuron-specific enolase measurement; NSE2, second neuron-specific enolase measurement.](https://static.elsevier.es/multimedia/18855857/0000007300000003/v1_202002210729/S1885585719300313/v1_202002210729/en/main.assets/gr2.jpeg?xkr=eyJpdiI6ImlRUDJFdzVmajd1dEQxdFdyZEt5cVE9PSIsInZhbHVlIjoiTWMyanB5bHN2RzA5VjJJNnlibXQreVRxTjg1c0x3SUo3cEJhK29iZERKbEtobXp6dGdleXNDRUNyaEFMM1UrK1FTU3BKZzRLaEVDRVNzZWlqTUZ2L2pwSzRqTGRmM1VpZFh2S0haWlQ4RDYrUzBKVkZsTDNzR3B4aWdpd3ErSlNFRlp6b1FBRlkxbWd1cEtJck9UdWF6by9mS2JqK2wwd0pyYTRBV2YvV1VTcHY4QXp1N3JSMjBLWTRsZDVScXdOR0dJRklFN3RySUdRNWxoclFNQml6bDZFaTVJYjNvMEhOd3BlQi8zdlhKNEhRZjZrQ2Qyc08vdzZEZTFhK1dMWTM1b3A1bVBHUUtkczFUNGNpVmxFYnRhbE1NMGVOdHZNdEVxQVN0RUowaTA9IiwibWFjIjoiZmEyZjQ0YjA5NzdlNTI5ODljMGIzZTQzZjc1MDAxOWRlYWVkZDQ5OTE4NTZjNWUwNzgzYjhkZTdmZGI5MWY0OSIsInRhZyI6IiJ9 "Δ-NSE and outcomes. Neurological prognosis on discharge (A), neurological prognosis at 6 months (B) and in-hospital mortality (C) classified by relative change in NSE serum levels [Δ-NSE=100 x (NSE2-NSE1) / NSE1]. Δ-NSE ≤ 0 refers to invariable or decreasing levels, while Δ-NSE >0 refers to increasing NSE levels. Neurological prognosis was assessed by the CPC scale; numbers in the graphs correspond to CPC scale 1-5. Good neurological outcome is depicted in light gray (CPC 1 and 2) and poor neurological outcome is depicted in dark gray (CPC 3-5). CPC, Cerebral Performance Category; NSE, neuron-specific enolase; NSE1, first neuron-specific enolase measurement; NSE2, second neuron-specific enolase measurement.")
Δ-NSE and outcomes. Neurological prognosis on discharge (A), neurological prognosis at 6 months (B) and in-hospital mortality (C) classified by relative change in NSE serum levels [Δ-NSE=100 x (NSE2-NSE1) / NSE1]. Δ-NSE ≤ 0 refers to invariable or decreasing levels, while Δ-NSE >0 refers to increasing NSE levels. Neurological prognosis was assessed by the CPC scale; numbers in the graphs correspond to CPC scale 1-5. Good neurological outcome is depicted in light gray (CPC 1 and 2) and poor neurological outcome is depicted in dark gray (CPC 3-5). CPC, Cerebral Performance Category; NSE, neuron-specific enolase; NSE1, first neuron-specific enolase measurement; NSE2, second neuron-specific enolase measurement.
Positive Δ-NSE had a sensitivity of 63.8% for predicting CPC 3-5 and negative Δ-NSE had a specificity of 86.5% for CPC 1-2; positive predictive value was 77.2% and negative predictive value was 76.9%. AUC for Δ-NSE was 0.8096 (95% CI, 0.7414-0.8779) for the whole cohort.
The final model for multivariate logistic regression analysis included age and arterial blood pH on arrival (Table 1 of the supplementary data). Δ-NSE persisted as a significant predictor of neurological prognosis at discharge: OR 1.016 (95% CI, 1.008-1.024), P<.001, for 1% increase. This was also true for Δ-NSE as a binary variable, as previously described: OR 11.58 (95% CI, 4.89-27.41), P<.001.
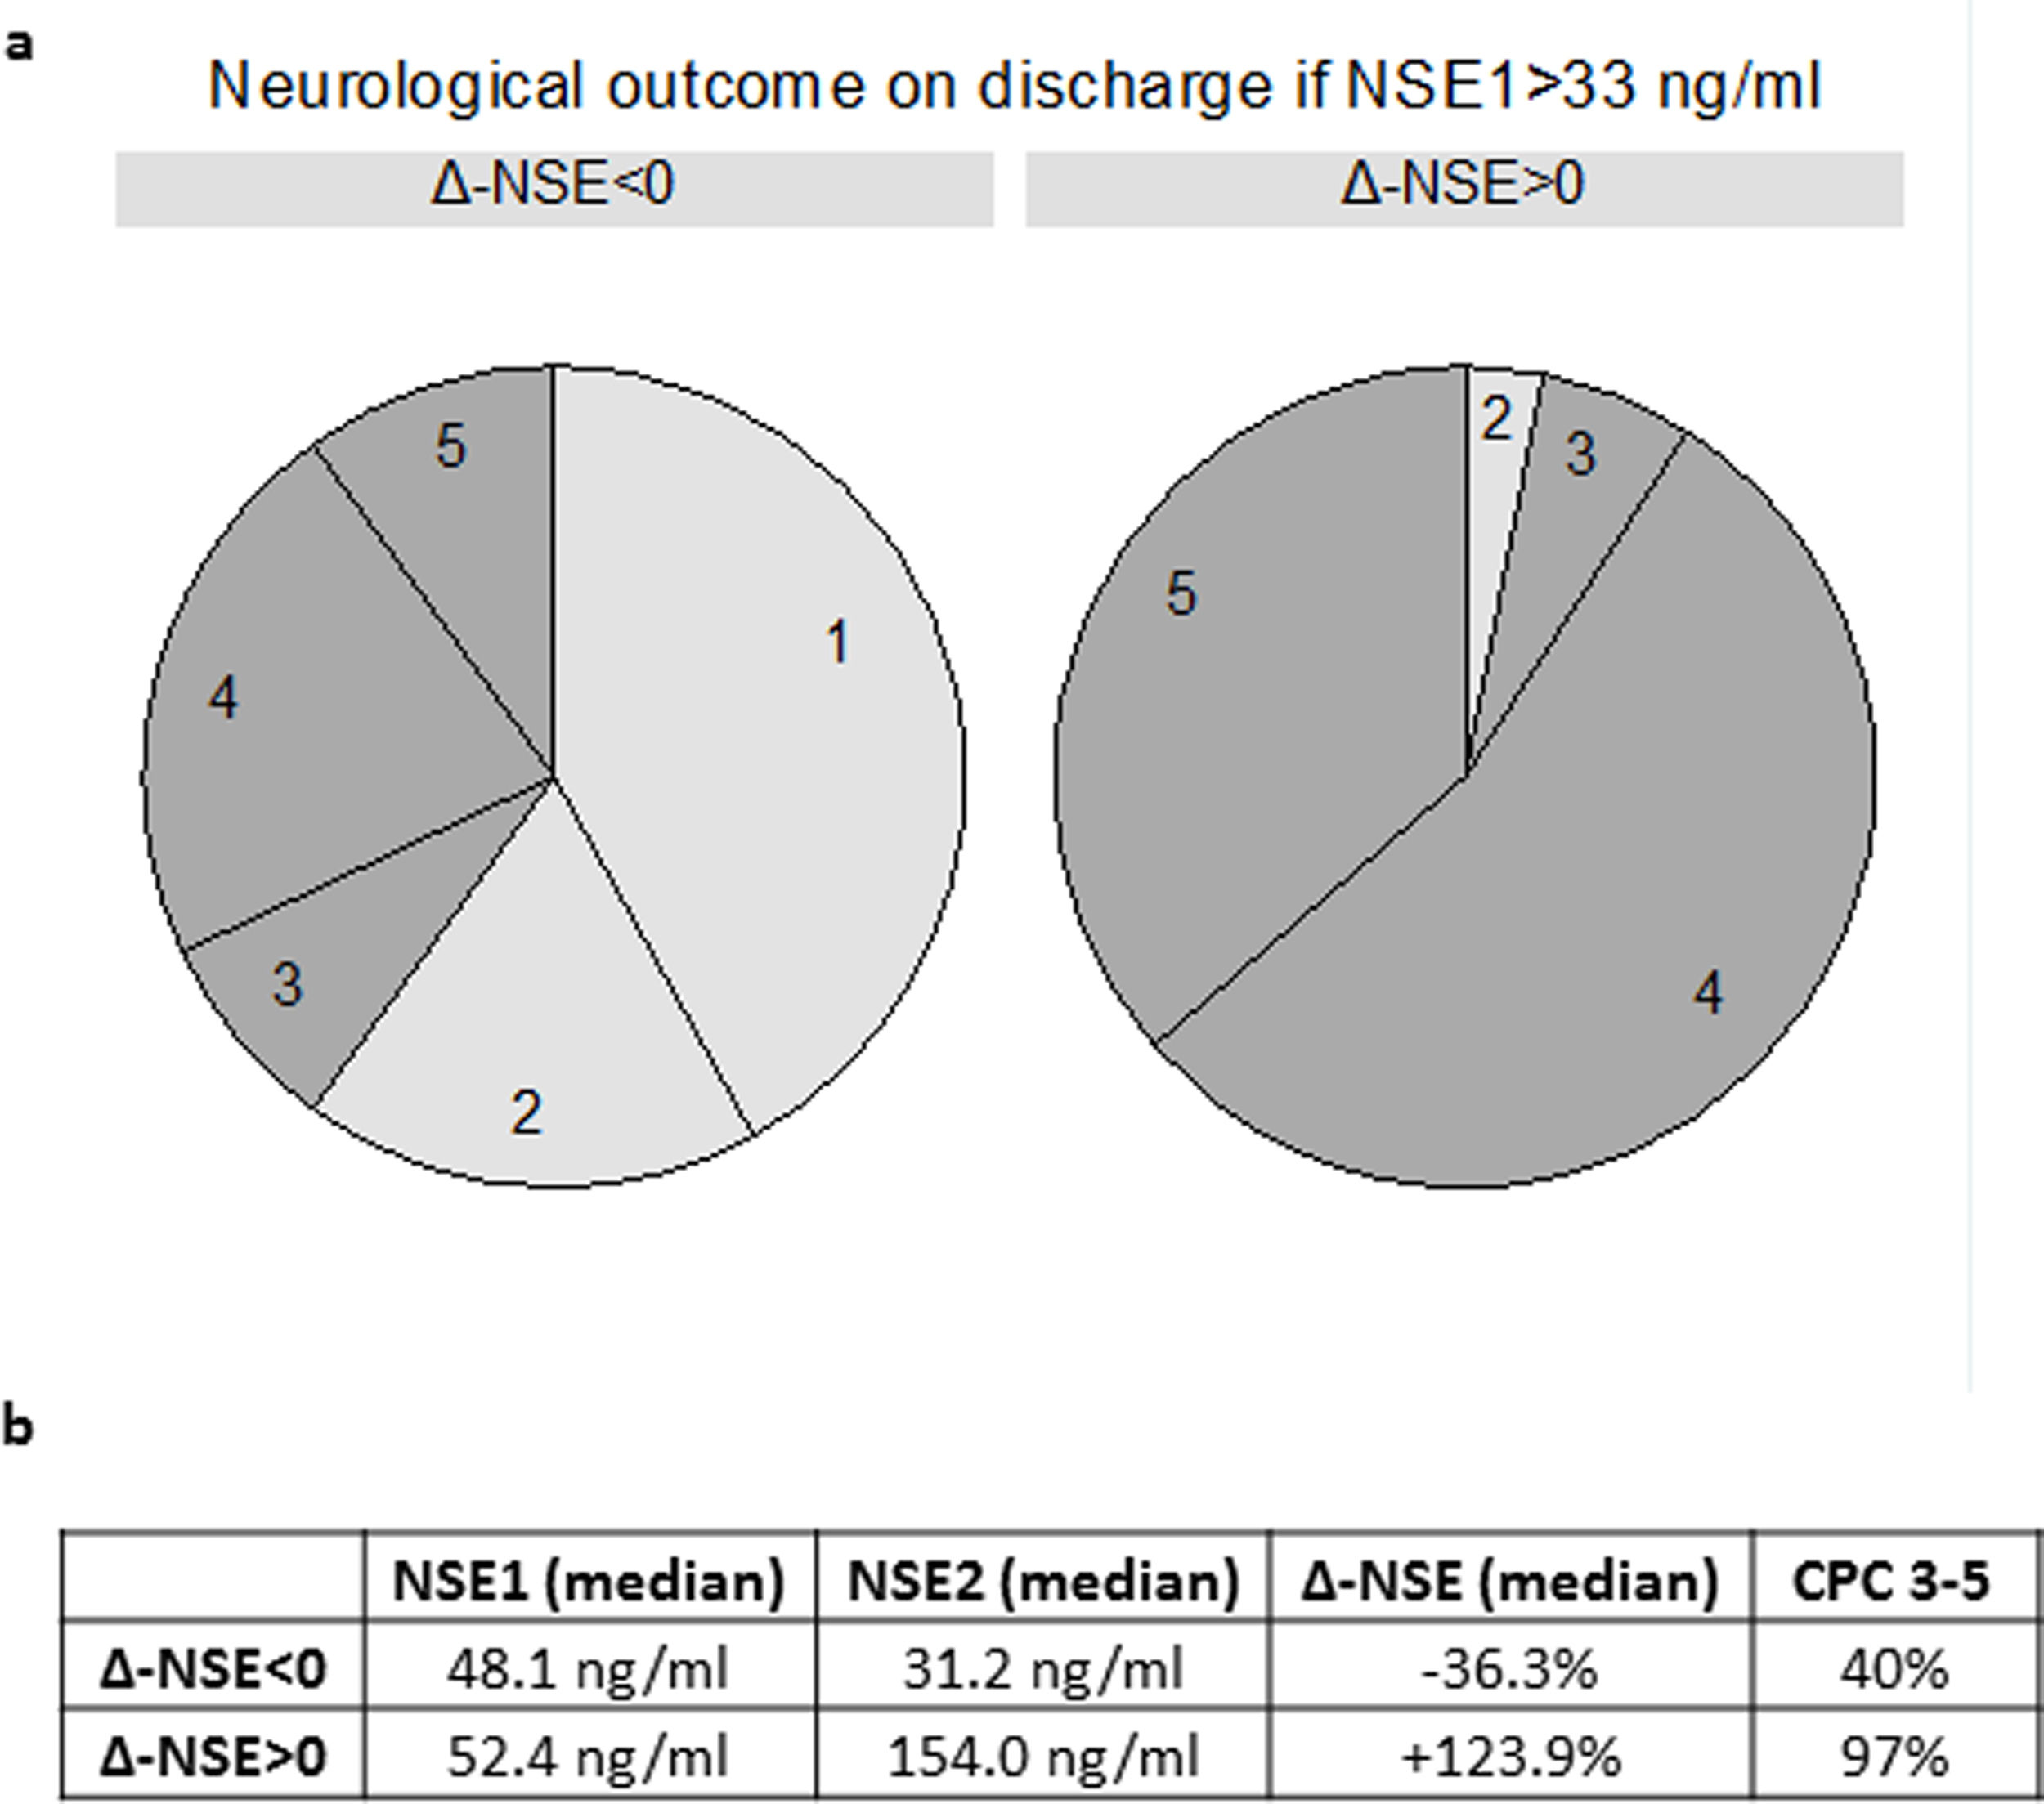
When we analyzed only patients with a high first NSE >33 ng/mL, increasing NSE was invariably associated with poor neurological prognosis (32 of 33 patients with CPC 3-5). On the other hand, 60.0% of patients with NSE1 >33 ng/mL and decreasing NSE had good prognosis (CPC 1-2) (Figure 2 of the supplementary data). Two extreme examples were 2 patients with a first NSE value of 79.3 ng/mL and 109.5 ng/mL, respectively, who were discharged with CPC 1 after experiencing a clear decrease in NSE (to 11.4 ng/mL and 33.2 ng/mL, respectively).
Compared with NSE2 as an absolute value, Δ-NSE could predict CPC at discharge in those patients with moderately elevated NSE2 (31 patients with NSE2 30-50 ng/mL), P=.0185. In this group of patients, NSE2 had no statistically significant predictive capacity (P=.2124).
Finally, we constructed a logistic regression model including Δ-NSE, age, diabetes, first blood pressure, first lactate and time from OHCA to return of spontaneous circulation, and we compared it with the same model without Δ-NSE. The AUC for the complete model was 0.8078, and AUC for the model without Δ-NSE was 0.7372, which was not statistically significantly lower (P=.2887).
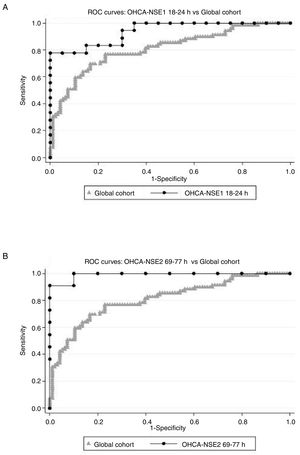
Times OHCA-NSE1 and NSE1 to NSE2The second objective of our study was to determine the sampling time intervals that best predicted CPC 3-5. Two groups of time intervals were considered: the interval from OHCA to the first NSE sampling, and the interval from the first to the second measurement. Comparing AUC of receiver operating characteristic-analysis, the best OHCA-NSE1 time interval appeared to be 18 to 24hours (AUC 0.9389, 95% CI, 0.8692-1.000, including 38 patients). The best OHCA-NSE2 time interval appeared to be 69 to 77hours (AUC 0.9910, 95%, CI 0.9657-1.000 with 21 patients). There was, however, remarkable overlap of CI in all assessed time intervals. AUC in both selected intervals were higher than AUC for the whole cohort (AUC 0.8096, 95% CI, 0.7414-0.8779) (Figure 3), and were even better than the AUC for absolute values (0.7640 for NSE1, 0.8986 for NSE2), although due to the small sample size in all intervals, the differences were not statistically significant. Table 2 of the supplementary data shows the tested intervals.
![ROC curves. Relative change in NSE serum levels [Δ-NSE=100 x (NSE2-NSE1) / NSE1], as a predictor of neurological outcome assessed by the CPC scale, considering good neurological outcome as CPC 1 or 2 and poor neurological outcome as CPC 3-5. Comparison of ROC curves of global cohort and 2 subgroups: (A) Δ-NSE with first NSE analysis conducted 18 to 24hours after OHCA and (B) Δ-NSE with second NSE analysis conducted 69 to 77hours after OHCA. Global cohort means Δ-NSE in the whole study population. CPC, Cerebral Performance Category; NSE, neuron-specific enolase; NSE1, first neuron-specific enolase measurement; NSE2, second neuron-specific enolase measurement; OHCA, out-of-hospital cardiopulmonary arrest; ROC, receiver operating characteristic.](https://static.elsevier.es/multimedia/18855857/0000007300000003/v1_202002210729/S1885585719300313/v1_202002210729/en/main.assets/gr3.jpeg?xkr=eyJpdiI6IlhQQ2h3ZktGbHBEd2FzYXI2c1k2elE9PSIsInZhbHVlIjoiYUF6Wmtxc09pUkozc2V2NnNFYXhJNDVjVmJ3bHRWQlJMQ0tzSkppb1RWeUlYVnlLOFNCOW9sMHV1RmIxUkI3ZFpGTzJDRUgwTE9nNmMwZU9sTTVVNkg5dERzMjllcjJMRzB4Qmswa202OG9hTUthTHdWZW5NeithM0hBUXpLVk11QVYrb3F5eUhnV2FjS0F6Rkt3SWtvbjBLMWZheitMTFJWdEZuS2o3OUorMWtDU3BiVks1WC90LzdDdG96TktMdTZwQmlrRW1WU2pjWVZhZTNqYmZKOVcrMlYwanFMSzJMTU1rR1k1dVhndG9XSkNHOGJYVmptVFZnWlRmNFE1U1JFQXBoZUMzek1DaU5zalkzNG5EQXp2OXNoblRKTUNaZnQyYmJQa00xeU09IiwibWFjIjoiODU0MmVhYWUzY2MzZTU3ZWJiZDg0ZTExYjZkMzQ0MDgxNDA5OTkzNDFlZDEwYzJiYjY5ZDQzZjA2MzhlYzZiNCIsInRhZyI6IiJ9 "ROC curves. Relative change in NSE serum levels [Δ-NSE=100 x (NSE2-NSE1) / NSE1], as a predictor of neurological outcome assessed by the CPC scale, considering good neurological outcome as CPC 1 or 2 and poor neurological outcome as CPC 3-5. Comparison of ROC curves of global cohort and 2 subgroups: (A) Δ-NSE with first NSE analysis conducted 18 to 24hours after OHCA and (B) Δ-NSE with second NSE analysis conducted 69 to 77hours after OHCA. Global cohort means Δ-NSE in the whole study population. CPC, Cerebral Performance Category; NSE, neuron-specific enolase; NSE1, first neuron-specific enolase measurement; NSE2, second neuron-specific enolase measurement; OHCA, out-of-hospital cardiopulmonary arrest; ROC, receiver operating characteristic.")
ROC curves. Relative change in NSE serum levels [Δ-NSE=100 x (NSE2-NSE1) / NSE1], as a predictor of neurological outcome assessed by the CPC scale, considering good neurological outcome as CPC 1 or 2 and poor neurological outcome as CPC 3-5. Comparison of ROC curves of global cohort and 2 subgroups: (A) Δ-NSE with first NSE analysis conducted 18 to 24hours after OHCA and (B) Δ-NSE with second NSE analysis conducted 69 to 77hours after OHCA. Global cohort means Δ-NSE in the whole study population. CPC, Cerebral Performance Category; NSE, neuron-specific enolase; NSE1, first neuron-specific enolase measurement; NSE2, second neuron-specific enolase measurement; OHCA, out-of-hospital cardiopulmonary arrest; ROC, receiver operating characteristic.
Our study adds important information on the clinical use of NSE in survivors of OHCA with shockable rhythm treated with MTH. Elevated absolute values of NSE1 and especially of NSE2 were strongly associated with poor prognosis, and Δ-NSE showed a prognostic value comparable to that of NSE2. Δ-NSE add useful prognostic information, compared with NSE2 alone, particularly in the subgroup of patients with moderately elevated NSE2. Therefore, Δ-NSE reclassifies 60% of patients with NSE1 >33 ng/mL and a lower but relatively high percentage (43%) of patients with NSE2<33 ng/mL. Furthermore, to our knowledge, this is one of the first studies to establish a recommendation on the most appropriate time interval to obtain blood samples for NSE analysis in this population.
Most of the MTH trials of NSE have focused on absolute values. Some studies have established a cutoff of 28 to 31 ng/mL at 48 hours11,19 or 72hours20 for poor neurological outcome at 6 months. In the TTM (Targeted Temperature Management) Trial, the cutoff values for poor neurological outcome at 6 months were higher: 35 ng/mL (24 hours), 61 ng/mL (48 hours) and 54 ng/mL (72 hours), with the best AUC being at 48hours and 72 hours.12 More recently, a cutoff of 19.4 ng/mL on day 4 was associated with poor neurological outcome at 30 days, with sensitivity and specificity both higher than 90%.21
Inconclusiveness about absolute cutoff values raises the issue of the importance of dynamic changes for outcomes prediction. Storm et al.13 observed that an increase of 33.1% between admission and 48 hour measurements had 100% specificity with 63% to 67% sensitivity for outcome at discharge. As previously mentioned, even small increases in NSE values (> 2 μg/L) between 24 and 48hours were strongly correlated with poor neurological outcome with an odds ratio of 9.8.11 Tiainen at al. showed that decreasing NSE levels were associated with regaining consciousness, neurological recovery, and survival.14 Zellner et al.15 also analyzed the kinetics of NSE in a cohort of 78 patients and reported 89% sensitivity and 85% specificity for neurological status at 6 months. A study published in 2014 demonstrated that changes in NSE between days 1 and 2 could be more reliable than absolute values in predicting 2-month neurological outcome, with a better AUC (0.86). Among patients with good neurological prognosis, there were some with very high absolute values in the first 24hours.16 Finally, a recently published study by Vondrakova et al.,21 analyzing absolute NSE levels and NSE relative changes, revealed that an NSE value higher than 20 ng/mL on day 4 together with an increase in NSE levels (> 0.0 ng/mL) from the third to fourth days predicted poor neurological outcome (73% sensitivity, 100% specificity). This is the reason why we considered any increase vs any decrease (Δ-NSE cutoff=0%) when treating Δ-NSE as a binary variable.
In the TTM Trial,12 a specific analysis concerning NSE dynamic changes was conducted. Patients with poor outcome had an increase in NSE values from a median of 34 to 35 ng/mL to a median of 60 to 66 ng/mL between 24 and 48 hours; and patients with good neurological prognosis showed a consistent decrease in NSE levels. A subsequent post hoc analysis22 showed that serial NSE measurements significantly increased global prognostic accuracy compared with a single analysis at 48hours in patients who remained unconscious at day 3 (AUC 0.88 vs 0.84).
Gillick and Rooney recently published a study that focused on the capacity of NSE kinetics to predict in-hospital mortality. Both NSE at 48 hours’ postadmission and Δ-NSE predicted the outcome with cutoffs of 69.8 ng/mL (NSE at 48 hours) and 9.4 ng/mL (Δ-NSE) for specificity=1.00.17
The specific role of NSE kinetics in shockable rhythm OHCA has not been well studied, as all the above-mentioned studies also included nonshockable rhythms in different proportions, except that reported by Tiainen et al.14 In that study, sensitivity was difficult to assess due to the small sample size. Our study, focused on this specific and more homogeneous population, demonstrated that NSE changes were independent predictors of mortality and neurological status on discharge and at 6 months.
In previous publications, NSE was measured at different times after admission, and changes were compared during the first days of hospitalization. The most widely studied period was from 24 to 48hours after admission; according to various studies, the NSE kinetics between these times was useful to predict outcomes.11,14–16 In other studies, the first sample was obtained on admission and compared with a second sample 48hours later13,17 with similar results. Stammet et al.12 demonstrated that a decrease in NSE at any period (24-48hours and 48-72 hours) was associated with good prognosis in the whole cohort (normothermia and hypothermia), while the increase to predict poor neurological outcome was significant in all groups and periods except 48 to 72hours for the normothermia group. Globally, the change in NSE had an AUC of 0.80 and 0.84 (33°C and 36°C subgroups, respectively) between 24 and 48 hours, but decreased to less than 0.70 from 48 to 72 hours. Last, in one of the most recent publications,21 the second NSE measurement was performed remarkably late (day 4 after OHCA) to obtain the best predictive NSE difference.
The introduction of less rigid measurement timing can be valuable, since, in clinical practice, NSE measurements are not always carried out exactly 24hours or 48hours after admission. For this reason, we considered that it could be useful to analyze the optimal intervals to perform the test. According to our results, the first NSE sample should be performed between 18 and 24hours after OHCA. On the other hand, the second analysis could be performed later than suggested by other studies: 69 to 77hours after OHCA (52-72hours after NSE1).
Although our study population was highly selected, our results are concordant with those of previously published studies and we consider that our findings, concerning the predictive capacity of Δ-NSE, could be applicable to all patients with an OHCA.
The main limitations of our study include a relatively small sample, although it is similar to those in previous publications, and a lack of predefined measurement timings. Consequently, there is noticeable heterogeneity in time intervals. Such heterogeneity reflects clinical practice but calls for a cautious interpretation of AUC in time subgroups. The observational findings should be prospectively validated in larger patient cohorts to definitively establish optimal intervals. We also admit the possibility of a selection bias that could exclude patients with more severe brain injury who die early without the chance of undergoing two NSE measurements. Finally, among patients whose death was attributed to anoxic encephalopathy, we do not which patients underwent limitation of therapeutic effort.
CONCLUSIONSIn patients treated with MTH after a shockable rhythm OHCA, dynamic changes in NSE can be a good predictor of in-hospital mortality and neurological status at discharge and after 6 months of follow-up. Measuring the first NSE 18 to 24 hours after OHCA, and the second NSE 69 to 77 hours after OHCA, appears to improve accuracy in determining prognosis.
CONFLICTS OF INTERESTAll the authors certify that they have no affiliations with or involvement in any organization or entity with any financial interest (such as honoraria; educational grants; participation in speakers’ bureaus; membership, employment, consultancies, stock ownership, or other equity interest; and expert testimony or patent-licensing arrangements), or nonfinancial interests (such as personal or professional relationships, affiliations, knowledge or beliefs) in the subject matter or materials discussed in this manuscript.
- –
Neurological prognosis assessment in out-of-hospital cardiopulmonary arrest survivors is challenging. NSE is a well studied biomarker that it is widely used in multimodality prognostication algorithms. Since there is no well established NSE cutoff level for poor neurological prognosis, some studies have tested dynamic changes in NSE levels compared with a single absolute value, with promising results. However, NSE changes have been barely been tested in the particular population of shockable rhythm OHCA survivors treated with a mild therapeutic hypothermia protocol. Another unresolved question is the timing of NSE measurement that best predicts outcomes.
- –
This is a multicenter study including a homogeneous population of shockable rhythm OHCA survivors treated with a mild therapeutic hypothermia protocol. In our series, an increase in NSE levels was associated, in simple and multivariate logistic regression analyses, with higher in-hospital mortality and worse neurological status at discharge and after 6 months. We also suggest a specific timing of NSE measurement: measuring the first NSE at 18 to 24hours after OHCA, and the second NSE at 69 to 77hours after OHCA appears to improve accuracy in determining prognosis.
We are greatly indebted to Dr. G. Permanyer-Miralda and Ms Mary O’Neill for their help. This work has been carried out in the setting of the Universitat Autònoma de Barcelona PhD Program in Medicine.
Supplementary data associated with this article can be found in the online version, at https://doi.org/10.1016/j.rec.2019.01.007.