Obstructive hypertrophic cardiomyopathy (oHCM), whose symptoms range from dyspnea to heart failure or sudden cardiac death, accounts for approximately 70% of all hypertrophic cardiomyopathy cases. This study aimed to analyze the lack of comprehensive data on oHCM management and determine its clinical and economic burden in Spain.
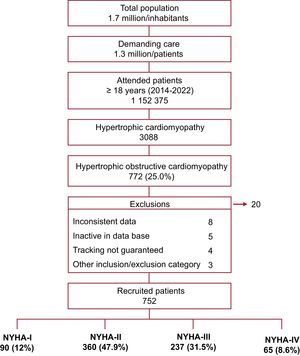
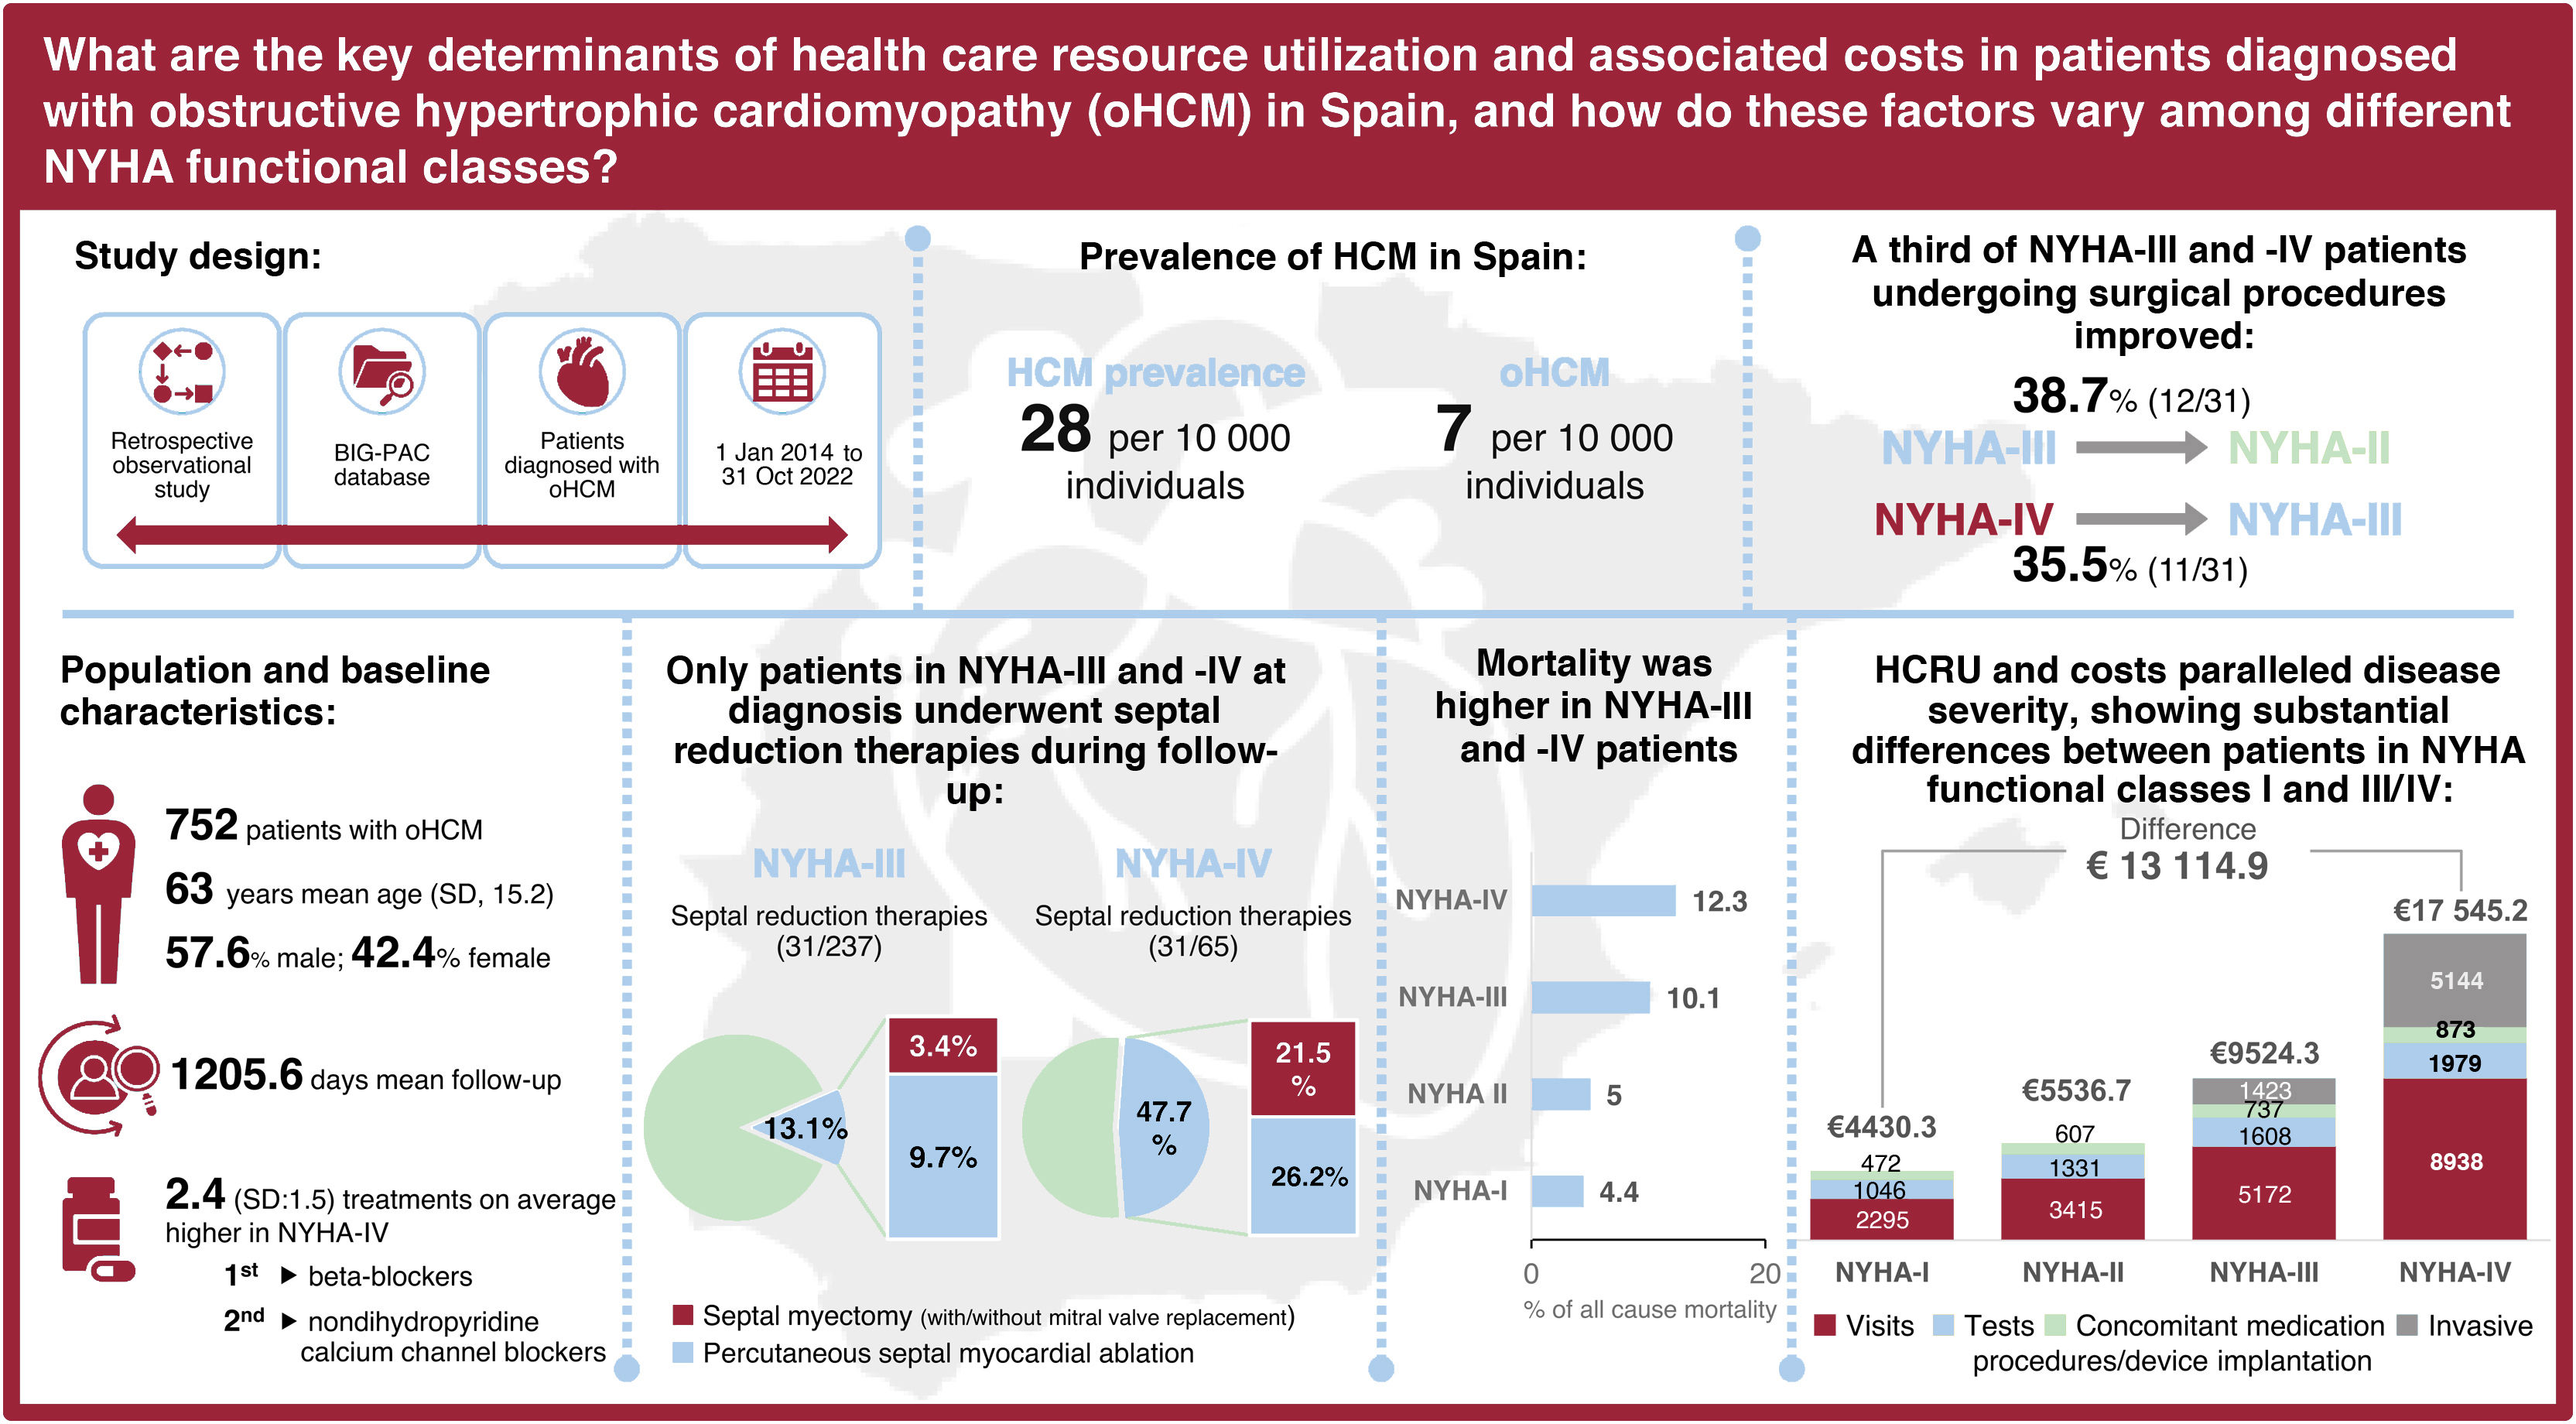
MethodsThis retrospective observational study, based on electronic medical records (BIG-PAC), enrolled adults from 1 January 2014, to 31 October 2022, from the time of HCM diagnosis. The analysis focused on epidemiology, patient characteristics and management, transitions between New York Heart Association (NYHA) functional classes, healthcare resource utilization (HCRU), and associated costs.
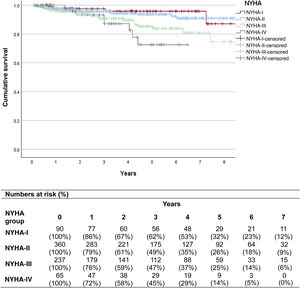
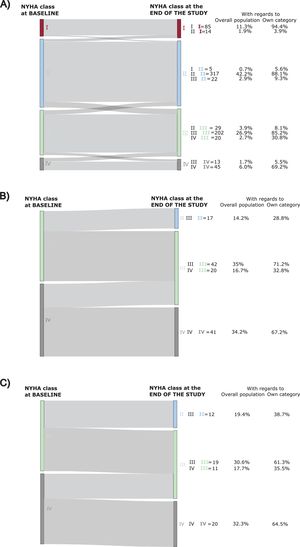
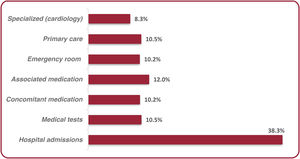
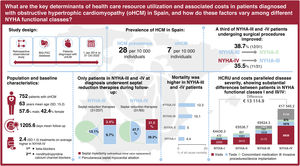
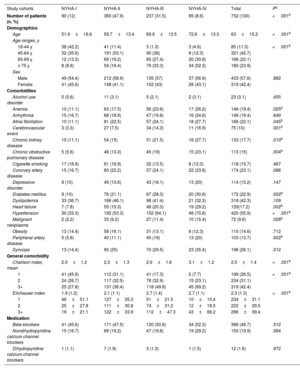
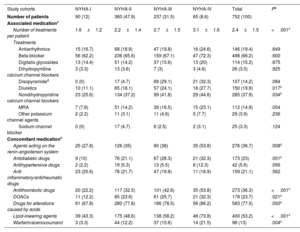
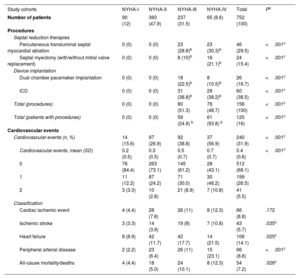
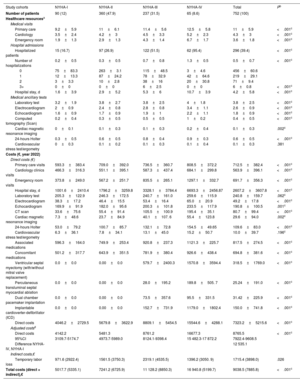
ResultsA total of 752 oHCM patients were included (mean age: 63 years; male: 57.6%). NYHA functional classification at diagnosis was as follows: 12% NYHA-I, 47.9% NYHA-II, 31.5% NYHA-III, and 8.6% NYHA-IV. The prevalence of HCM and oHCM was 28 and 7 per 10 000 individuals, respectively. Patients received a mean of 2.4 (SD 1.5) treatments, mainly beta-blockers. Only patients in NYHA classes III and IV underwent septal reduction therapies (SRT) (13.1% and 47.7%, respectively); 38.7% and 35.5% of NYHA-III and -IV patients who received SRT, respectively, improved to a lower NYHA class. Symptom severity, as measured by NYHA class, was associated with increased rates of hospitalization, cardiovascular events, mortality, and higher HCRU and costs. Mean annualized, direct, adjusted health care costs ranged from €4142 (95%CI: €3110-€5175) in NYHA-I to €16 677 (95%CI: €15 482-€17 872) in NYHA-IV.
ConclusionsThis is the first Spanish study to evaluate oHCM patient management and to demonstrate its impact in terms of increased hospitalizations, mortality, HCRU, and healthcare costs, trends that parallel the progression of symptoms by NYHA functional class. Patients who underwent SRT showed partial symptom improvement.
Keywords
Hypertrophic cardiomyopathy (HCM) is characterized by abnormal thickening of the myocardium in the absence of identifiable causes of hypertrophy and hypercontractility,1 and is often inherited.2
Obstructive HCM (oHCM) is defined by the presence of a left ventricular outflow tract gradient of ≥ 30 mm Hg, observed under basal conditions in up to one-third of HCM patients or under provocation in another one-third of patients.3,4 This condition leads to a range of physiological abnormalities beyond left ventricular outflow tract obstruction and diastolic dysfunction, including myocardial ischemia, mitral valve dysfunction, and arrhythmias.5 oHCM is also associated with a higher risk of heart failure, cardiovascular, and all-cause mortality compared with the general population.5,6 Patients aged <35 years have a higher risk of sudden cardiac death (SCD) and obstruction is an independent predictor of adverse outcomes.3,4
SCD risk assessment is essential to determine the need for primary prevention with an implantable cardioverter-defibrillator (ICD). Tools such as the HCM Risk-SCD score7,8 or individual clinical factors combined with shared decision-making9 are used for risk estimates. Common symptoms include dyspnea, chest pain, and syncope, which usually worsen with advancing age.3,4,7
Prevalence estimates of HCM vary among studies and countries. Reported global prevalence rates range from 2 to 23 cases per 10 000 people worldwide.10 A US study estimated a prevalence of 1.6 to 1.7 cases per 10 000 population.11 Higher annual prevalence rates have been reported in the UK and Germany (2.8 and 4.2 per 10 000, respectively).12 The proportion of oHCM is estimated to range from 22% to approximately 70% of total HCM cases.13,14 However, these figures may be underestimated due to suboptimal diagnostic practices.15,16
Diagnosis involves a comprehensive clinical evaluation confirmed with imaging techniques.3,4 Assessing the presence and severity of obstruction is essential to guide medical treatment and conduct individualized SCD risk stratification.4
The primary aim of oHCM treatment is to alleviate symptoms through pharmacological or interventional approaches. The 2023 European Society of Cardiology (ESC) and the 2024 American Heart Association (AHA)/American College of Cardiology (ACC) guidelines recommend nonvasodilating beta-blockers (BBs) as first-line therapy.7,9 When contraindicated or ineffective, nondihydropyridine calcium-channel blockers (CCBs) are advised as an alternative.7,9 In HCM patients not achieving adequate symptom control, the guidelines suggest escalating therapy to include disopyramide or mavacamten.7,9
Among patients with persistent, severe symptoms (New York Heart Association [NYHA] functional class III-IV), and ≥ 50 mmHg outflow obstruction despite maximally tolerated medical therapy—or in those with exertional or unexplained recurrent syncope unresponsive to maximally tolerated pharmacological treatments, the guidelines recommend considering septal reduction therapies (SRT).7,9 These include surgical septal myectomy (SM), a highly specialized procedure with a risk of complications,17 and, in selected patients, percutaneous alcohol septal ablation, which is the primary alternative to surgical myectomy.17–19 Both procedures should be performed in high-volume HCM centers as the risks of complications and mortality increase exponentially in lower-volume settings.3,20
Despite its significant prevalence and impact on patients’ quality of life, morbidity, and mortality, data on the clinical and economic burden of oHCM for health care systems in Spain are limited or lacking. This study aimed to investigate the patient characteristics, therapeutic trends, health care resource utilization (HCRU), and costs associated with oHCM in real-world settings, stratified by symptom burden according to NYHA functional class.21
METHODSStudy design and populationWe performed an observational, retrospective study assessing patients aged ≥ 18 years diagnosed with oHCM from January 2014 to October 31, 2022. Patients had a confirmed oHCM diagnosis (after systematically identifying “miocardiopatía,” “M. obstructiva,” “obstructiva,” and “obs” in the open field section of their electronic medical records [EMR]), maintained an active database presence for ≥ 12 months before the study commencement, and were enrolled in the chronic prescription program (with documented details of daily dosage, intervals, and treatment durations); had received ≥ 1 prescription during follow-up and underwent regular monitoring (with ≥ 2 health records logged in the system). Patients transferred to non-covered health areas and those who were permanently institutionalized were excluded. These patients were used to obtain all data except for prevalence, which was calculated using all patients, regardless of inclusion and exclusion criteria.
Patients were monitored from their date of diagnosis (index date) until the conclusion of the recruitment period. Data were sourced from their EMR within the BIG-PAC database (Atrys Health, Spain), which comprises data from public primary care centers and hospitals from 7 different health care areas in Spain. BIG-PAC is representative of the Spanish population based on common disease prevalences, biochemical parameters, and demographic indices; no adjustments for sex or age were performed.22
Outcomes were analyzed for the oHCM population and stratified into cohorts according to baseline NYHA functional class (I, II, III, and IV) determined based on the closest available record to the index date.
Study variablesBaseline characteristicsThe following data were recorded on the index date: demographic variables (age, sex, and body mass index [BMI]), as well as comorbidity prevalence (table 1 of the supplementary data), the Charlson Comorbidity Index (CCI) (table 2 of the supplementary data), Elixhauser Index (EI) (table 3 of the supplementary data), the medical specialty most frequently diagnosing oHCM, the interval between diagnosis and the termination of the follow-up period, and prescribed medications.
Prevalence of HCM and oHCMThe prevalence of HCM and oHCM was calculated by dividing the total number of living patients with either HCM or oHCM, as of December 31, 2022, by the total number of living patients in the BIG-PAC database on the same date.
oHCM patient management during follow-upPrescribed medications were documented. Relevant medications included disopyramide (classified into 2 groups: antiarrhythmics and sodium channel blockers), antiarrhythmics, digitalis glycosides, BBs, nondihydropyridine CCBs, dihydropyridine CCBs, sodium channel blockers, diuretics, aldosterone antagonists, and other potassium channel agents. Concomitant medications included antidiabetic, antithrombotic, antihypertensive, renin-angiotensin system agents, lipid-lowering drugs, anti-inflammatory and antirheumatic drugs, acid-altering agents, warfarin, acenocoumarol, and direct oral anticoagulants (DOACs) (table 4 of the supplementary data).
Additionally, SRT (percutaneous transluminal septal myocardial ablation [PTSMA], ventricular septal myectomy [with or without mitral valve replacement]) and device implantation procedures (implantable pacemakers and ICDs) were analyzed (table 5 of the supplementary data). Cardiovascular events (cardiac ischemic event, cerebrovascular ischemic event, peripheral arterial disease, heart failure, and death) were also collected (table 1 of the supplementary data). Since the code for a given event is always registered in the patient EMR following that event (eg, in association with medications), hospitalization-linked codes were used to identify individual events.
Changes in NYHA categoriesTransitions between NYHA categories from baseline to the end of the study were examined in terms of the proportion of patients who changed or remained in their respective NYHA categories, considering individual cohorts and the overall population. An additional analysis of these transitions was performed specifically among patients who underwent SRT or medical device implantation.
HCRU and costsMean annual HCRU and costs were assessed from the index date to the end of the follow-up period: medical visits (primary care, cardiology, and emergency room [ER] visits), hospital admissions (hospitalized patients, hospitalizations, and inpatient days), and medical tests (laboratory tests, electrocardiograms, echocardiograms, computed tomography, magnetic resonance imaging, Holter monitoring, and stress tests or ergometry).
Mean annual costs were calculated based on prescription prices (sourced from BIG-PAC), using unit costs at the time of prescription (table 6 of the supplementary data). Costs were estimated by considering the frequency of resource use, unit cost, and hospitalization costs based on diagnosis-related groups in Spanish hospitals with available cost date).23 Historical rates were adjusted using the health care Consumer Price Index (CPI)24 to ensure accuracy and relevance. All costs were standardized to 2022 euros by applying inflation rates obtained from the National Institute of Statistics (INE),25 representing the average cost per patient (mean/unit). Hospitalization costs were derived from the most recent diagnosis-related group costs for oHCM, including the mean length of hospital stays and procedures associated with oHCM conducted in Spanish hospitals.
The universal cost per patient related to SRT or device implantation in the Spanish system is not gathered in any public repository. Thus, the cost of ventricular SM was obtained from an internal communication from Hospital de Cruces, and the remaining procedures (PTSMA, dual chamber pacemaker implantation, and ICD) were approximated using the most similar procedures/device implantations found in the eSalud database (adjusted to 2023 prices)26: the cost of PTSMA was paralleled to “Ablación (cardiología hemodinámica”),27 dual chamber pacemaker implantation, to “Marcapasos bicameral DDD (Departament de Salut)”,28 and ICD to “161 - Implantación de desfibrilador cardíaco (severidad menor)”.29 These were calculated by multiplying the unit cost by the proportion of patients who underwent SRT and annualizing these expenses. Since these were 2023 costs, we standardized them to 2022 using inflation data from the INE.25 In addition, we estimated productivity losses (indirect costs) by multiplying the number of days of work disability by the average salary in the Spanish population, as reported by the INE.30 Importantly, direct nonhealth care expenses, such as out-of-pocket costs, expenses covered by the patients or their families, or costs associated with informal or professional caregivers, were not included in the analysis.
Statistical methodsDescriptive univariate statistical analyses were used to estimate baseline characteristics, oHCM management, and HCRU and associated costs. Qualitative data are presented as absolute and relative frequencies (No. %) and quantitative variables as means±standard deviation (SD) for symmetric distributions, and medians and interquartile ranges (IQR [P25-P75; Q1–Q3]) for asymmetric distributions; 95% confidence intervals (95%CI) were calculated to estimate population parameters. HCRU and costs were annualized. To assess the significance between NYHA subgroups, analysis of variance (ANOVA) and chi-square tests were used. ANCOVA was performed to determine significance after adjustment for costs. Contrasts were based on pairwise comparisons between estimated marginal means, with adjustment by baseline age, sex, and CCI. A sampling simulation was conducted, with results based on 1000 bootstrap samples. The program SPSSWIN, v.25 (IBM, United States) was used.
RESULTSBaseline demographic and clinical characteristicsIn total, 752 patients met the inclusion criteria (figure 1) and were followed up for a mean of 1205.6±854.7 days (table 7 of the supplementary data). The mean age was 63±15.2 years and 57.6% were male (table 1). NYHA categorization at baseline revealed a distribution of 12.0% NYHA-I, 47.9% NYHA-II, 31.5% NYHA-III, and 8.6% NYHA-IV. Mean age increased among NYHA classes.
Baseline characteristics of patients with oHCM (on the index date)
| Study cohorts | NYHA-I | NYHA-II | NYHA-III | NYHA-IV | Total | Pa |
|---|---|---|---|---|---|---|
| Number of patients (n, %) | 90 (12) | 360 (47.9) | 237 (31.5) | 65 (8.6) | 752 (100) | <.001b |
| Demographics | ||||||
| Age | 51.9±16.6 | 59.7±13.4 | 69.6±13.5 | 72.6±13.3 | 63±15.2 | <.001b |
| Age ranges, y | ||||||
| 18-44 y | 38 (42.2) | 41 (11.4) | 3 (1.3) | 3 (4.6) | 85 (11.3) | <.001b |
| 45-64 y | 32 (35.6) | 191 (53.1) | 90 (38) | 8 (12.3) | 321 (42.7) | |
| 65-69 y | 12 (13.3) | 69 (19.2) | 65 (27.4) | 20 (30.8) | 166 (22.1) | |
| ≥ 75 y | 8 (8.9) | 59 (16.4) | 79 (33.3) | 34 (52.3) | 180 (23.9) | |
| Sex | ||||||
| Male | 49 (54.4) | 212 (58.9) | 135 (57) | 37 (56.9) | 433 (57.6) | .882 |
| Female | 41 (45.6) | 148 (41.1) | 102 (43) | 28 (43.1) | 319 (42.4) | |
| Comorbidities | ||||||
| Alcohol use disorder | 5 (5.6) | 11 (3.1) | 5 (2.1) | 2 (3.1) | 23 (3.1) | .455 |
| Anemia | 10 (11.1) | 63 (17.5) | 56 (23.6) | 17 (26.2) | 146 (19.4) | .025b |
| Arrhythmia | 15 (16.7) | 68 (18.9) | 47 (19.8) | 16 (24.6) | 146 (19.4) | .649 |
| Atrial fibrillation | 10 (11.1) | 81 (22.5) | 57 (24.1) | 18 (27.7) | 166 (22.1) | .045b |
| Cerebrovascular event | 3 (3.3) | 27 (7.5) | 34 (14.3) | 11 (16.9) | 75 (10) | .001b |
| Chronic kidney disease | 10 (11.1) | 54 (15) | 51 (21.5) | 18 (27.7) | 133 (17.7) | .010b |
| Chronic obstructive pulmonary disease | 5 (5.6) | 48 (13.3) | 45 (19) | 15 (23.1) | 113 (15) | .004b |
| Cigarette smoking | 17 (18.9) | 61 (16.9) | 32 (13.5) | 8 (12.3) | 118 (15.7) | .467 |
| Coronary artery disease | 15 (16.7) | 80 (22.2) | 57 (24.1) | 22 (33.8) | 174 (23.1) | .086 |
| Depressive disorder | 9 (10) | 49 (13.6) | 43 (18.1) | 13 (20) | 114 (15.2) | .147 |
| Diabetes mellitus | 9 (10) | 76 (21.1) | 67 (28.3) | 20 (30.8) | 172 (22.9) | .002b |
| Dyslipidemia | 33 (36.7) | 166 (46.1) | 98 (41.4) | 21 (32.3) | 318 (42.3) | .109 |
| Heart failure | 7 (7.8) | 55 (15.3) | 48 (20.3) | 19 (29.2) | 129(17.2) | .002b |
| Hypertension | 30 (33.3) | 192 (53.3) | 152 (64.1) | 46 (70.8) | 420 (55.9) | <.001b |
| Malignant neoplasms | 2 (2.2) | 33 (9.2) | 27 (11.4) | 10 (15.4) | 72 (9.6) | .028b |
| Obesity | 13 (14.4) | 58 (16.1) | 31 (13.1) | 8 (12.3) | 110 (14.6) | .712 |
| Peripheral artery disease | 5 (5.6) | 40 (11.1) | 45 (19) | 13 (20) | 103 (13.7) | .002b |
| Syncope | 13 (14.4) | 90 (25) | 70 (29.5) | 23 (35.4) | 196 (26.1) | .012 |
| General comorbidity | ||||||
| Charlson index, mean | 2.0±1.2 | 2.3±1.3 | 2.9±1.6 | 3.1±1.2 | 2.5±1.4 | <.001b |
| 1 | 41 (45.6) | 112 (31.1) | 41 (17.3) | 5 (7.7) | 199 (26.5) | <.001b |
| 2 | 24 (26.7) | 117 (32.5) | 78 (32.9) | 15 (23.1) | 234 (31.1) | |
| 3+ | 25 (27.8) | 131 (36.4) | 118 (49.8) | 45 (69.2) | 319 (42.4) | |
| Elixhauser index | 1.9 (1.2) | 2.1 (1.1) | 2.7 (1.4) | 2.7 (1.1) | 2.3 (1.3) | <.001b |
| 1 | 46±51.1 | 127±35.3 | 51±21.5 | 10±15.4 | 234±31.1 | |
| 2 | 25±27.8 | 111±30.8 | 74±31.2 | 12±18.5 | 222±29.5 | |
| 3+ | 19±21.1 | 122±33.9 | 112±47.3 | 43±66.2 | 296±39.4 | |
| Medication | ||||||
| Beta-blockers | 41 (45.6) | 171 (47.5) | 120 (50.6) | 34 (52.3) | 366 (48.7) | .512 |
| Nondihydropyridine calcium channel blockers | 15 (16.7) | 69 (19.2) | 47 (19.8) | 19 (29.2) | 150 (19.9) | .084 |
| Dihydropyridine calcium channel blockers | 1 (1.1) | 7 (1.9) | 3 (1.3) | 1 (1.5) | 12 (1.6) | .972 |
oHCM, obstructive hypertrophic cardiomyopathy, NYHA, New York Heart Association.
CCI and EI mean values were 2.5±1.4 and 2.3±1.3 for the overall population, respectively. Among NYHA categories, both CCI and EI mean values showed an increasing trend (P <.001 both). The most prevalent comorbidities among all NYHA categories included hypertension (n=420, 55.9%) and dyslipidemia (n=318, 42.3%) (table 1).
At baseline, BBs were the most frequently prescribed medication (48.7%), and cardiologists were the primary diagnostic specialists for oHCM (78.5%). Comprehensive patient baseline characteristics are described in table 1.
Prevalence of obstructive hypertrophic cardiomyopathy in SpainHCM point prevalence was calculated on December 31, 2022, by dividing HCM/oHCM patients by the total number of patients in the BIG-PAC database on that date. HCM point prevalence was 28/10 000 individuals, while the obstructive phenotype (oHCM) showed a prevalence of 7/10 000 population (table 8 of the supplementary data).
Medical management of oHCM patients during follow-upAssociated and concomitant medicationTable 2 contains information on medication. Patients were prescribed a mean of 2.4±1.5 medications. However, NYHA-IV patients received a mean of 3.1±1.6 medications. BBs were most frequently prescribed, followed by nondihydropyridine CCBs among all categories (66.2% and 37.9%, respectively). The third most common prescription differed among classes: antiarrhythmics for NYHA-I, and NYHA-II and disopyramide for NYHA-III and NYHA-IV.
Associated and concomitant medication during follow-up
| Study cohorts | NYHA-I | NYHA-II | NYHA-III | NYHA-IV | Total | Pa |
|---|---|---|---|---|---|---|
| Number of patients | 90 (12) | 360 (47.9) | 237 (31.5) | 65 (8.6) | 752 (100) | |
| Associated medicationb | ||||||
| Number of treatments per patient | 1.6±1.2 | 2.2±1.4 | 2.7±1.5 | 3.1±1.6 | 2.4±1.5 | <.001c |
| Treatments | ||||||
| Antiarrhythmics | 15 (16.7) | 68 (18.9) | 47 (19.8) | 16 (24.6) | 146 (19.4) | .649 |
| Beta-blocker | 56 (62.2) | 236 (65.6) | 159 (67.1) | 47 (72.3) | 498 (66.2) | .600 |
| Digitalis glycosides | 13 (14.4) | 51 (14.2) | 37 (15.6) | 13 (20) | 114 (15.2) | .675 |
| Dihydropyridine calcium channel blockers | 3 (3.3) | 13 (3.6) | 7 (3) | 3 (4.6) | 26 (3.5) | .925 |
| Disopyramided | 0 (0) | 17 (4.7) | 69 (29.1) | 21 (32.3) | 107 (14.2) | .084 |
| Diuretics | 10 (11.1) | 65 (18.1) | 57 (24.1) | 18 (27.7) | 150 (19.9) | .017c |
| Nondihydropyridine calcium channel blockers | 23 (25.6) | 134 (37.2) | 99 (41.8) | 29 (44.6) | 285 (37.9) | .034c |
| MRA | 7 (7.8) | 51 (14.2) | 39 (16.5) | 15 (23.1) | 112 (14.9) | .054 |
| Other potassium channel agents | 2 (2.2) | 11 (3.1) | 11 (4.6) | 5 (7.7) | 29 (3.9) | .236 |
| Sodium channel blocker | 0 (0) | 17 (4.7) | 6 (2.5) | 2 (3.1) | 25 (3.3) | .124 |
| Concomitant medicationb | ||||||
| Agents acting on the renin-angiotensin system | 25 (27.8) | 126 (35) | 90 (38) | 35 (53.8) | 276 (36.7) | .008c |
| Antidiabetic drugs | 9 (10) | 76 (21.1) | 67 (28.3) | 21 (32.3) | 173 (23) | .001c |
| Antihypertensive drugs | 2 (2.2) | 19 (5.3) | 13 (5.5) | 8 (12.3) | 42 (5.6) | .056 |
| Anti-inflammatory/antirheumatic drugs | 23 (25.6) | 78 (21.7) | 47 (19.8) | 11 (16.9) | 159 (21.1) | .562 |
| Antithrombotic drugs | 20 (22.2) | 117 (32.5) | 101 (42.6) | 35 (53.8) | 273 (36.3) | <.001c |
| DOACs | 11 (12.2) | 85 (23.6) | 61 (25.7) | 21 (32.3) | 178 (23.7) | .021c |
| Drugs for alterations caused by acids | 61 (67.8) | 280 (77.8) | 186 (78.5) | 56 (86.2) | 583 (77.5) | .050c |
| Lipid-lowering agents | 39 (43.3) | 175 (48.6) | 138 (58.2) | 48 (73.8) | 400 (53.2) | <.001c |
| Warfarin/acenocoumarol | 3 (3.3) | 44 (12.2) | 37 (15.6) | 14 (21.5) | 98 (13) | .004c |
DOACs, direct-acting oral anticoagulants; MRA, mineralocorticoid receptor antagonists; NYHA, New York Heart Association.
The most common concomitant medications included agents for acid-related disorders.
Septal reduction therapies, medical device implantation, and their outcomesOf the overall population, only 16% of patients underwent SRT or device implantation. Patients in NYHA-I and -II did not undergo any; 24.9% of NYHA-III and 93.8% of NYHA-IV patients received SRT or device implantation. In NYHA-III and NYHA-IV, the predominant procedure was ICD implantation (38.8% and 38.2%, respectively) followed by PTSMA (28.8% and 30.3%, respectively) (table 3).
Septal reduction therapies, device implantation, and cardiovascular events during follow-up
| Study cohorts | NYHA-I | NYHA-II | NYHA-III | NYHA-IV | Total | Pa |
|---|---|---|---|---|---|---|
| Number of patients | 90 (12) | 360 (47.9) | 237 (31.5) | 65 (8.6) | 752 (100) | |
| Procedures | ||||||
| Septal reduction therapies | ||||||
| Percutaneous transluminal septal myocardial ablation | 0 (0) | 0 (0) | 23 (28.8)b | 23 (30.3)b | 46 (29.5) | <.001c |
| Septal myectomy (with/without mitral valve replacement) | 0 (0) | 0 (0) | 8 (10)b | 16 (21.1)b | 24 (15.4) | <.001c |
| Device implantation | ||||||
| Dual chamber pacemaker implantation | 0 (0) | 0 (0) | 18 (22.5)b | 8 (10.5)b | 26 (16.7) | <.001c |
| ICD | 0 (0) | 0 (0) | 31 (38.8)b | 29 (38.2)b | 60 (38.5) | <.001c |
| Total (procedures) | 0 (0) | 0 (0) | 80 (51.3) | 76 (48.7) | 156 (100) | <.001c |
| Total (patients with procedures) | 0 (0) | 0 (0) | 59 (24.9) b | 61 (93.8) b | 120 (16) | <.001c |
| Cardiovascular events | ||||||
| Cardiovascular events (n, %) | 14 (15.6) | 97 (26.9) | 92 (38.8) | 37 (56.9) | 240 (31.9) | <.001c |
| Cardiovascular events, mean (SD) | 0.2 (0.5) | 0.3 (0.5) | 0.5 (0.7) | 0.7 (0.7) | 0.4 (0.6) | <.001c |
| 0 | 76 (84.4) | 263 (73.1) | 145 (61.2) | 28 (43.1) | 512 (68.1) | |
| 1 | 11 (12.2) | 87 (24.2) | 71 (30.0) | 30 (46.2) | 199 (26.5) | |
| 2 | 3 (3.3) | 10 (2.8) | 21 (8.9) | 7 (10.8) | 41 (5.5) | |
| Classification | ||||||
| Cardiac ischemic event | 4 (4.4) | 28 (7.8) | 26 (11) | 8 (12.3) | 66 (8.8) | .172 |
| Ischemic stroke | 3 (3.3) | 14 (3.9) | 19 (8) | 7 (10.8) | 43 (5.7) | .035c |
| Heart failure | 8 (8.9) | 42 (11.7) | 42 (17.7) | 14 (21.5) | 106 (14.1) | .025c |
| Peripheral arterial disease | 2 (2.2) | 23 (6.4) | 26 (11) | 15 (23.1) | 66 (8.8) | <.001c |
| All-cause mortality/deaths | 4 (4.4) | 18 (5.0) | 24 (10.1) | 8 (12.3) | 54 (7.2) | .026c |
ICD, implantable cardioverter-defibrillator; NYHA, New York Heart Association.
A total of 31.9% of patients experienced cardiovascular events. NYHA-I and -II patients had fewer events (15.6% and 26.9%, respectively) than those in NYHA-III and -IV (38.8% and 56.9%, respectively).
Heart failure events were the most common (14.1%). This trend was consistent in NYHA-I, -II and -III classifications, however, in NYHA-IV patients, peripheral arterial disease was slightly more frequent than heart failure (23.1% vs 21.5%) (table 3).
A total of 54 patients died during the follow-up period. Those in the NYHA-IV and III groups had the highest rates of mortality (12.3% and 10.1%, respectively) (table 3, figure 2).
Changes among NYHA categoriesInformation comparing the classification of patients at baseline with that at the end of the study showed that, when the entire population was examined, patients predominantly remained in their initial NYHA categories (figure 3). Among NYHA-II patients, the proportion whose baseline NYHA class deteriorated exceeded those who improved (8.1% vs 3.9%). Conversely, within the baseline NYHA-III group, more patients improved than worsened (9.3% vs 5.5%). In patients with a baseline NYHA-IV classification, 30.8% showed notable improvement.
Among the subgroup of patients who underwent SRT or device implantation, 28.8% of NYHA-III and 32.8% of NYHA-IV patients showed a 1-class improvement in their functional class during follow-up, with no patients achieving more than a 1-class improvement. This amelioration was more evident in patients who underwent SRT exclusively (38.7% and 35.5%).
HCRU and costs for oHCM patientsOn average, annually, patients predominantly attended primary care (11 visits), followed by cardiology clinics (4.3) and the ER (3.6); only NYHA-IV patients visited the ER more frequently than cardiology clinics (table 4). A total of 296 patients (39.4%) were hospitalized, mostly those in NYHA-IV (95.4%) and NYHA-III (51.5%) groups. The mean number of hospitalizations and length of hospital stay were 0.5±0.7 and 4.2±5.8 days, respectively, with NYHA-IV patients averaging more than double the admissions and length of stay. Regarding medical tests, laboratory tests were the most frequently conducted, followed by electrocardiograms and echocardiograms (table 4).
Resource utilization, and direct and indirect costsa
| Study cohorts | NYHA-I | NYHA-II | NYHA-III | NYHA-IV | Total | Pb |
|---|---|---|---|---|---|---|
| Number of patients | 90 (12) | 360 (47.9) | 237 (31.5) | 65 (8.6) | 752 (100) | |
| Healthcare resourcesa | ||||||
| Medical visits | ||||||
| Primary care | 9.2±5.9 | 11±6.1 | 11.4±5.6 | 12.5±5.8 | 11±5.9 | <.001c |
| Cardiology | 3.5±2.4 | 4.2±3 | 4.5±3.3 | 5.2±2.3 | 4.3±3 | <.001c |
| Emergency room | 1.9±1.3 | 2.9±1.3 | 4.3±1.4 | 6.7±1.7 | 3.6±1.8 | <.001c |
| Hospital admissions | ||||||
| Hospitalized patients | 15 (16.7) | 97 (26.9) | 122 (51.5) | 62 (95.4) | 296 (39.4) | <.001c |
| Number of hospitalizations | 0.2±0.5 | 0.3±0.5 | 0.7±0.8 | 1.3±0.5 | 0.5±0.7 | <.001c |
| 0 | 75±83.3 | 263±3.1 | 115±48.5 | 3±4.6 | 456±60.6 | |
| 1 | 12±13.3 | 87±24.2 | 78±32.9 | 42±64.6 | 219±29.1 | |
| 2 | 3±3.3 | 10±2.8 | 38±16 | 20±30.8 | 71±9.4 | |
| 3+ | 0±0 | 0±0 | 6±2.5 | 0±0 | 6±0.8 | <.001c |
| Hospital stay, d | 1.6±3.9 | 2.9±5.2 | 5.3±6 | 10.7±3.9 | 4.2±5.8 | <.001c |
| Medical ancillary tests | ||||||
| Laboratory test | 3.2±1.9 | 3.8±2.7 | 3.8±2.5 | 4±1.8 | 3.8±2.5 | <.001c |
| Electrocardiogram | 2±0.9 | 2.4±0.8 | 2.8±0.8 | 3.4±1.1 | 2.6±0.9 | <.001c |
| Echocardiogram | 1.6±0.9 | 1.7±0.9 | 1.9±1 | 2.2±1.1 | 1.8±0.9 | <.001c |
| Computed tomography (Scan) | 0.2±0.4 | 0.3±0.5 | 0.5±0.5 | 1±0.2 | 0.4±0.5 | <.001c |
| Cardiac magnetic resonance imaging | 0±0.1 | 0.1±0.3 | 0.1±0.3 | 0.2±0.4 | 0.1±0.3 | .002c |
| 24-hours Holter | 0.3±0.5 | 0.6±0.5 | 0.8±0.4 | 0.9±0.3 | 0.6±0.5 | <.001c |
| Cardiovascular stress test/ergometry | 0±0.3 | 0.1±0.2 | 0.1±0.3 | 0.1±0.4 | 0.1±0.3 | .381 |
| Costs (€, year 2022) | ||||||
| Direct costs (€) | ||||||
| Primary care visits | 593.3±383.4 | 709.0±392.0 | 736.5±360.7 | 808.5±372.2 | 712.5±382.4 | <.001c |
| Cardiology clinics visits | 466.3±316.3 | 551.1±395.1 | 587.3±437.4 | 684.1±299.8 | 563.9±396.1 | <.001c |
| Emergency room visits | 373.8±249.0 | 567.2±251.7 | 835.5±265.1 | 1297.1±332.7 | 691.7±356.3 | <.001c |
| Hospital stay, d | 1001.6±2410.4 | 1796.2±3259.8 | 3328.1±3784.4 | 6693.3±2456.87 | 2607.2±3607.8 | <.001c |
| Laboratory test | 205.3±122.9 | 246.3±172.5 | 240.7±161.0 | 259.6±115.9 | 240.8±159.7 | .062c |
| Electrocardiogram | 38.3±17.2 | 46.4±15.5 | 53.4±16.4 | 65.0±20.9 | 49.2±17.8 | <.001c |
| Echocardiogram | 169.9±91.9 | 182.0±95.6 | 200.3±101.8 | 233.5±117.9 | 190.8±100.5 | .001c |
| CT scan | 33.6±75.6 | 55.4±91.4 | 105.5±100.9 | 195.4±35.1 | 80.7±99.4 | <.001c |
| Cardiac magnetic resonance imaging | 7.3±48.6 | 23.7±84.9 | 40.1±107. 6 | 55.4±123.8 | 29.6±94.0 | .002c |
| 24-hours Holter | 53.0±79.2 | 100.7±85.7 | 132.1±72.8 | 154.5±49.65 | 109.6±83.0 | <.001c |
| Cardiovascular stress test/ergometry | 6.3±36.1 | 7.8±34.1 | 13.1±45.0 | 15.2±50.7 | 10.0±39.7 | .196c |
| Associated medications | 596.3±164.0 | 749.9±253.4 | 920.8±237.3 | 1121.3±225.7 | 817.5±274.5 | <.001c |
| Concomitant medications | 501.2±317.7 | 643.9±351.5 | 781.9±380.4 | 926.6±438.4 | 694.8±381.6 | <.001c |
| Ventricular septal myectomy (with/without mitral valve replacement) | 0.0±0.0 | 0.00±0.0 | 579.7±2400.3 | 1570.8±3594.4 | 318.5±1769.0 | <.001c |
| Percutaneous transluminal septal myocardial ablation | 0.0±0.0 | 0.00±0.0 | 28.0±195.2 | 189.8±505. 7 | 25.24±191.0 | <.001c |
| Dual chamber pacemaker implantation | 0.0±0.0 | 0.00±0.0 | 73.5±357.6 | 95.5±331.5 | 31.42±225.9 | <.001c |
| Implantable cardioverter-defibrillator (ICD) | 0.0±0.0 | 0.00±0.0 | 152.7±731.9 | 1179.0±1802.4 | 150.0±741.8 | <.001c |
| Direct costs | 4046.2±2729.5 | 5679.8±3622.9 | 8809.1±5454.5 | 15544.6±4288.1 | 7323.2±5215.6 | <.001c |
| Adjusted costsd | ||||||
| Direct costs | 4142.2 | 5481.3 | 8761.2 | 16677.3 | 8765.5 | <.001c |
| 95%CI | 3109.7-5174.7 | 4973.7-5989.0 | 8124.1-9398.4 | 15 482.3-17 872.2 | 7922.4-9608.5 | |
| Difference NYHA-IV, NYHA-I | 12 535.1 | |||||
| Indirect costs,€ | ||||||
| Temporary labor loss | 971.6 (2922.4) | 1561.5 (3750.3) | 2319.1 (4535.5) | 1396.2 (3050. 9) | 1715.4 (3898.0) | .026 |
| Total costs (direct + indirect),€ | 5017.7 (5335.1) | 7241.2 (6725.9) | 11 128.2 (8850.3) | 16 940.8 (5199.7) | 9038.5 (7885.8) | <.001c |
95%CI, 95% confidence interval; CT, computed tomography; NYHA, New York Heart Association.
Adjusted annualized total direct health care costs amounted to €8 765.5 (95%CI, 7922.4-9608.5), showing significant variation among NYHA categories. Cost differences between NYHA-I and IV amounted to €12 535.1 (table 4). On average, indirect costs were €1715.4±3898.0, ranging from €971.6±2922.4 in NYHA-I patients to €2319.1±4535.5 in NYHA-III (which included more nonretired individuals than class-IV). The mean total costs (direct and indirect) were €9038.5±7885.8) (table 4).
Besides SRT or device implantation, hospitalization was the costliest health care resource in each group, followed by medication and primary care visits among NYHA-I and -II patients, and by medication and ER visits among NYHA-III and -IV patients (table 4). Overall, hospital admissions expenses were 3 times higher than other costs such as medical tests or medication, when not considering SRT or device implantation (figure 4).
DISCUSSIONTo our knowledge, this is the first Spanish study to evaluate the management of oHCM and its impact on HCRU and costs using real-world data. We found a higher prevalence of oHCM in Spain compared to international reports, although its relative frequency among HCM patients was lower, more in line with data from Sweden.14 Approximately one-third of NYHA class III/IV patients who underwent SRT improved to a lower NYHA class. Higher NYHA classification was associated with increased hospitalization rates, cardiovascular events, mortality, HCRU, and costs (figure 5).
There is a substantial scarcity of real-world data regarding Spanish oHCM patients’ demographics, clinical management, HCRU, and economic impact. This study estimated the prevalence of oHCM in Spain to be 7 cases per 10 000 individuals, which exceeds the 2.8-4.1 cases per 10 000 individuals reported in the UK and Germany.12 These differences may stem from methodological discrepancies, genetic background variations, aging demographics, or differences in diagnostic outreach and criteria. Only 25% of HCM patients in Spain were diagnosed with oHCM, compared with 68% in the UK and 49% in Germany. This disparity may be due to the different data sources and coding systems: our analysis used the BIG-PAC database and ICD-9 codes, in contrast to the broader diagnostic coding and databases applied in other studies. Furthermore, our study used stricter diagnostic criteria than those used in the German study,12 which could account for the lower observed prevalence.
In our cohort, NYHA class II and III predominated among oHCM patients, with consistent diagnostic frequencies over the 9-year recruitment period. The mean age and comorbidity burden increased progressively with NYHA classification, consistent with disease severity.
Therapeutic interventions varied significantly by NYHA class, with the mean number of prescribed medications rising from 1.6 in NYHA-I to 3.1 in NYHA-IV, reflecting the limitations of pre-myosin inhibitor pharmacological options in fully addressing disease complexity.31,32
In Spain, BBs and CCBs are the most commonly prescribed medications for oHCM, in line with American and European guidelines.7,31 However, evidence supporting their efficacy remains limited.31 Disopyramide use was rare, likely due to limited clinical experience and concerns about adverse effects.33 A notable minority of patients continued to receive dihydropyridine CCBs and renin-angiotensin system inhibitors (3.5% and 36.7% of patients, respectively), despite guidelines advising against their use in oHCM.31 This suggests that many patients are treated preferentially in nonreferral hospitals or by specialists who may not be up to date with guideline recommendations. The recent introduction of novel therapeutic agents, such as cardiac myosin inhibitors, represents a paradigm shift in the management of oHCM. However, real-world studies evaluating their effectiveness, safety, and cost-effectiveness in routine clinical practice are still needed to fully understand their impact on patient care and health care systems.
Only 8.2% of the study cohort underwent SRT, mainly patients in NYHA classes III (13.1%) and IV (47.7%). SSM, a definitive procedure for alleviating obstruction, was performed in only 7.3% of class III/IV patients, reflecting its selective use. Instead, a larger proportion underwent PTSMA (13.2%), likely due to the limited availability of specialized centers for SM and the preference for a less invasive approach in elderly patients, consistent with earlier recommendations.34 This preference likely influenced this distribution pattern.
As expected, cardiovascular events and mortality increased with disease severity.35 Patients in NYHA classes III and IV had significantly higher rates of adverse events and death. Despite interventions, most patients remained in the same or a worse NYHA class at follow-up: 90% of those initially in NYHA-III and 69% of those in NYHA-IV did not improve. About one-third of patients undergoing SRT or device implantation showed improvement, which may appear modest. However, it is important to note that device implantation alone may not yield the same functional improvement as SRT. Moreover, these findings are subject to limitations of administrative data, where improvements may be captured in open text fields but not updated in structured classification fields. Prospective studies are warranted to validate these observations.
HCRU and costs rose markedly with increasing disease severity. Differences were particularly pronounced in ER visits, cardiology consultations, hospitalizations, and length of hospital stays among NYHA classes. The low frequency of monitoring tests may reflect inconsistent application of clinical guidelines in real-life practice, regardless of the care setting. Patients with NYHA-III and -IV who underwent SRT or device implantation exclusively incurred the highest healthcare costs. The mean healthcare cost for NYHA-IV patients was €17 545.2 (95% CI, €16 213.9-€18 876.5), compared with €4430.3 (95% CI, €3690.7-€5170.0) for those in NYHA-I. These findings are consistent with existing literature,36,37 highlighting the economic burden of managing advanced oHCM.
This study has several strengths, including its detailed analysis of HCRU and costs among NYHA classes, and its use of a large, nationally representative dataset (BIG-PAC), which provides valuable insights into the clinical and economic burdens of oHCM. The longitudinal design allows for assessment of trends over time and understanding of disease progression and management outcomes.
However, the study also has limitations inherent to administrative data, such as missing variables and selection bias.38 Such limitations highlight the need for cautious interpretation of the study results and suggest an avenue for future research to incorporate more comprehensive data collection methods, possibly through multicenter collaborations. Heterogeneity among participating centers (referral vs nonreferral) and the exclusion of private centers must be considered when interpreting the findings. Patients were categorized by baseline NYHA class, and changes over time were not reassigned in the analysis. Furthermore, mortality rates associated with SRT/medical devices procedures and the percentage of patients who underwent heart transplantation were not retrieved. Moreover, costs related to SRT or device implantation may be under or overestimated since some sources did not specify whether the cost was solely due to the intervention or to the intervention and subsequent visits (ie, follow-up visits). Out-of-pocket costs borne by patients or families were not captured, potentially underestimating the total economic impact. Finally, unadjusted confounders—such as age or sex—may introduce additional biases that merit exploration in future research.
CONCLUSIONSThis investigation provides critical insights into the real-world management of oHCM patients in Spain. Individuals with advanced symptomatic oHCM (NYHA-III and -IV) have a less favorable prognosis and generate substantially higher HCRU and associated costs compared with those with less severe disease (NYHA-I and -II). The standard of care prior to the availability of cardiac myosin inhibitors fell short in managing the full complexity of the underlying pathophysiology of the disease. The broader adoption of these novel therapeutic agents is likely to reshape the treatment paradigm for oHCM. In parallel, continued efforts are needed to expand our understanding of optimal management strategies to improve patient outcomes.
FUNDINGThis study was funded by Bristol-Myers Squibb. The sponsor was involved in all aspects of the study, in the drafting of the manuscript, and in the decision to submit the manuscript for publication.
ETHICAL CONSIDERATIONSData anonymization was rigorously carried out at the originating center in accordance with Organic Law 3/2018 of December 5 on the Protection of Personal Data and Guarantee of Digital Rights.39 Atrys Health-RLD, the study sponsor, did not have access to the primary data sources. As anonymization was completed prior to data inclusion in the database, written informed consent was not required. The study was conducted in accordance with the principles of the Declaration of Helsinki and was approved by the Comité de Ética de Investigación con Medicamentos del Consorci Sanitari de Terrassa (CEIm code 02-23-188-027) on November 24, 2022. The SAGER guidelines were considered and applied where possible; however, data were not disaggregated by patient sex.
STATEMENT ON THE USE OF ARTIFICIAL INTELLIGENCENo artificial intelligence was used during the preparation and drafting of this study.
AUTHORS’ CONTRIBUTIONSConceptualization: R. Barriales-Villa, L. Escobar-López, J. R. Gimeno; Methodology: I. Hernández; Validation: I. Hernández, D. Vilanova-Larena; Formal analysis: I. Hernández; Investigation: R. Barriales-Villa, L. Escobar-López, J. R. Gimeno, E. Rebollo-Gómez; Data Curation: I. Hernández; Writing—Original Draft: L. Escobar-López, E. Rebollo-Gómez; Writing—Review and Editing: R. Barriales-Villa, L. Escobar-López, D. Vilanova-Larena, J. Salazar-Mendiguchía, A. Echeto, I. Hernández, E. Rebollo-Gómez, J. R. Gimeno; Visualization: R. Barriales-Villa, L. Escobar-López, D. Vilanova-Larena, J. Salazar-Mendiguchía, A. Echeto, I. Hernández, E. Rebollo-Gómez, J. R. Gimeno; Supervision: L. Escobar-López; Funding acquisition: D. Vilanova-Larena, J. Salazar-Mendiguchía, A. Echeto.
CONFLICTS OF INTERESTR. Barriales-Villa declares that he has been part of advisory boards and received speaker fees from Bristol Myers Squibb, Sanofi, Cytokinetics, Alnylam, and Pfizer. J. R. Gimeno declares that he has been part of advisory boards and received speaker fees from Bristol Myers Squibb and Sanofi.
L. Escobar-López, D. Vilanova-Larena, J. Salazar-Mendiguchía, and A. Echeto are employees of Bristol Myers Squibb. I. Hernández and E. Rebollo-Gómez are employees of Atrys Health S.A.
- -
Obstructive hypertrophic cardiomyopathy (oHCM) accounts for approximately 70% hypertrophic cardiomyopathy (HCM) cases.
- -
The condition leads to various physiological disorders.
- -
oHCM is associated with higher cardiovascular risk and all-cause mortality.
- -
The prevalence of HCM and oHCM in Spain was 28 and 7 per 10 000 individuals, respectively.
- -
New York Heart Association (NYHA)-III and -IV patients showed worse prognosis, higher health care resource utilization, and associated costs.
- -
A total of 13.1% of NYHA-III and 47.7% of NYHA-IV patients underwent septal reduction therapies; of those, 38.7% and 35.5%, respectively, transitioned to a lower NYHA class.
Data analysis and medical writing support was provided by Atrys Health and funded by Bristol-Myers Squibb.
Supplementary data associated with this article can be found in the online version, at https://doi.org/10.1016/j.rec.2025.04.004
