Multislice computed tomography is an excellent technique for the detection of significant coronary artery lesions. Our purpose was to assess whether computed tomography could replace routine invasive coronariography before valvular surgery.
MethodsWe studied 106 consecutive patients (mean age: 67 [10]): 76% aortic valvular disease (62% stenosis, 14% regurgitation), 20% mitral valvular disease (4% stenosis, 16% regurgitation), and 4% mitro-aortic disease. Non-invasive studies were performed by helical computed tomography. Eighty-four percent of patients were in sinus rhythm (40% using beta-blockers, 32% nitrates). Findings from both techniques were analyzed according to a predetermined segmented anatomical model of the coronary artery (a total of 1802 segments).
ResultsThe incidence of coronary artery disease in these patients was 30%. Using computed tomography, 96.8% of segments could be evaluated and 3.2% could not. Calcium score ranged from 0 to 7572 (median: 182). In the per patient analysis, computed tomography showed a sensitivity of 95%, specificity 94%, positive predictive value 84%, and negative predictive value 98%.
ConclusionsComputed tomography is an excellent technique for ruling out coronary lesions prior to valvular surgery, making an invasive study unnecessary if the quality of the study is good and the result is negative.
Keywords
The prevalence of coronary heart disease (CHD) in patients with valvular disease can be estimated on age, sex and risk factors.1 The presence of symptoms consistent with ischemic heart disease is an important marker for CHD in the general population. However, in patients with valve disease these may be secondary to multiple causes such as ventricular dilation, increased wall stress and subendocardial ischemia secondary to left ventricular hypertrophy.2,3 For this reason, conventional coronary angiography (CCA) is indicated in patients with valvular disease when surgery is planned. Knowledge of coronary anatomy improves risk stratification and determines whether coronary revascularization is indicated in association with the valve replacement.4,5
CCA is the best method for ruling out significant coronary lesions; however, it is invasive and not without risk.6 According to the guidelines for the management of patients with valvular disease, a significant percentage of patients without coronary lesions will be subjected to a CCA. In addition, the use of Doppler echocardiography can assess the severity of the various valve diseases without resorting to a hemodynamic study. New methods for assessing patients with a low or moderate risk of CHD are therefore needed.
Recent studies have demonstrated that multislice computerized tomography (MSCT) is a highly accurate technique for CHD diagnosis.7,8,9,10 However, there is little information on its usefulness in ruling out CHD before surgical treatment in patients with valvular disease.
The main objective of this study is to compare the findings of MSCT angiography and CCA in all groups of patients before valve replacement to provide comprehensive non-invasive data.
Methods Study PopulationAll patients scheduled to undergo CCA before valve replacement surgery from December 2005 to December 2007 were included in the study. The exclusion criteria considered were: allergy to iodinated contrast (n=2), renal failure (serum creatinine>2mg/mL; n=8), presence of tachyarrhythmias with uncontrolled ventricular response (mean ventricular response>80bpm), under pharmacological treatment (n=10), unable to perform a 20-second apnea test (n=7), and refusal to sign informed consent form (n=1). The study was approved by the Vall d’Hebron Hospital ethics committee and all patients gave informed consent. The study prospectively included 106 patients (64 men, 42 women, mean age: 67 ([10]), age range: 35–84 years).
Patient PreparationPatients with a heart rate >65bpm, preserved left ventricular systolic function and no contraindications to beta-blocker treatment received repeated doses of propranolol (1mg) intravenously (to a total dose of 5mg), with blood pressure, heart rate and symptoms under control. All patients except those with aortic stenosis, heart rates >65bpm (after administering beta-blockers) or systolic blood pressure <100mmHg received 0.5mg of sublingual nitroglycerin.
Acquisition Protocol and Computed Tomography Image ReconstructionAll patients were studied using a 16-slice cardiac CT scanner (Sensation 16, Siemens, Forchheim, Germany). Using localizers equivalent to a chest radiograph in anteroposterior and lateral projections, a volumetric acquisition was performed without contrast to quantify coronary calcification, with a collimation of the detectors of 16×1.5mm, table speed of 3.2mm/rotation, gantry rotation time of 0.42s, tube voltage od 120kVp, tube current of 400–600mAs and a cranial-caudal scan direction. Retrospective gating was used without X-ray modulation to achieve the best image quality both during diastole and systole. Radiation doses were 8–12mSv, a normal range for a 16-slice MSCT without current modulation.11
Subsequently, 80–100mL of iodinated contrast (Visipaque 320, Amersham Health, Little Chalfont, United Kingdom) was administered, followed by 50mL of saline through an antecubital vein at a rate of 4–5mL/s. The peak contrast arrival time at the level of the ascending aorta was automatically determined to establish the acquisition time.
The acquisition was performed during inspiratory breath-hold and was synchronized with the electrocardiogram. Subsequently, images were reconstructed with a thickness of 1mm and reconstruction intervals of 0.5mm for all the volume acquired in predetermined phases of the cardiac cycle (0%–95% with successive increments of 5%), and simultaneous recording of the ECG trace. Images with less displacement of the coronary tree (typically 30% and 65%) were transferred to the workstation (Leonardo, Siemens) for analysis.
Conventional Coronary AngiographyCCA was performed prior to the MSCT study with a mean interval of 2.5 (0.8) months by means of femoral artery puncture and following the Seldinger technique. Angiograms were evaluated by agreement between 2 experts and using the modified 17-segment model proposed by the American Heart Association (AHA),12 which includes the major coronary arterial trunks and main branches. All segments were included for analysis and evaluated in 2 orthogonal views using specific software (CAAS, Pie Medical Imaging). Significant stenosis was considered to exist if the lumen reduction was ≥50%.
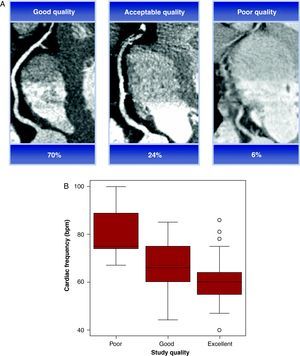
Analysis of Multislice Computed Tomography ImagesThe MSCT images were evaluated by consensus of 2 observers (a radiologist and a cardiologist) who were unaware of the CCA outcome or the patient's clinical data. The image quality was assessed according to a 3-point scale: 3=excellent, 2=good (the presence of motion artifacts, but able to assess the arterial lumen) and 1=poor (unable to see the arterial lumen). This information is presented in Figure 1A. The calcium in the different blood vessels was analyzed using specific software, and the results were expressed by the Agatston score (AS).13 The total calcium score was used to divide patients into 5 groups: 0–10, 11–100, 101–400, 401–1000, >1000, which were predefined due to presenting an increased risk of CHD.14 The 3-dimensional volumetric reconstruction was analyzed for each patient to obtain information about the creation and distribution of coronary arteries, before being segmented according to the amended 17-segment AHA classification12 (previously described) and visually classified as assessable or non-assessable. The reasons for not evaluating a vessel were classified into 4 categories: the presence of a stent, severe calcification, small vessel size (<2mm) and motion artifacts. Assessable vessels were analyzed for stenosis ≥50%, using axial slices and multiplanar reconstructions.

Figure 1. (A) Image quality according to the three-point scale. (B) Graph comparing the image quality and heart rate (bpm).
Statistical AnalysisThe sensitivity, specificity, positive predictive value, negative predictive value, diagnostic accuracy and 95% confidence intervals (CI) were determined for MSCT in detecting significant coronary lesions. CCA was used as the reference standard. The comparison between CCA and MSCT was performed at 4 levels: per patient, per vessel, by segment and by subgroups. Agreement between both techniques was analyzed using the kappa statistic.
To calculate differences between groups for continuous parameters, the Student t-test was used for a normal distribution, and the Mann–Whitney U test if not. For categorical variables, the general characteristics of the sample were assessed by percentages (Chi-square test).
All tests were performed using the SPSS statistics program (version 15.0, SPSS Inc., Chicago, IL).
ResultsThe main characteristics of the study population are described in Table 1. Four patients (3.7%) had polyvalvular (mitral and aortic valve) disease. Based on the results of the CCA, 32 (30%) had significant CHD and 74 (70%) had no significant lesions. Patients with CHD were older, with a greater proportion of cardiovascular risk factors (blood pressure, dyslipidemia, and calcium score) and symptoms (angina). In addition, most patients with CHD had aortic stenosis (25/32, 78%).
Table 1. Patient Characteristics.
| CHD+ | CHD− | P | |
| Number of patients | 32 (30) | 74 (70) | |
| Age (years) | 70±8 | 65±11 | .01 |
| Sex (male) | 21 (66) | 43 (58) | .49 |
| Body mass index (kg/m2) | 27±3 | 28±4 | .68 |
| Calcium score (Agatston) | 1160±1452 | 298±684 | .01 |
| Risk factors | |||
| Blood pressure | 25 (78) | 50 (68) | .27 |
| Diabetes mellitus | 17 (53) | 16 (22) | .01 |
| Smoker | 10 (31) | 36 (49) | .99 |
| Dyslipidemia | 23 (72) | 37 (50) | .04 |
| LVEF (%) | 57±11 | 59±9 | .59 |
| Symptoms | |||
| Angina | 22 (69) | 19 (26) | .01 |
| Heart failure | 24 (75) | 49 (67) | .35 |
| Syncope | 4 (13) | 6 (8) | .47 |
| Valvular disease | |||
| Aortic stenosis | 25 (78) | 41 (55) | .05 |
| Aortic regurgitation | 2 (6) | 13 (18) | .01 |
| Mitral stenosis | 2 (6) | 2 (3) | – |
| Mitral regurgitation | 3 (10) | 14 (19) | .08 |
| Aortic mitral | 0 | 4 (5) | – |
| Number of vessels | |||
| 0 | 0 | 74 (70) | |
| 1 | 16 (15) | ||
| 2 | 10 (9) | ||
| 3 | 5 (5) | ||
| CT+3 vessels | 1 (1) | ||
CHD+, patients with coronary heart disease; CHD−, patients without coronary heart disease; CT, common trunk; LVEF, left ventricle ejection fraction.
Data expressed as n (%) or as a mean±standard deviation.
All patients underwent MSCT without incident. The average scan time was 20 (1.4) seconds. Eighty-four percent of patients were in sinus rhythm (89/106), 15.1% in atrial fibrillation (16/106) and 0.9% in pacemaker rhythm (1/106). The study quality was rated as excellent in 70%, good in 24% and poor in 6% of the studies, significantly associated with a heart rate of 59 (10) bpm, 66 (10) bpm, and 81 (13)bpm, respectively (Figure 1B). Forty percent of patients (42/106) received beta-blocker treatment; 32% of patients (34/106) also received sublingual nitroglycerin. The mean heart rate during the MSCT study was 62.2 (10.4)bpm.
Diagnostic Capability of Computed Tomography Coronary Angiography: Calcium ScoreThe calcium score was correctly assessed by MSCT in all patients, showing a mean value of 558 (1057) AS (median=182, range=0–7572). The mean AS for specific coronary arteries was: common trunk (CT), 30.9; left anterior descending artery (LAD), 180.9; circumflex artery (LCX), 110.1; and right coronary artery (RCA), 237.
The diagnostic capability of MSCT to detect significant coronary lesions, taking into account the influence of coronary calcification, is shown in Table 2. A cut-off point of 1000 was associated with a higher proportion of non-assessable segments (39 segments).
Table 2. Influence of Calcium Score on the per-Segment Analysis.
| Score | Patients | Segments | Uninterpretable segments | TP | TN | FP | FN | Sensitivity (95% CI) | Specificity (95% CI) | PPV (95% CI) | NPV (95% CI) | Accuracy (95% CI) |
| 0–10 | 28 | 472 | 4 | 5 | 467 | 0 | 0 | 100 (48–99) | 100 (99–100) | 100 (48–100) | 100 (99–100) | 100 (99–100) |
| 11–100 | 19 | 321 | 2 | 0 | 321 | 0 | 0 | – | 100 (99–100) | – | 100 (99–100) | 100 (99–100) |
| 101–400 | 21 | 350 | 7 | 12 | 334 | 3 | 1 | 92 (64–100) | 99 (97–100) | 80 (52–96) | 100 (98–100) | 99 (96–99) |
| 401–1000 | 21 | 352 | 5 | 17 | 329 | 5 | 1 | 94 (73–100) | 98 (97–100) | 77 (55–92) | 100 (98–100) | 98 (96–99) |
| >1000 | 17 | 250 | 39 | 33 | 210 | 5 | 2 | 94 (81–99) | 98 (95–100) | 87 (72–96) | 99 (97–100) | 97 (94–99) |
Abbreviations: CI, confidence interval; FN, false negative; FP, false positive; NPV, negative predictive value; PPV, positive predictive value; TN, true negatives; TP, true positives.
The diagnostic capability of MSCT to detect significant lesions in the per-patient analysis is detailed in Table 3. MSCT correctly identified 61 of 65 patients (94%) who showed no significant lesions during the CCA, thus giving a specificity of 94%. Furthermore, 21 of 22 patients showed significant stenosis, a sensitivity of 95%. Severity of stenosis was overestimated in 4 patients, classified as suffering from significant CHD; all of these were due to calcified lesions: proximal segment of the RCA (2 patients), proximal segment of the LCX (1 patient) and first marginal branch (1 patient). In 1 patient, a significant calcified lesion located in the distal segment of the RCA was diagnosed by MSCT. However, the severity of the lesion was underestimated and classified as insignificant. The diagnostic accuracy for the determination of significant coronary lesions was 94%. The agreement rate between MSCT and CCA in the per-patient analysis was excellent (κ=0.85). When all patients were included in the analysis (including those with non-assessable segments, n=106), the MSCT diagnostic accuracy for significant lesion detection was 91%. Finally, accuracy of MSCT was also excellent (95%) for those patients whose proximal and middle segments were all assessable (those who potentially needed a coronary artery bypass graft).
Table 3. Computed Tomography Results in the per-Patient Analysis.
| n | TP | TN | FP | FN | Sensitivity (95% CI) | Specificity (95% CI) | PPV (95% CI) | NPV (95% CI) | Accuracy (95% CI) | |
| Global a | 106 | 27 | 69 | 5 | 5 | 84 (67–95) | 93 (85–98) | 84 (67–95) | 93 (85–98) | 91 (83–95) |
| Assessable segments b | 87 | 21 | 61 | 4 | 1 | 95 (77–100) | 94 (85–98) | 84 (64–95) | 98 (91–100) | 94 (87–98) |
| Proximal and middle segments c | 92 | 24 | 63 | 4 | 1 | 96 (80–100) | 94 (85–98) | 86 (67–96) | 98 (92–100) | 95 (88–98) |
CI, confidence interval; FN, false negative; FP, false positive; NPV, negative predictive value; PPV, positive predictive value; TN, true negatives; TP, true positives.
a Includes all patients in the study (including those with non-assessable segments).
b Only patients with all assessable segments.
c Only patients with all proximal and middle segments.
For each patient, 17 segments per were analyzed, for a total of 1802 segments included in the analysis. Of these, 1745 segments (96.8%) were assessable by MSCT and 57 segments (3.2%) could not be assessed. The reasons they could not be assessed were: severe calcification (n=31), motion artifacts (n=18), small caliber vessel (n=7) and presence of stent (n=1). CCA showed >50% stenosis in 87 segments. The diagnostic accuracy of MSCT for the diagnosis of significant coronary lesions in the segmental analysis is shown in Table 4. The sensitivity was 76%, specificity 99%, positive predictive value 84% and negative predictive value 99%. The agreement between MSCT and CCA in the segmental analysis was excellent (κ value 0.88).
Table 4. Computed Tomography Results in the per-Segment Analysis.
| Coronary segment | n | TP | TN | FP | FN | Sensitivity (95% CI) | Specificity (95% CI) | PPV (95% CI) | NPV (95% CI) | Accuracy (95% CI) |
| Global | 1745 | 67 | 1661 | 13 | 4 | 76 (65–84) | 99 (99–100) | 84 (74–91) | 99 (98–99) | 99 (98–100) |
| Proximal | 517 | 23 | 488 | 6 | 0 | 88 (67–97) | 99 (97–100) | 79 (59–92) | 99 (98–100) | 98 (97–99) |
| Middle | 616 | 31 | 581 | 3 | 1 | 86 (71–95) | 99 (99–100) | 91 (77–98) | 99 (98–100) | 99 (98–100) |
| Distal | 612 | 13 | 592 | 4 | 3 | 50 (28–69) | 99 (98–100) | 75 (48–93) | 98 (96–99) | 97 (95–98) |
CI, confidence interval; FN, false negative; FP, false positive; NPV, negative predictive value; PPV, positive predictive value; TN, true negatives; TP, true positives.
Four stenoses considered significant by CCA were considered insignificant by MSCT. These lesions were located in the distal segment of LCX, the middle segment of the RCA, the distal segment of the RCA and the posterolateral branch. Thirteen lesions considered significant by MSCT were considered <50% by CCA. Most of these lesions were located in the RCA (8 lesions), and in all cases the segment was calcified (13, 100%).
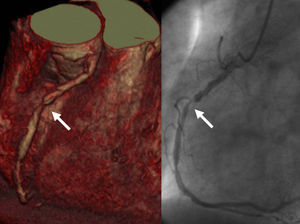
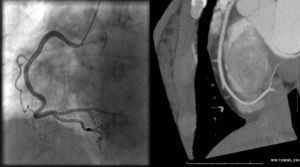
The diagnostic capability of MSCT to detect significant lesions in the vessel analysis is described in Table 5. From a total of 403 vessels, the severity of stenosis was overestimated and valued as a false positive in 9 cases: 1 lesion in the descending proximal anterior with an AS of 209, 1 lesion in the descending middle anterior with an AS of 723, 1 lesion in the proximal circumflex artery and 6 lesions in the RCA. In 2 vessels, the severity of the lesion was underestimated and classified as a false negative: 1 middle RCA and 1 distal RCA. The agreement between MSCT and CCA in the vessel analysis was excellent (κ value 0.86; Figure 2, Figure 3).
Table 5. Computed Tomography Results in the Per-Vessel Analysis.
| n | TP | TN | FP | FN | Sensitivity (95% CI) | Specificity (95% CI) | PPV (95% CI) | NPV (95% CI) | Accuracy (95% CI) | |
| Global | 403 | 38 | 354 | 9 | 2 | 95 (83–99) | 97 (95–99) | 81 (67–91) | 99 (98–100) | 97 (95–99) |
| CT | 105 | 2 | 103 | 0 | 0 | 100 (16–100) | 100 (96–100) | 100 (16–100) | 100 (96–100) | 100 (97–100) |
| LAD | 102 | 14 | 86 | 2 | 0 | 100 (77–100) | 98 (92–100) | 88 (62–98) | 100 (96–100) | 98 (93–100) |
| LCX | 104 | 11 | 92 | 1 | 0 | 92 (62–100) | 99 (94–100) | 92 (62–100) | 100 (95–100) | 99 (95–100) |
| RCA | 92 | 11 | 73 | 6 | 2 | 61 (36–83) | 92 (84–97) | 65 (38–86) | 97 (84–96) | 91 (84–96) |
CI, confidence interval; CT, common trunk; FN, false negative; FP, false positive; LAD, left anterior descending artery; LCX, circumflex artery; NPV, negative predictive value; PPV, positive predictive value; RCA, right coronary artery; TN, true negatives; TP, true positives.

Figure 2. Multislice computed tomography study 3-D volumetric image (left panel) and angiographic image (right panel) showing occlusive stenosis in the right coronary artery (arrow).

Figure 3. Maximum intensity projection (right panel) and angiographic image (left panel) showing no significant stenosis in the right coronary artery.
Diagnostic Capability of Computed Tomography Coronary Angiography: per-Subgroup AnalysisThe AS average was higher in patients with aortic stenosis than in patients with other valve or atrial fibrillation conditions. The diagnostic accuracy of MSCT for detecting significant lesions in the analysis based on valve disease and atrial fibrillation is described in Table 6. Sensitivity of MSCT to detect coronary lesions was lower in patients with aortic stenosis than in other valvular diseases: 93% vs. 100%, respectively. However, the negative predictive value was similar in both groups: 99% vs. 100%. MSCT also had excellent diagnostic accuracy for excluding significant lesions in patients with atrial fibrillation, with specificity and negative predictive values of 99%.
Table 6. Computed Tomography Results in the Subgroup Segment Analysis.
| Calcium score median | n | TP | TN | FP | FN | Sensitivity (95% CI) | Specificity (95% CI) | PPV (95% CI) | NPV (95% CI) | Accuracy (95% CI) | |
| Aortic stenosis | 301 | 402 | 54 | 335 | 9 | 4 | 93 (83–98) | 97 (96–100) | 86 (75–93) | 99 (99–100) | 97 (96–99) |
| Aortic regurgitation | 32 | 249 | 8 | 240 | 1 | 0 | 100 (63–100) | 100 (98–100) | 89 (52–100) | 100 (98–100) | 99 (98–100) |
| Mitral stenosis | 0.8 | 67 | 2 | 63 | 2 | 0 | 100 (16–100) | 97 (89–100) | 50 (10–93) | 100 (94–100) | 97 (90–100) |
| Mitral regurgitation | 52 | 289 | 3 | 285 | 1 | 0 | 100 (29–100) | 100 (98–100) | 75 (20–99) | 100 (99–100) | 100 (98–100) |
| Aortic mitral | 4.5 | 68 | 0 | 68 | 0 | 0 | – | 100 (95–100) | – | 100 (95–100) | 100 (95–100) |
| Atrial fibrillation | 104 | 16 | 4 | 266 | 1 | 1 | 80 (28–99) | 99 (98–100) | 80 (28–99) | 99 (98–100) | 99 (97–100) |
CI, confidence interval; FN, false negative; FP, false positive; NPV: negative predictive value; PPV: positive predictive value; TN: true negatives; TP: true positives.
This study showed that MSCT provides accurate assessment of CHD with a sensitivity of 84% and a specificity of 93% in a population with a low prevalence of significant coronary stenosis (30%). In 5 of 74 patients (6.8%), the severity was overestimated due to the presence of severe calcification, and in 5 of 32 patients (15.6%) significant CHD was not diagnosed because of small vessel lesions or disease located in non-assessable segments. When only considering the proximal and middle segments (appropriate for bypass), the sensitivity was 96%, specificity 94% and negative predictive value 98%.
Coronary angiography using MSCT is a recently developed diagnostic technique. Previous studies have shown that MSCT has a high negative predictive value for ruling out the presence of significant angiographic lesions (between 95% and 100%).15 However, the role of MSCT in patients with valvular disease has not yet been fully established, so the current guidelines (American College of Cardiology and European Society of Cardiology) recommend performing CCA before valve replacement in patients with chest pain, with indications of myocardial ischemia, left ventricular dysfunction, history of CHD or risk factors for CHD (including age).4,16 The results of this study agree with other authors1,2,3 and confirm that the symptoms, risk factors and type of valve disease are associated with CHD, but cannot be diagnosed in patients with coronary lesions.
Because of the diagnostic accuracy of MSCT in diagnosing CHD, CCA could have been avoided in 62% of patients (66/106). It would have been necessary in 30% of patients (32/106) to confirm the presence of coronary disease diagnosed by MSCT, and in 7.5% (8/106) for proximal and middle segments considered as not assessable by MSCT. The technique is useful in the subgroup analysis, both in patients with aortic and mitral valve disease, as there was only one false negative among all patients in our series when all proximal and middle segments were assessable. Valvular aortic stenosis is most frequently required to rule out CHD, due to patient age and coexisting risk factors for cardiovascular disease. However, this is the valve disease with the lowest sensitivity and specificity given the higher calcium score. Furthermore, although patients with atrial fibrillation constitute a small subgroup, our results suggest that these patients may benefit from the implementation of MSCT to rule out coronary lesions if the heart rate is controlled (<80bpm) and the AS is low (<1000).
The data from this study are consistent with previous 16-splice MSCT studies.17,18 Manghat et al.17 and Gilard et al.18 studied patients with aortic valve disease before valve replacement surgery and achieved a specificity of 80%–95% and negative predictive value of 80%–98%. Recent 64-splice MSCT studies patients with non-valvular and valvular conditions have given excellent results.9,19,20,21,22 Meijboom et al.21 studied patients with various valvular and sinus rhythm conditions, showing a specificity of 92% and negative predictive value of 100%. However, our study included the largest series of patients with mitral and aortic valve disease with an intermediate risk of CHD and without excluding the presence of atrial fibrillation.
Factors Affecting Image QualityCalcified plaques produce artifacts (blooming) which may affect the evaluation of luminal obstruction.15,19,23 This has led to a debate, still ongoing, as to whether MSCT should be performed when the overall calcium score exceeds a certain threshold. However, calcium distribution is not homogeneous. In some cases, calcium deposits are patchy and evenly distributed throughout the coronary artery, which would result in relatively easy interpretation, while at other times calcification is concentrated in a coronary segment, hindering the evaluation. Gilard et al.18 used a cut-off point ≥1000 to demonstrate that patients with this score had a high frequency of uninterpretable segments. The optimal cut-off point to avoid implementation of MSCT is still in dispute, with recent studies suggesting MSCT not be implemented if the AS is ≥600.20 In this series, the number of uninterpretable segments with a score >1000 was 39. Furthermore, 3 patients with a calcium score ≤10 had significant coronary lesions, so a low score does not rule out the presence of CHD. These results suggest that although the calcium score relates to the presence of CHD, a score <100 does not exclude CHD. Of 32 patients with CHD, 4 (12.5%) had an AS <100. Even a score >400 is not conclusive, as 19 of the 74 patients (25.7%) without CHD had this score.
Heart rate monitoring forms part of the MSCT protocols for improving image quality. In our experience, all excellent quality studies showed a heart rate below 65bpm, thereby demonstrating the previously described association of low heart rate and good image quality15,24 (Figure 1B).
The rate of displacement of the coronary tree during the cardiac cycle varies in different coronary arteries, probably due to its anatomic course. The RCA has an average speed greater than the rest.25 This could justify the worse results in terms of sensitivity, specificity and positive and negative predictive values of this artery compared with the rest.
Study LimitationsOne limitation of this study is the use of 16-splice MSCT. However, the increased number of splices has contributed fundamentally to the improvement in temporal resolution and the acquisition time of the image, although not its quality.15 In this study, we included only patients scheduled for elective valve replacement (patients without acute hemodynamic decompensation), which could be considered a selection bias. Patients with atrial fibrillation with a controlled heart rate (<80bpm) were not excluded, as the motion artifacts caused by arrhythmias can be optimized by manually editing the electrocardiograph synchronization.26 Nonetheless, 10 patients with atrial fibrillation and a ventricular rate >80bpm that could not be controlled with beta-blockers were excluded.
ConclusionsCoronary angiography using MSCT is an excellent technique for ruling out CHD before valve replacement surgery. Because of its high specificity and negative predictive value, a negative study for CHD, if it is of good quality, could prevent the need for conventional invasive coronary angiography.
FundingThis study was funded by project FIS PI050488.
Conflicts of interestNone declared.
Received 26 April 2010
Accepted 20 September 2010
Corresponding author: Laboratorio de Ecocardiografía (2.a planta Anexo), Servicio de Cardiología, Hospital General Vall d’Hebron, Pg. de la Vall d’Hebron 119-129, 08035 Barcelona, Spain. jfrodriguezpalomares@gmail.com