
To analyze the association between volume and outcomes in coronary artery bypass grafting (CABG) in the Spanish National Health System.
MethodsWe analyzed CABG episodes from 2013 to 2015. The selected outcome variables were in-hospital mortality in the index episode, 30-day cardiac-related readmissions, and mortality during readmission. Risk-adjusted rates of in-hospital mortality (RAMR) and 30-day readmissions (RARR) were calculated using multilevel logistic regression. High- and low-volume hospitals for CABG were identified by a nonconditioned analysis (k-means) and by compliance with the volume recommendation of clinical practice guidelines.
ResultsA total of 17 335 CABG index episodes were included, with a crude in-hospital mortality rate of 5.0%. Episodes attended in low-volume centers for CABG (< 155 CABG per year) showed 17% higher RAMR (5.81%±2.07% vs 4.96%±1.76%; P <.001) and a negative linear correlation between volume and RARR (r=−0.318; P=.029), as well as a higher percentage of complications during the episode. The same association between volume and more favorable outcomes was found in isolated CABG.
ConclusionsThe mean CABG volume is low in Spanish National Health System hospitals. Higher volume was associated with better outcomes in CABG, both total and isolated. The findings of this study indicate the need for a higher concentration of CABG programs, as well as the publication of risk-adjusted outcomes of coronary intervention.
Keywords
Several studies have recorded an association between surgeon and hospital procedure volume and the outcome of various interventions,1,2 including coronary artery bypass grafting (CABG).1–4 The major clinical practice guidelines recommend minimum procedure volumes, both for surgeons and for hospitals,5,6 and while these recommendations do not exceed evidence level C, they have important implications for health care planning.7,8 However, the evidence for an association between procedure volume and CABG outcome sits alongside reports of good results at hospitals with a low procedure volume.9,10 Furthermore, the association between volume and mortality appears to hold up only to a volume threshold, beyond which further volume increases yield no further improvements.4 In the United States, the evidence for an association between volume and mortality has weakened as a result of the obligatory publication of CABG mortality data.11 In Spain, the relationship between CABG volume and mortality is not firmly established. Gutacker et al. reported notably higher CABG mortality in Spain (5%) than in England (2.3%) and attributed this difference to differences in procedure volume (43 hospitals with 154 CABG procedures per year in Spain vs 29 hospitals with 690 procedures per year in England).12 In a more recent study of CABG surgery in 5 European countries, the same authors established a “safe threshold” minimum volume of 415 CABG procedures per center per year.4 However, although mean CABG per center in Spain falls short of this target,13 risk-adjusted CABG mortality in Spain (EuroSCORE scale14) is lower than predicted.13
The goal of the present study was to examine the association between CABG volume and outcome variables (in-hospital mortality in the index episode, 30-day readmission, and mortality during 30-day readmissions) in hospitals of the Spanish National Health System (NHS).
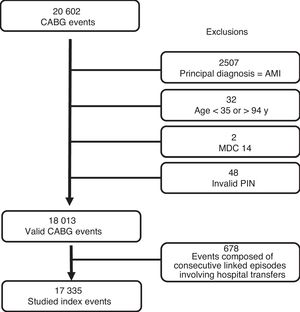
METHODSStudy populationWe conducted a retrospective observational analysis of hospitalizations involving CABG (procedure codes 36.10 to 36.19) recorded in the Spanish NHS Minimum Data Set (MDS) between January 1, 2013 and December 31, 2015 (). To ensure as far as possible the selection of elective CABG surgery, we excluded patients with a principal diagnosis code for acute myocardial infarction (410.*1). Isolated CABG was defined by noncoincidence with procedure codes for major cardiac surgery (35.*, 37.32-4, 37.5*, 37.60, 37.63-68, and 37.90).
To improve data quality and consistency, the following events were excluded: surgery in patients younger than 35 years and older than 94 years; events related to pregnancy, labor, and the puerperium; surgery resulting in hospital readmission less than 2 days after discharge to the home; events associated with patient self discharge or unknown discharge destination; and events with no recorded personal identification number, type of discharge, patient age, or principal diagnosis. The index event was defined as a patient's first hospital admission during the study period. A series of linked episodes involving hospital transfers was considered a single event, with the admission date that of the first episode in the series and the discharge date that of the final episode; events of this type were assigned to the hospital with the highest level of complexity.
Risk factors used to profile patient morbidity were selected according to Centers for Medicare & Medicaid Services criteria15,16 adapted to the MDS structure. Comorbidities were classified according to the Condition Categories proposed by Pope et al.17
Outcome variablesThe outcome variables were in-hospital mortality in the index event, 30-day cardiac-related readmissions (), and mortality during these readmissions. Readmissions were monitored for events with a discharge date between January 1, 2013 and December 31, 2014.
The analysis was limited to hospitals with a cardiac surgery unit. Mean annual procedure volume was calculated from the number of CABG procedures carried out in each hospital during the study period.
Statistical analysisContinuous variables are expressed as mean±standard deviation or median [interquartile interval]. Categorical variables are expressed as frequencies and percentages.
Adjustment for mortality and readmission risk was necessary due to the existence of patient-specific and center-specific characteristics independent of the quality of care provided.18 Risk adjustment was achieved using models based on Centers for Medicare & Medicaid Services methodology. The independent variables were those included in the specific adjustment model for this procedure.15,16
Event-related data were used to derive multilevel logistic regression models18 including clinical and demographic variables and also a hospital-specific random effect.19,20 Model parameters were identified by the reverse elimination method; the significance levels for factor selection and elimination were P <.05 and P ≥.10, respectively. The discrimination of the final models was determined from the area below the ROC (receiver operating characteristic) curve.
The derived models were used to calculate the risk-adjusted rates of in-hospital mortality (RAMR) and readmission (RARR). To obtain these rates, we first calculated the ratio between the outcome predicted according to the operation of the individual hospital where the patient was treated and the standardized outcome predicted according to the mean operation of all the hospitals; this ratio was then multiplied by the unadjusted mortality or readmission rate in the study population.21 For a given hospital, a higher RAMR or RARR than the corresponding unadjusted rates indicated a higher risk of death or readmission than the mean risk for all hospitals in the study.
RAMR and RARR were used to compare outcomes between hospitals with high and low procedure volumes. Differences related to the characteristics of events treated at high-volume and low-volume hospitals were assessed by the Student t test or the chi-square test, as appropriate. Associations between procedure volume and RAMR or RARR were assessed using the Pearson correlation coefficient and linear regression models.
Low- and high-volume hospitals were distinguished by k-means clustering. The k-means clustering algorithm was used to obtain the maximum intracluster density and the minimum intercluster density from two thirds of the data, with the remaining third of the data used for validation. As an additional measure of high GABG volume, we also identified hospitals with a mean annual rate of ≥ 200 CABG procedures over the study period, in line with current guideline recommendations.6
All statistical comparisons were pairwise, and differences were considered statistically significant at P <.05. Odds ratios were calculated, together with their corresponding 95% confidence intervals. Statistical analyses were performed with Stat 13.0 (Stata Corp; College Station, Texas, United States) and SPSS.20.
RESULTSThe number of index CABG events selected was 17 335 (figure 1), and these events were associated with an unadjusted mortality rate of 5.0% and a median hospital stay of 13 [9-20] days. Mean patient age was 67.8±9.7 years, and 78.7% of patients were men. Of the selected index events, 11 151 (64.3%) were isolated CABG procedures, and this subset was associated with a mean patient age of 65.8±9.7 years and a higher proportion of men (83.1%). In-hospital mortality for isolated CABG surgery was 3%, and the median hospital stay was 12 [8-19] days. Total and isolated CABG showed statistically significant differences in patient age, unadjusted in-hospital mortality, and mean hospital stay (P <.001).

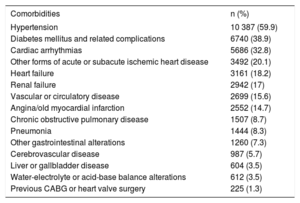
The most frequent comorbidities in CABG patients are shown in table 1. For all CABG patients, the 30-day readmission rate for cardiac causes was 8.6%, and the mortality associated with these readmissions was 5%. The corresponding figures for isolated CABG were 8.3% and 3%, respectively. The most frequent principal diagnoses triggering readmission are listed in the .
CABG patient comorbidities.
| Comorbidities | n (%) |
|---|---|
| Hypertension | 10 387 (59.9) |
| Diabetes mellitus and related complications | 6740 (38.9) |
| Cardiac arrhythmias | 5686 (32.8) |
| Other forms of acute or subacute ischemic heart disease | 3492 (20.1) |
| Heart failure | 3161 (18.2) |
| Renal failure | 2942 (17) |
| Vascular or circulatory disease | 2699 (15.6) |
| Angina/old myocardial infarction | 2552 (14.7) |
| Chronic obstructive pulmonary disease | 1507 (8.7) |
| Pneumonia | 1444 (8.3) |
| Other gastrointestinal alterations | 1260 (7.3) |
| Cerebrovascular disease | 987 (5.7) |
| Liver or gallbladder disease | 604 (3.5) |
| Water-electrolyte or acid-base balance alterations | 612 (3.5) |
| Previous CABG or heart valve surgery | 225 (1.3) |
CABG, coronary artery bypass grafting.
Comorbidities are grouped according to the Condition Categories proposed by Pope et al.17
The area below the ROC curve for adjusted in-hospital mortality was 0.87 (for both total and isolated CABG). Factors identified as significant for risk adjustment are shown in the , together with their corresponding models and discrimination capacity, which was good for index-event and 30-day mortality but poor for 30-day readmission ( and ).
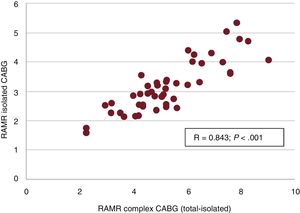
A marked and statistically significant correlation was noted between index-event RAMR after complex CABG (coinciding with major cardiac surgery) and after isolated CABG (r=0.843; P <.001) (figure 2). Index-event and 30-day RAMR showed no significant correlation with the volume of complex or isolated CABG (r=–0.04; P=.8 in both cases); in contrast, RARR was significantly correlated to both total CABG (r=–0.318; P=.029) and isolated CABG (r=–0.306; P=.036).
. CABG, coronary artery bypass grafting; RAMR, risk-adjusted in-hospital mortality rate.")
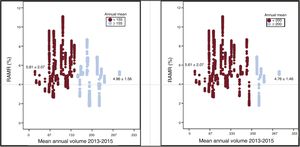
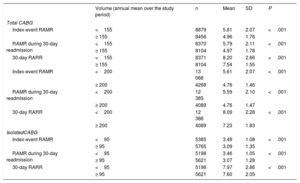
The k-means clustering algorithm identified high-volume hospitals as those with an annual mean of ≥ 155 CABG procedures over the study period; for the analysis of isolated CABG, high-volume hospitals were those averaging ≥ 95 isolated CABG procedures per year. In total, 33 centers (70%) performed fewer than 155 CABG procedures per year, and only 13% complied with the European Society of Cardiology (ESC) guideline recommendation to achieve a mean annual rate of ≥ 200 CABG procedures.6 Events treated at high-volume centers were associated with a lower RAMR (5.81±2.07 vs 4.96±1.56; P <.001) (figure 3). Cardiac-related 30-day RARR and associated 30-day RAMR were consistently lower at high-volume centers, for both total and isolated CABG (table 2).
 and low volume (< 155 CABG/year) are defined by the k-means clustering algorithm. In the right panel, high volume (≥ 200 CABG/year) and low volume (< 200 CABG/year) are as recommended in the European Society of Cardiology clinical practice guidelines on myocardial revascularization.6 In both comparisons, RAMR is significantly higher in low-volume hospitals (17% in the k-means clustering comparison and 18% according to the ESC guideline recommendation). CABG, coronary artery bypass grafting; RAMR, risk-adjusted in-hospital mortality rate.")
RAMR for events treated in high-volume and low-volume hospitals. In the left panel, high volume (≥ 155 CABG/year) and low volume (< 155 CABG/year) are defined by the k-means clustering algorithm. In the right panel, high volume (≥ 200 CABG/year) and low volume (< 200 CABG/year) are as recommended in the European Society of Cardiology clinical practice guidelines on myocardial revascularization.6 In both comparisons, RAMR is significantly higher in low-volume hospitals (17% in the k-means clustering comparison and 18% according to the ESC guideline recommendation). CABG, coronary artery bypass grafting; RAMR, risk-adjusted in-hospital mortality rate.
Risk-adjusted mortality and readmission rates for CABG. Comparisons by procedure volume.
| Volume (annual mean over the study period) | n | Mean | SD | P | |
|---|---|---|---|---|---|
| Total CABG | |||||
| Index-event RAMR | <155 | 8879 | 5.81 | 2.07 | <.001 |
| ≥ 155 | 8456 | 4.96 | 1.76 | ||
| RAMR during 30-day readmission | <155 | 8370 | 5.79 | 2.11 | <.001 |
| ≥ 155 | 8104 | 4.97 | 1.78 | ||
| 30-day RARR | <155 | 8371 | 8.20 | 2.66 | <.001 |
| ≥ 155 | 8104 | 7.54 | 1.55 | ||
| Index-event RAMR | <200 | 13 066 | 5.61 | 2.07 | <.001 |
| ≥ 200 | 4268 | 4.76 | 1.46 | ||
| RAMR during 30-day readmission | <200 | 12 385 | 5.59 | 2.10 | <.001 |
| ≥ 200 | 4089 | 4.76 | 1.47 | ||
| 30-day RARR | <200 | 12 386 | 8.09 | 2.28 | <.001 |
| ≥ 200 | 4089 | 7.23 | 1.83 | ||
| IsolatedCABG | |||||
| Index-event RAMR | <95 | 5385 | 3.49 | 1.08 | <.001 |
| ≥ 95 | 5765 | 3.09 | 1.35 | ||
| RAMR during 30-day readmission | <95 | 5198 | 3.46 | 1.05 | <.001 |
| ≥ 95 | 5621 | 3.07 | 1.28 | ||
| 30-day RARR | <95 | 5198 | 7.97 | 2.86 | <.001 |
| ≥ 95 | 5621 | 7.60 | 2.05 | ||
CABG, coronary artery bypass grafting; RAMR, risk-adjusted in-hospital mortality; RARR, risk-adjusted rate of readmission; SD, standard deviation.
High-volume hospitals did not have a higher proportion of isolated CABG procedures (64.6% vs 64.1% in low-volume hospitals; P=.474) but did have a higher proportion of elective admissions for CABG (68.7% vs 66.3%: P < .001). The association of risk factors with in-hospital mortality after elective CABG (total) is compared between low-volume and high-volume centers in table 3. Low-volume centers had a higher prevalence of comorbidities overall, but differences in age and sex were not significant. The same pattern was observed for isolated CABG ().
Risk-factor comparisons for elective CABG (total) at ‘low-volume’ and ‘high-volume’ hospitals.
| <155 CABG/y | ≥ 155 CABG/y | P | |
|---|---|---|---|
| N | 5864 | 5761 | |
| Age, y | 67.8±9.6 | 68±9.7 | .128 |
| Women | 21.6 | 21.4 | .738 |
| Cardiogenic shock | 1.6 | 1.2 | .091 |
| Obesity, thyroid alterations, hypercholesterolemia/lipidemia | 63.6 | 65.1 | .107 |
| Liver or gallbladder disease | 4 | 2.7 | <.001 |
| Dementia or other brain disease | 1.4 | 0.9 | .019 |
| Heart failure | 18.9 | 15.2 | <.001 |
| AMI | 3.8 | 2.2 | <.001 |
| Angina/old AMI | 16.4 | 14.4 | .003 |
| Hypertension | 59.9 | 61.8 | .037 |
| Stroke | 1 | 0.5 | <.002 |
| Vascular disease and complications or circulatory disease | 16.6 | 14 | <.001 |
| Pneumonia | 9.4 | 6.4 | <.001 |
| Renal failure | 16.2 | 15.7 | .424 |
| Pressure ulcer or chronic skin ulcer | 0.8 | 0.4 | .005 |
AMI, acute myocardial infarction; CABG, coronary artery bypass grafting.
Comorbidities are grouped according to the Condition Categories proposed by Pope et al.17 Data are expressed as % or mean±standard deviation.
The main findings of our study are as follows. a) The volume of CABG in the Spanish NHS is low, both per center and per year, and only 13% of hospitals meet the European Society of Cardiology clinical practice guideline recommendation to perform ≥ 200 procedures per year.6b) Procedure volume at NHS centers shows a consistent and significant association with outcome (mortality and readmission) for total and isolated GAGB, with adjusted in-hospital mortality 17% higher in low-volume centers. c) The association between high GAGB volume and better outcome is likely related to the higher rate of complications in low-volume centers. d) Centers achieving better outcomes with isolated CABG tend also to have better results with complex CABG.
Compared with health care systems in other countries, the Spanish NHS achieves a low mean number of CABG procedures per hospital,4,9–12 and therefore the definitions of high and low volume in the current study denote, in relative terms, 2 low-volume CABG categories. The low CABG volume in NHS hospitals is probably related to the low mean surgeon volume and is below guideline recommended rates.6
Unlike Gutacker et al.,4,12 we found major differences in outcome between low-volume and high-volume NHS hospitals, both for total and isolated CABG. The correlation between RAMR for complex CABG and isolated CABG indicates that the performances of each center in both procedures are interrelated. However, this result is also compatible with the failure-to-rescue concept,22 which posits that the capacity to effectively treat the main severe postsurgery complications depends more on the general operation of the hospital than on the surgical procedure itself. An influence of failure to rescue in the present study is suggested by the higher rate of comorbidities associated with CABG at low-volume centers. These comorbidities included acute myocardial infarction, stroke, pneumonia, and—for isolated CABG—cardiogenic shock. All of these comorbidities influence mortality risk adjustment; however, they are highly unlikely to have been present on admission for elective CABG and are thus likely to be postsurgery complications. The higher frequency of these comorbidities in low-volume centers forces the adjustment to operate in the opposite direction to the hypothesis, thus likely masking larger differences between high-volume and low-volume centers.
The association between structural variables and outcomes is complex. Because procedure volume per se does little more than ensure reasonable confidence intervals around statistical estimates, Luft8 has argued that policies to exclude or close centers according to their activity are less effective than alternative policies based on systematic information about risk-adjusted outcomes.23 Indeed, volume criteria cannot provide even a rough guide to policy so long as the NHS does not have access to robust and publicly available risk-adjusted outcome indicators supported by consensus between scientific societies and health care authorities.24 The publication of regularly updated, appropriately risk-adjusted outcomes is thus essential to allow analysis of the true effect of procedure volume and other factors. Toward this goal, our findings lead us to recommend a) greater concentration of CABG in high-volume centers within the Spanish NHS7,25 and b) the publication of outcomes.
LimitationsIn addition to the limitations inherent to mortality risk adjustment, the present study is limited by its retrospective nature and its reliance on administrative data. The MDS does not collect sufficient information about some important clinical variables, including those related to coronary anatomy. Nevertheless, the use of administrative registries to estimate health service outcomes has been validated against a medical record model.19 Moreover, although administrative data sources are likely inferior to audited clinical registry data,26 their validity has been demonstrated for mortality risk prediction after cardiac surgery.23 Whereas models developed by the Centers for Medicare & Medicaid Services include comorbidities on admission, the MDS did not collect these data until 2016. There is therefore a risk that the secondary diagnoses used as risk adjustment variables might denote not comorbidities but complications, in some cases indicating inappropriate treatment.19 Nevertheless, the predictive ability of the models used in the present study is comparable to that of other published models.24 Another limitation is that risk adjustment models can be significantly skewed by confounders that cannot be considered. Finally, the government-sourced MDS database is limited to data on cardiac readmission and thus does not allow analysis of all-cause readmissions; however, all-cause readmissions are likely an inferior performance indicator than cardiac events.27
CONCLUSIONSHospitals in the Spanish NHS have a low mean volume of CAGB procedures. We found an association between higher volume and improved outcome for CABG. The findings of this study indicate that CABG should be concentrated in high-volume centers within the Spanish NHS and support the publication of risk-adjusted outcomes of coronary intervention.
FUNDINGThis study was supported by an unconditional award from the Fundación Interhospitalaria de Investigación Cardiovascular.
CONFLICTS OF INTERESTNone declared.
- –
Although there is uncertainty about the extent to which procedure volume influences the outcome of CABG in different settings, this parameter continues to be used as an indirect quality indicator in the main clinical guidelines.
- –
To be useful, analyses of the relationship between volume and outcome should be adjusted to reflect the health care organization framework and should be regularly updated.
- –
Within the Spanish NHS, a high volume of total and isolated CABG is associated with a better outcome (lower in-hospital mortality and fewer readmissions).
- –
Hospitals with better outcomes after isolated CABG tend also to have better outcomes after complex CABG.
Partial access to the MDS database was granted by the National Health System Health Care Information Institute (Ministerio de Sanidad, Consumo y Bienestar Social).
Supplementary data associated with this article can be found in the online version available at https://doi.org/10.1016/j.rec.2019.08.016