Transcatheter aortic valve implant has become a widely accepted treatment for inoperable patients with aortic stenosis and patients at high surgical risk. Its indications have recently been expanded to include patients at intermediate and low surgical risk. Our aim was to evaluate the efficiency of SAPIEN 3 vs conservative medical treatment (CMT) or surgical aortic valve replacement (SAVR) in symptomatic inoperable patients at high or intermediate risk.
MethodsWe conducted a cost-effectiveness analysis of SAPIEN 3 vs SAVR/CMT, using a Markov model (monthly cycles) with 8 states defined by the New York Heart Association and a time horizon of 15 years, including major complications and management after hospital discharge, from the perspective of the National Health System. Effectiveness parameters were based on the PARTNER trials. Costs related to the procedure, hospitalization, complications, and follow-up were included (euros in 2019). An annual discount rate of 3% was applied to both costs and benefits. Deterministic and probabilistic sensitivity analyses (Monte Carlo) were performed.
ResultsCompared with SAVR (high and intermediate risk) and CMT (inoperable), SAPIEN 3 showed better clinical results in the 3 populations and lower hospital stay. Incremental cost-utility ratios (€/quality-adjusted life years gained) were 5471 (high risk), 8119 (intermediate risk) and 9948 (inoperable), respectively. In the probabilistic analysis, SAPIEN 3 was cost-effective in more than 75% of the simulations in the 3 profiles.
ConclusionsIn our health system, SAPIEN 3 facilitates efficient management of severe aortic stenosis in inoperable and high- and intermediate-risk patients.
Keywords
Aortic stenosis (AS) is the most frequent form of valvular heart disease in Europe (41.2%) and has a degenerative origin in most instances, although rheumatic and congenital etiologies are also prominent.1–4 Affected individuals are initially asymptomatic, but progressive severity produces symptoms and can provoke sudden cardiac death.5 Moreover, morbidity and mortality are elevated among asymptomatic individuals with an aortic flow velocity> 4 m/s6 or co-occurring diseases.7–10
In Spain, AS affects 7% of the population older than 85 years,11 and the annual prevalence rate among those older than 65 years is 4.4%. Up to 68% of affected individuals will require surgery or transcatheter aortic valve implant (TAVI),12 signaling the increasing impact of AS on public health.
To ensure quality and sustainability of health service provision, resource allocation needs to be founded on the accurate assessment of health care technologies, and an important element of this decision-making making process is cost-effectiveness analysis.13 Cost-utility analysis is a form of cost-effectiveness analysis that uses quality-adjusted life years (QALYs) as an effectiveness measure and considers values assigned to relevant health states.14 Cost-utility analysis is normally conducted by modeling the clinical reality from the perspective of interest.15
In recent years, TAVI has become established as the treatment of choice for patients with severe symptomatic AS who are inoperable or at a high surgical risk. The use of this procedure has increased survival and improved New York Heart Association (NYHA) functional class in these patient groups. TAVI is also a less invasive procedure than valve surgery. Recent advances include the SAPIEN 3 (S3) device (Edwards Lifesciences, United States), and related studies indicate that this latest-generation TAVI device should be considered for patients with intermediate or even low surgical risk.16–18
Due to the interest in TAVI shown by health professionals and patients, this technology has been the subject of studies aimed at increasing its efficient use.19–21 Here, we performed a comprehensive economic assessment of the use of the S3 device in inoperable patients (IPs), patients at high surgical risk (HRPs), and those at intermediate risk (IRPs) based on recent clinical evidence and health care costs in Spain. S3 TAVI was compared with the alternative treatment in each case: conservative medical treatment (CMT) for IPs and surgical aortic valve replacement (SAVR) for HRPs and IRPs.
METHODSA Markov mathematical model was used for a comparative analysis of treatment costs in the 3 populations of interest: IPs, HRPs, and IRPs. The comparator was pharmacological CMT for IPs and SAVR for HRPs and IRPs.
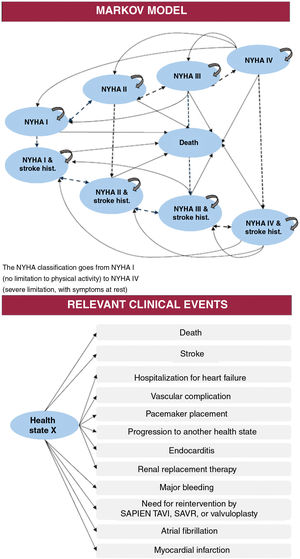
The model has been described in recent reports.22,23 Briefly, the model considers patient characteristics equivalent to those defined in the PARTNER,24 PARTNER 1,25 and PARTNER 216,26,27 clinical trials and was built from the results of those trials. The findings were used to define progression over time according to 4 levels of functional state based on the NYHA classification and the occurrence of stroke. Thus, patients could be located in any of 9 exclusive states that, with the exception of death, could change in monthly cycles (fig. 1).

The 15-year time horizon in the model covers the projected life expectancy of TAVI candidates with a mean age> 65 years.12,18,25,28 Nevertheless, the model also permits annual analysis, always from the perspective of the Spanish National Health System. The analysis considered resource use related to the intervention (preintervention procedures plus TAVI or its therapeutic alternative), as well as treatment during follow-up according to NYHA functional class and treatments for potential adverse events.
For each compared alternative, the model estimated health care costs, life years gained (LYGs), and quality-adjusted life years (QALYs) gained. These values were used to calculate the outcome measures of the economic assessment: the incremental cost-effectiveness ratio and the incremental cost-utility ratio (ICUR) in each population. These ratios were calculated as follows:
Incremental cost-effectiveness ratio(populationx)=(S3 cost(populationx) – Alternative-treatment cost(populationx)) / (S3 LYGs(populationx) – Alternative-treatment LYGs(populationx)), expressed in €/LYG.
ICUR(populationx)=(S3 cost(populationx) –Alternative-treatment cost(poblationx)) / (S3 QALYs(populationx) – Alternative-treatment QALYs(populationx)), expressed in €/QALY.
The results express the cost increment associated with SE for each additional unit of benefit (LYG or QALY) versus the comparator treatment in each population (ISPs, HSPs, and IPs).
A medical technology was considered cost-effective if the outcome fell below the defined maximum threshold of €30 000/QALY.
Transition parameters and probabilitiesThe model considered the risk during follow-up of death and of a set of events and complications taken from previous studies.19–21 Risk was defined according to the PARTNER trials, following the VARC-2 criteria29: death, stroke, myocardial infarction, transient ischemic attack, atrial fibrillation, renal replacement therapy, pacemaker placement, major bleeding, vascular complications, hospitalization for heart failure, and reintervention (table 1).
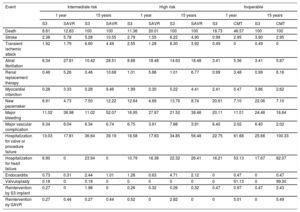
Clinical results stratified by surgical risk profile and intervention option
| Event | Intermediate risk | High risk | Inoperable | |||||||||
|---|---|---|---|---|---|---|---|---|---|---|---|---|
| 1 year | 15 years | 1 year | 15 years | 1 year | 15 years | |||||||
| S3 | SAVR | S3 | SAVR | S3 | SAVR | S3 | SAVR | S3 | CMT | S3 | CMT | |
| Death | 8.81 | 12.83 | 100 | 100 | 11.36 | 20.01 | 100 | 100 | 18.73 | 46.57 | 100 | 100 |
| Stroke | 2.38 | 5.78 | 5.28 | 10.55 | 2.79 | 1.55 | 6.22 | 4.90 | 0.99 | 2.95 | 3.90 | 2.95 |
| Transient ischemic attack | 1.92 | 1.79 | 6.60 | 4.49 | 2.55 | 1.28 | 8.30 | 3.92 | 0.49 | 0 | 0.49 | 0 |
| Atrial fibrillation | 6.34 | 27.81 | 10.42 | 28.51 | 8.88 | 18.48 | 14.63 | 18.48 | 3.41 | 5.36 | 3.41 | 5.87 |
| Renal replacement therapy | 0.46 | 5.26 | 0.46 | 10.68 | 1.01 | 5.86 | 1.01 | 6.77 | 0.99 | 3.48 | 0.99 | 6.16 |
| Myocardial infarction | 0.28 | 3.33 | 0.28 | 9.46 | 1.99 | 0.30 | 5.22 | 4.41 | 2.41 | 0.47 | 3.86 | 2.62 |
| New pacemaker | 6.91 | 4.73 | 7.50 | 12.22 | 12.64 | 4.69 | 13.76 | 8.74 | 20.61 | 7.10 | 22.06 | 7.10 |
| Major bleeding | 11.02 | 36.98 | 11.02 | 52.07 | 16.95 | 27.87 | 21.52 | 38.46 | 20.11 | 11.01 | 24.46 | 16.64 |
| Major vascular complication | 6.34 | 6.04 | 6.34 | 6.74 | 6.75 | 3.91 | 7.88 | 3.91 | 6.40 | 2.02 | 6.40 | 2.02 |
| Hospitalization for valve or procedure failure | 13.03 | 17.81 | 36.64 | 39.19 | 18.58 | 17.83 | 34.85 | 56.48 | 22.75 | 61.68 | 25.66 | 100.33 |
| Hospitalization for heart failure | 6.90 | 0 | 23.94 | 0 | 10.79 | 16.38 | 22.32 | 26.41 | 16.21 | 53.13 | 17.67 | 82.07 |
| Endocarditis | 0.73 | 0.31 | 2.44 | 1.01 | 1.28 | 0.63 | 4.71 | 2.12 | 0 | 0.47 | 0 | 0.47 |
| Valvuloplasty | 0.18 | 0 | 0.18 | 0 | 0 | 0 | 0 | 0 | 0 | 91.13 | 0 | 99.30 |
| Reintervention by S3 implant | 0.27 | 0 | 1.98 | 0 | 0.26 | 0.32 | 0.26 | 0.32 | 0.47 | 0.97 | 0.47 | 2.43 |
| Reintervention by SAVR | 0.27 | 0.44 | 0.27 | 0.44 | 0.52 | 0 | 2.82 | 0 | 0 | 5.01 | 0 | 5.49 |
CMT, conservative medical treatment; S3, SAPIEN 3; SAVR, surgical aortic valve replacement.
Values are expressed as percentages.
For the definition of health-state transition probabilities for S3 TAVI, clinical data were available for up to 12 months of follow-up. For SAVR, information was available for 2 years for ISPs and for 5 years for HSPs. This information was used to perform mortality projections (up to 0% survival for each alternative) according to a log linear function for ISPs and a Weibull distribution for HSPs. The choice of these functions was based on tests of goodness-of-fit (Akaike criterion and Bayesian information) and comparison of the predictions with general mortality.30 For potential complications, the model reproduces the trial results and projects occurrence over 15 years from the final values recorded during follow-up.
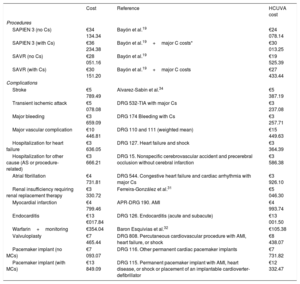
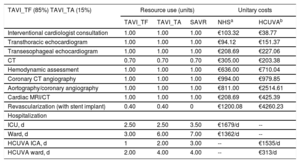
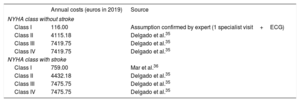
Costs and utilitiesCost estimates (euros in 2019) included the procedure, hospitalization, and complications after the intervention and during follow-up. Costs were assigned in a disaggregated manner according to published data19,31,32 and information provided by the accounts service at Hospital Clínico Universitario Virgen de la Arrixaca (HCUVA). Assessment of per-procedure costs included checks of diagnosis-related groups33 (table 2 and table 3). Costs during follow-up were estimated in relation to NYHA functional class (with or without stroke).34,35 An additional cost was assumed for patients with a history of stroke (table 4).36
Costs included in the model: procedures and complications
| Cost | Reference | HCUVA cost | |
|---|---|---|---|
| Procedures | |||
| SAPIEN 3 (no Cs) | €34 134.34 | Bayón et al.19 | €24 078.14 |
| SAPIEN 3 (with Cs) | €36 234.38 | Bayón et al.19+major C costs* | €30 013.25 |
| SAVR (no Cs) | €28 051.16 | Bayón et al.19 | €19 525.39 |
| SAVR (with Cs) | €30 151.20 | Bayón et al.19+major C costs | €27 433.44 |
| Complications | |||
| Stroke | €5 789.49 | Alvarez-Sabín et al.34 | €5 387.19 |
| Transient ischemic attack | €5 078.08 | DRG 532-TIA with major Cs | €3 237.08 |
| Major bleeding | €3 659.09 | DRG 174 Bleeding with Cs | €3 257.71 |
| Major vascular complication | €10 446.81 | DRG 110 and 111 (weighted mean) | €15 449.63 |
| Hospitalization for heart failure | €3 636.05 | DRG 127. Heart failure and shock | €3 364.39 |
| Hospitalization for other cause (AS or procedure-related) | €3 666.21 | DRG 15. Nonspecific cerebrovascular accident and precerebral occlusion without cerebral infarction | €3 586.38 |
| Atrial fibrillation | €4 731.81 | DRG 544. Congestive heart failure and cardiac arrhythmia with major Cs | €3 926.10 |
| Renal insufficiency requiring renal replacement therapy | €3 330.72 | Ferreira-González et al.31 | €5 046.30 |
| Myocardial infarction | €4 799.46 | APR-DRG 190. AMI | €4 993.74 |
| Endocarditis | €13 €017.84 | DRG 126. Endocarditis (acute and subacute) | €13 001.50 |
| Warfarin+monitoring | €354.04 | Baron Esquivias et al.32 | €105.38 |
| Valvuloplasty | €7 465.44 | DRG 808. Percutaneous cardiovascular procedure with AMI, heart failure, or shock | €8 438.07 |
| Pacemaker implant (no MCs) | €7 093.07 | DRG 116. Other permanent cardiac pacemaker implants | €7 731.82 |
| Pacemaker implant (with MCs) | €13 849.09 | DRG 115. Permanent pacemaker implant with AMI, heart disease, or shock or placement of an implantable cardioverter-defibrillator | €12 332.47 |
APR, all-patient refined; AS, aortic stenosis; C, complication; DRG, diagnosis-related group; HCUVA, Hospital Clínico Universitario Virgen de la Arrixaca; SAVR, surgical aortic valve replacement.
Preprocedure and hospitalization resource use
| TAVI_TF (85%) TAVI_TA (15%) | Resource use (units) | Unitary costs | |||
|---|---|---|---|---|---|
| TAVI_TF | TAVI_TA | SAVR | NHSa | HCUVAb | |
| Interventional cardiologist consultation | 1.00 | 1.00 | 1.00 | €103.32 | €38.77 |
| Transthoracic echocardiogram | 1.00 | 1.00 | 1.00 | €94.12 | €151.37 |
| Transesophageal echocardiogram | 1.00 | 1.00 | 1.00 | €208.69 | €227.06 |
| CT | 0.70 | 0.70 | 0.70 | €305.00 | €203.38 |
| Hemodynamic assessment | 1.00 | 1.00 | 1.00 | €636.00 | €710.04 |
| Coronary CT angiography | 1.00 | 1.00 | 1.00 | €994.00 | €979.85 |
| Aortography/coronary angiography | 1.00 | 1.00 | 1.00 | €811.00 | €2514.61 |
| Cardiac MRI/CT | 1.00 | 1.00 | 1.00 | €208.69 | €425.39 |
| Revascularization (with stent implant) | 0.40 | 0.40 | 0 | €1200.08 | €4260.23 |
| Hospitalization | |||||
| ICU, d | 2.50 | 2.50 | 3.50 | €1679/d | -- |
| Ward, d | 3.00 | 6.00 | 7.00 | €1362/d | -- |
| HCUVA ICA, d | 1 | 2.00 | 3.00 | -- | €1535/d |
| HCUVA ward, d | 2.00 | 4.00 | 4.00 | -- | €313/d |
CT, computed tomography; HCUVA, Hospital Clínico Universitario Virgen de la Arrixaca; MRI, magnetic resonance imaging; ICU, intensive care unit; NHS, National Health System; SAVR, surgical aortic valve replacement; TAVI_TA, transcatheter aortic valve implant via the transapical route; TAVI_TF, transcatheter aortic valve implant via the transfemoral route.
Clinical treatment costs during follow-up over a 15-year projected time horizon
| Annual costs (euros in 2019) | Source | |
|---|---|---|
| NYHA class without stroke | ||
| Class I | 116.00 | Assumption confirmed by expert (1 specialist visit+ECG) |
| Class II | 4115.18 | Delgado et al.35 |
| Class III | 7419.75 | Delgado et al.35 |
| Class IV | 7419.75 | Delgado et al.35 |
| NYHA class with stroke | ||
| Class I | 759.00 | Mar et al.36 |
| Class II | 4432.18 | Delgado et al.35 |
| Class III | 7475.75 | Delgado et al.35 |
| Class IV | 7475.75 | Delgado et al.35 |
ECG, electrocardiogram; NYHA, New York Heath Association (functional class).
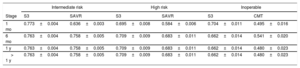
The utilities assigned to each health state were extracted from the PARTNER 2 trial using the EQ-5D tool.37,38 Necessary adjustments were made to weight for the Spanish population (table 5).14 No additional utility discounts were included because the values used were extracted throughout the trial follow-up period and thus already factor in the impact of the appearance of each event. This was done to avoid duplicating event impacts, as this would favor the less frequently used alternative (S3 TAVI).
Utilities in each risk profile assessed during follow-up
| Intermediate risk | High risk | Inoperable | ||||
|---|---|---|---|---|---|---|
| Stage | S3 | SAVR | S3 | SAVR | S3 | CMT |
| 1 mo | 0.773±0.004 | 0.636±0.003 | 0.695±0.008 | 0.584±0.006 | 0.704±0.011 | 0.495±0.016 |
| 6 mo | 0.763±0.004 | 0.758±0.005 | 0.709±0.009 | 0.683±0.011 | 0.662±0.014 | 0.541±0.020 |
| 1 y | 0.763±0.004 | 0.758±0.005 | 0.709±0.009 | 0.683±0.011 | 0.662±0.014 | 0.480±0.023 |
| > 1 y | 0.763±0.004 | 0.758±0.005 | 0.709±0.009 | 0.683±0.011 | 0.662±0.014 | 0.480±0.023 |
CMT, conservative medical treatment; S3, SAPIEN 3; SAVR, surgical aortic valve replacement.
Values are expressed as mean±standard deviation. Source: PARTNER.37,38
An annual discount rate of 3% was applied to costs and benefits.39
Uncertainty and sensitivity analysisAs mathematical representations of reality, Markov models are characterized by an inherent level of uncertainty, which needs to be considered. A number of analyses were conducted to confirm the structural validity of the model, beginning with a review by medical experts. Moreover, the robustness of the results was tested with a probabilistic sensitivity analysis that included 1000 Monte Carlo simulations of the ICUR. In addition to the distribution of the clinical parameters already mentioned, a Gamma distribution was assumed for costs and a Beta distribution for utilities, given their closer fit to the observed data. Using this analysis, multiple further estimates of the ICUR were generated for the full range of cost and benefit parameters; this was done to estimate the probability that the ICUR values would fall below the widely accepted thresholds. This was complemented with an analysis considering different percentage rates in the use of the transfemoral and transapical routes. The transapical route is generally associated with worse outcomes31,40 and in Spain tends to be used less frequently.
The analysis was repeated with data on health care resource use from a prospective study carried out at HCUVA. This hospital has extensive experience and defined protocols for AS and thus provides an interesting opportunity to examine the perspective of a center with a high TAVI volume. Information was collected on 76 consecutive patients fitted with an S3 implant over 1 year of follow-up. Mean patient age was 82.5 years, the mean Society of Thoracic Surgeons (STS) score was 5.33±3.37, and 81.6% of the patients had severe limitations (NYHA III or IV). These data were used to project outcomes over a 15-year time horizon from the intervention and additionally over a 1-year time horizon to provide a picture of the short-term impact of the service.
Ethics committeeData from HCUVA patients came from a prospective study approved by the HospitalClínico Universitario Virgen de la Arrixaca Clinical Research Ethics Committee on July 24, 2017 (ethics committee code 2017-6-5-HCUVA).
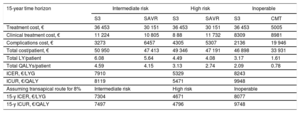
RESULTSOver a 15-year projected time horizon, S3 TAVI performed better than the alternative treatments in all analyzed groups. Among IPs, S3 TAVI was associated with 3.17 LYGs, almost double the figure for CMT (1.61 LYGs). S3 TAVI was also associated with increased life expectancy versus SAVR, both for HRPs (4.49 LYGs with S3 vs 4.08 LYGs with SAVR) and for IRPs (6.08 vs 5.64 LYGs). After adjustment for quality (utilities), differences in effectiveness were maintained when the alternative treatment was SAVR and were proportionately increased for IPs (2.09 QALYs with S3 vs 0.78 with CMT). For all scenarios, S3 TAVI entailed lower resource use during both procedure-related hospitalization and follow-up, owing to a lower rate of complications (table 1 and table 6).
Economic assessment of TAVI with SAPIEN 3: base case results from the Spanish collective perspective
| 15-year time horizon | Intermediate risk | High risk | Inoperable | |||
|---|---|---|---|---|---|---|
| S3 | SAVR | S3 | SAVR | S3 | CMT | |
| Treatment cost, € | 36 453 | 30 151 | 36 453 | 30 151 | 36 453 | 5005 |
| Clinical treatment cost, € | 11 224 | 10 805 | 8 88 | 11 732 | 8309 | 8981 |
| Complications cost, € | 3273 | 6457 | 4305 | 5307 | 2136 | 19 946 |
| Total cost/patient, € | 50 950 | 47 413 | 49 346 | 47 191 | 46 898 | 33 931 |
| Total LY/patient | 6.08 | 5.64 | 4.49 | 4.08 | 3.17 | 1.61 |
| Total QALYs/patient | 4.59 | 4.15 | 3.13 | 2.74 | 2.09 | 0.78 |
| ICER, €/LYG | 7910 | 5329 | 8243 | |||
| ICUR, €/QALY | 8119 | 5471 | 9948 | |||
| Assuming transapical route for 8% | Intermediate risk | High risk | Inoperable | |||
| 15-y ICER, €/LYG | 7304 | 4671 | 8077 | |||
| 15-y ICUR, €/QALY | 7497 | 4796 | 9748 | |||
CMT, conservative medical treatment; ICER, incremental cost-effectiveness ratio; ICUR, incremental cost-utility ratio; LY, life years; LYG, life year gained; QALY, quality-adjusted life year; S3, SAPIEN 3; SAVR, surgical aortic valve replacement
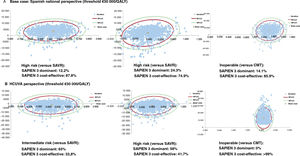
Based on these data, S3 TAVI was shown to be cost-effective in all 3 populations, with an ICUR below the widely accepted threshold of €30 000/QALY (table 6, fig. 2). The combined cost of acquiring S3 technology and the intervention itself is higher than that of conventional surgery and, of course, pharmacological treatment; however, this cost is compensated by the lower resource use for treating complications and the shorter hospital stays: 2.5 days in the intensive care unit vs 3.5 days for SAVR, and 3-6 days (depending on the percutaneous route) on the recovery ward vs 7 days for SAVR. The ICURs calculated from these data were €9948/QALY for PIs, €5471/QALY for HRPs, and €8199/QALY for IRPs (table 6).

Monte Carlo probabilistic sensitivity analysis with 1000 simulated calculations of the incremental cost-utility ratio for TAVI with the SAPIEN 3 valve prosthesis. 95%CI, 95% confidence interval; 99%CI, 99% confidence interval; CMT, conservative medical treatment; HCUVA, Hospital Clínico Universitario Virgen de la Arrixaca; QALY, quality-adjusted life years; SAVR, surgical aortic valve replacement.
In the probabilistic sensitivity analysis, S3 TAVI was a cost-effective option in 95% of simulations with IPs, 87.8% of simulations with HRPs, and 74.9% of those with IRPs (fig. 2).
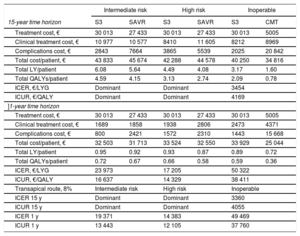
S3 TAVI was also the favored option in the analysis of scenarios based on resource use and costs at HCUVA (table 7, fig. 2). Moreover, the results showed little sensitivity to changes in relevant parameters, such as the time horizon defined in the analysis. S3 TAVI was cost-effective versus SAVR in IRPs and HRPs even when only the first year was considered (table 7). This pattern did not hold for the comparison with CMT in IPs, since medical treatment costs are lower than surgery and the 1-year time frame does not allow consideration of associated complications or longer-term resource use.
Economic assessment of TAVI with SAPIEN 3: sensitivity analysis from the perspective of Hospital Clínico Universitario Virgen de la Arrixaca (a center with a high volume of percutaneous implants)
| Intermediate risk | High risk | Inoperable | ||||
|---|---|---|---|---|---|---|
| 15-year time horizon | S3 | SAVR | S3 | SAVR | S3 | CMT |
| Treatment cost, € | 30 013 | 27 433 | 30 013 | 27 433 | 30 013 | 5005 |
| Clinical treatment cost, € | 10 977 | 10 577 | 8410 | 11 605 | 8212 | 8969 |
| Complications cost, € | 2843 | 7664 | 3865 | 5539 | 2025 | 20 842 |
| Total cost/patient, € | 43 833 | 45 674 | 42 288 | 44 578 | 40 250 | 34 816 |
| Total LY/patient | 6.08 | 5.64 | 4.49 | 4.08 | 3.17 | 1.60 |
| Total QALYs/patient | 4.59 | 4.15 | 3.13 | 2.74 | 2.09 | 0.78 |
| ICER, €/LYG | Dominant | Dominant | 3454 | |||
| ICUR, €/QALY | Dominant | Dominant | 4169 | |||
| ]1-year time horizon | ||||||
| Treatment cost, € | 30 013 | 27 433 | 30 013 | 27 433 | 30 013 | 5005 |
| Clinical treatment cost, € | 1689 | 1858 | 1938 | 2806 | 2473 | 4371 |
| Complications cost, € | 800 | 2421 | 1572 | 2310 | 1443 | 15 668 |
| Total cost/patient, € | 32 503 | 31 713 | 33 524 | 32 550 | 33 929 | 25 044 |
| Total LY/patient | 0.95 | 0.92 | 0.93 | 0.87 | 0.89 | 0.72 |
| Total QALYs/patient | 0.72 | 0.67 | 0.66 | 0.58 | 0.59 | 0.36 |
| ICER, €/LYG | 23 973 | 17 205 | 50 322 | |||
| ICUR, €/QALY | 16 637 | 14 329 | 38 411 | |||
| Transapical route, 8% | Intermediate risk | High risk | Inoperable | |||
| ICER 15 y | Dominant | Dominant | 3360 | |||
| ICUR 15 y | Dominant | Dominant | 4055 | |||
| ICER 1 y | 19 371 | 14 383 | 49 469 | |||
| ICUR 1 y | 13 443 | 12 105 | 37 760 | |||
CMT, conservative medical treatment; ICER, incremental cost-effectiveness ratio; ICUR, incremental cost-utility ratio; LY, life years; LYG, life year gained; QALY, quality-adjusted life year; S 3, SAPIEN 3; SAVR, surgical aortic valve replacement
TAVI has revolutionized the treatment of AS41 and is considered the first option for patients who are too vulnerable for surgery and those at high surgical risk. The S3 valve prosthesis won approval for use in low-risk patients after the PARTNER S3i study.17 Prior to this, the S3 valve had also been indicated, together with the EVOLUT device (Medtronic, United States), for patients with an intermediate risk (STS 4-8%).21 This expanded use requires a cost-benefit analysis, especially when the acquisition cost for TAVI is higher than that of the alternative.
In the current analysis, S3 TAVI was found to be a cost-effective and even economically dominant option for the treatment of AS in IRPs, HRPs, and PIs. The ICURs for all indications were below the thresholds established in Spain.42,43 The cost-utility ratios also compared favorably with those for other approved devices and pharmacological treatments.44–47
The results presented here agree with economic assessments conducted in France,23 Canada,22, and the United States,48 all of which found S3 TAVI to be economically dominant versus SAVR in IRPs. No previous study in Spain has examined the economic impact of the latest generation of valve prostheses. Our results are similar to those published in 2013 by Ferreira et al.31 on the cost-effectiveness of SAPIEN TAVI in HRPs over a 3-year time horizon. In contrast, in an earlier analysis over a similar time horizon, TAVI did not appear to be cost-effective.19 However, as the authors pointed out, that study lacked information about effectiveness that may have compensated the acquisition costs. Our study includes information from later trials and considers follow-up costs in relation to patients’ functional class; this closer match to patients’ true situation might explain the discrepancy between findings.
In another report, clinical practice data from 2011 to 2013 suggested that cost-effectiveness of TAVI would require a 30% reduction in implant costs and would also depend on the hospitalization costs and patient characterisitics.28 Our analysis considered shorter hospital stays that more accurately reflect current practice, both in the intensive care unit and on the recovery ward.
This view is supported by the analysis of economic data from HCUVA, which confirm that optimization of the implant procedure and postintervention recovery increases device cost-effectiveness and produces highly favorable outcomes in the first year. S3 TAVI is, moreover, associated with major reductions in intervention-related complications.22,23
The main limitation of the present study is that the information on benefits comes from studies conducted in relatively controlled situations.18,37 Obtaining more precise estimates will require the incorporation of nationwide evidence from real-world clinical practice.
It is also important to note that we compared the PARTNER 2 trial data on SAVR for IRPs (STS, 4-8%) with SAPIEN TAVI according to adjusted risk analysis.26 However, a recent meta-analysis indicates that the results with the S3 device are superior to those obtained with the previous prosthesis (SAPIEN XT).49 Another limitation is that our results apply only to the S3 valve; different percutaneous prostheses may perform differently, and should therefore be analyzed individually.50,51 Our analysis also did not consider the potentially determining factor of prosthesis durability; however, the rate of deterioration appears to be low (4% severe deterioration at 5 years in the FRANCE 2 registry52). It would also be interesting to study the effect of comorbidities that worsen prognosis, such as renal insufficiency and chronic pneumonia.53
CONCLUSIONSTreatment of AS by S3 TAVI is an effective option for IPs, HRPs, and IRPs and is, moreover, highly likely to be the most cost-effective strategy. With the increasing health care demands linked to population aging, there is a growing need for technological innovations that permit less invasive interventions to simplify procedures while maintaining clinical standards and optimizing resource use.
- –
Published clinical results have expanded the indication for TAVI to include symptomatic AS patients at intermediate or even low surgical risk.
- –
In Spain, there is a lack of studies based on the latest available evidence into the cost-effectiveness of TAVI with the S3 valve in IRPs.
- –
Compared with the therapeutic alternatives for each patient group, S3 TAVI is associated with lower health care resource use related to hospitalization and complications during follow-up.
- –
The S3 valve prosthesis is cost-effective for the treatment of severe AS in IRPs, HRPs, and IPs.
- –
In experienced centers, this favorable profile is evident 1 year after the intervention.
Edwards Lifesciences SL, Spain, provided funding for the economic assessment, but had no role in the authors’ planning, interpretation, or discussion of the analysis.
AUTHORS’ CONTRIBUTIONSE. Pinar participated in data acquisition, cost analysis, statistical treatments, results preparation, and manuscript writing and revision. J. García de Lara participated in data acquisition and manuscript writing. J. Hurtado participated in data acquisition and manuscript writing. M. Robles collaborated in the acquisition of economic data and manuscript writing. G. Leithold participated in data acquisition and manuscript writing. B. Martí-Sánchez participated in cost analysis, results preparation, and manuscript writing and revision. J. Cuervo participated in clinical data and cost analysis, statistical treatments, results preparation, and manuscript writing and revision. D.A. Pascual participated in data acquisition and manuscript writing. A. Estévez-Carrillo participated in clinical data and cost analysis, statistical treatments, results preparation, and manuscript writing. C. Crespo participated in clinical data and cost analysis, statistical treatments, results preparation, and manuscript writing. All the authors reviewed and approved the final text.
CONFLICTS OF INTERESTB. Martí-Sánchez is employed by Edwards Lifesciences. J. Cuervo, A. Estévez-Carrillo, and C. Crespo are members of Axentiva Solutions, which received consultancy fees from Edwards Lifesciences.