To assess the diagnostic yield and cost-effectiveness of a diagnostic protocol based on the systematic use of latest-generation external loop recorders (ELRs) compared with the classic diagnostic strategy for patients with recurrent unexplained palpitations.
MethodsTwo cohorts of consecutive patients referred for diagnosis of unexplained palpitations to the outpatient clinic of the arrhythmia unit were compared: a prospective cohort after the implementation of a new diagnostic protocol based on the systematic use of ELRs, and another, retrospective, cohort before the implementation of the protocol. The cost of diagnosis was calculated based on the number of complementary examinations, visits to outpatient clinics, or emergency department visits required to reach a diagnosis, and its costs according the prices published for the local health system.
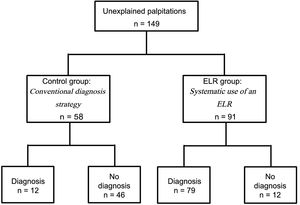
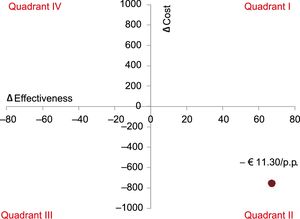
ResultsOne hundred and forty-nine patients were included (91 in the ELR group, 58 in the control group). The diagnostic yield was higher in the ELR group (79 [86.8%] definitive diagnoses in the ELR group vs 12 [20.7%] in the control group, P < .001). The cost per diagnosis was €375.13 in the ELR group and €5184.75 in the control group (P < .001). The cost-effectiveness study revealed that the systematic use of ELR resulted in a cost reduction of €11.30 for each percentage point of increase in diagnosis yield.
ConclusionsIn patients with recurrent unexplained palpitations, evaluation by means of a study protocol that considers the systematic use of a latest-generation ELR increases diagnostic yield while reducing the cost per diagnosis.
Keywords
Palpitations are a frequent reason for medical consultation that concerns patients and impacts their quality of life.1 Multiple etiologies are possible, and not all are arrhythmic in origin.2 It is always important to establish a definitive diagnosis, both to prescribe the correct treatment and to avoid unnecessary consultations and investigations when the cause is benign. Thus, it is essential to appropriately correlate patient symptoms and electrocardiographic recordings. However, making a diagnosis is not always easy because symptoms are usually transient, and the patient may be asymptomatic at the time of the examination.3
The classic diagnostic approach is based on an initial assessment of medical history, a physical examination, and a baseline electrocardiogram. If the cause of palpitations remains unknown, further tests will be necessary in line with the patient's characteristics. Tests may include laboratory tests, electrocardiographic monitoring, a stress test, or even more invasive procedures such as electrophysiology studies, leading to a significant usage of health care resources.1,4
Electrocardiographic recorder systems can be very useful in this context. Due to their being readily available, continuous monitoring using standard 24-48 hour Holter monitors remains the most common method used in clinical practice, despite its low diagnostic yield (12%-30%), especially for patients with sporadic symptoms.5,6 Nowadays, noninvasive systems enabling longer monitoring periods are available, such as external recorders activated by the patient or external loop recorders (ELR).7–9 Latest-generation ELRs incorporate relevant technological advantages such as extended memory or automatic arrhythmia recording algorithms. Several published analyses have reported a higher diagnostic yield using these devices.9,10 However, scarce data have been published in the medical literature assessing their usefulness when used in clinical practice systematically integrated into diagnosis protocols, both in terms of diagnostic yield and cost-effectiveness.
The aim of this study was to assess the diagnostic yield and the cost-effectiveness of a diagnostic protocol based on the systematic use of new-generation ELRs compared with the classic diagnostic strategy for patients with recurrent unexplained palpitations.
METHODSStudy DesignTwo cohorts of consecutive patients referred for diagnosis of unexplained palpitations to the outpatient clinic of the arrhythmia unit of a Spanish tertiary hospital were compared: one was prospective after the implementation of a new diagnostic protocol based on the systematic use of ELRs, and the other was a historical cohort of patients studied for the same reason before the implementation of the new diagnostic protocol.
The study was performed according to good clinical practice guidelines and the Declaration of Helsinki and complies with local ethics committee standards.
Patient EligibilityAdult patients examined due to palpitations of unknown origin, having experienced at least 2 episodes during the last 12 months and without a conclusive diagnosis after an initial medical evaluation including a baseline electrocardiogram and blood test were enrolled. Patients unable to use the device or complete the symptoms diary appropriately, whether due to mental or physical disability, were excluded.
Control Group-conventional Diagnostic StrategyThe conventional diagnostic strategy begins with an initial cardiac evaluation involving medical history, a physical examination, a resting electrocardiogram, an echocardiogram, and 24-hour Holter monitoring. According to the European Heart Rhythm Association1 recommendations and, depending on the clinical evaluation (clinical characteristics of palpitations, structural heart disease), other diagnostic tests may be necessary, such as an ergometry test or an electrophysiological study. If the patient is not diagnosed, outpatient visits continue at the center; examinations may be repeated at the clinician's discretion.
Experimental Group–new Protocol Based on Systematic Use of External Loop RecorderThe protocol includes an initial medical history evaluation, a physical examination, a resting electrocardiogram, echocardiography, and ambulatory monitoring for 21 days using a new-generation, high storage capacity, and extended-life lithium battery ELR (SpiderFlash-T, Sorin Group SRL, Saluggia, Italy) that was implanted in the same week as the inclusion visit. The device records 2 electrocardiogram leads on a high-capacity memory card and provides 3 modes of recording: a) manual activation in the event of symptoms; b) automatic activation at predefined intervals; and c) automatic activation in the event of specific heart rhythm disorders such as supraventricular tachycardia or ventricular tachycardia. The nursing team trains the patient on how to use the ELR and emphasizes the importance of proper use of the symptoms diary. If the patient is not diagnosed, further diagnostic examinations may be necessary, and the patient follow-up continues, similarly to the procedure for the control group.
Study PeriodThe new diagnostic protocol was put into practice at the study center in October 2012. From then on, patients were included prospectively in the experimental group until July 2014. Patients for the control group were included retrospectively starting in June 2009. All patients were prospectively followed up to the date when a diagnosis was made, or until July 2015 if no conclusive diagnosis was reached.
DefinitionsPalpitations are defined as a symptom reported by the patient consisting of the perception of an abnormal heartbeat, which may be hard, fast, and/or irregular, irrespective of its duration.
A diagnosis is confirmed when a correlation between the patient's symptoms and electrocardiographic recordings can be reliably established. Standard definitions of arrhythmia types are used.11 A diagnosis of nonarrhythmic palpitations is made when the patient clearly reports clinical symptoms but there is no significant change in baseline cardiac rhythm on the electrocardiographic recording.
Time to diagnosis is the period from the enrolment visit to the time when a center physician records a confirmed diagnosis in the patient's medical history.
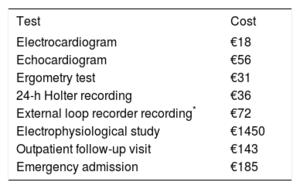
Cost AnalysisFor the cost analysis, we collected information from the patients’ medical histories in terms of outpatient visits and emergency admissions as well as tests performed until a diagnosis was reached. Cost assignment was done according to service delivery rates, applicable at the investigator's hospital (high technology center), published in Diari Oficial de la Generalitat de Catalunya12 (Table 1). The ELR recording cost was not included in the official rates. Twice the cost of a standard 24-hour Holter was considered appropriate, according to data published in other health systems.13
Service Delivery Rates
| Test | Cost |
|---|---|
| Electrocardiogram | €18 |
| Echocardiogram | €56 |
| Ergometry test | €31 |
| 24-h Holter recording | €36 |
| External loop recorder recording* | €72 |
| Electrophysiological study | €1450 |
| Outpatient follow-up visit | €143 |
| Emergency admission | €185 |
Service delivery rates applicable at the investigator's center (high-technology hospital), published in Diari Oficial de la Generalitat de Catalunya Number. 6323-26.2.2013.12
Cost of the external loop recorder is not reflected in the publication. Twice the cost of a standard 24-hour Holter was considered appropriate, according to data published in other health systems.13
For global cost calculation in both groups, an additive formula was applied including all costs of the different examinations and visits performed until a diagnosis was made or until the end of the follow-up if no confirmed diagnosis was made beforehand.
The incremental cost-effectiveness indicator was calculated using diagnostic yields and costs of conventional and alternative approaches.
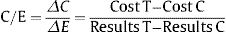
where T represents the technology or intervention under evaluation, and C identifies the reference or control technology.
Statistical AnalysisContinuous variables are described as mean ± standard deviation. For mean comparisons, the Student t test was used, and the Mann-Whitney U statistic was used when necessary. Category variables are expressed as the absolute value of cases and the percentage (%). Comparative proportions analysis was performed using the chi-square test, and the Fisher test was used when necessary. A multivariate logistic regression model was performed to estimate the effect of the treatment on diagnostic yield, accounting for possible confounders in baseline covariates (high blood pressure, frequency of symptoms, structural heart disease). The odds ratio with the 95% confidence interval (95%CI) was calculated. For the analysis of cost per diagnosis, a multivariate Poisson regression model was considered. Time-to-event was included as an offset. The estimated cost per day with the 95%CI was calculated. Statistical analysis was performed using the Statistics Package for the Social Sciences software 15.0 (IBM SPSS) for Windows (IBM Corporation, Armonk, New York, United States).
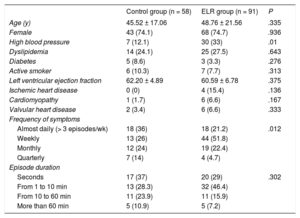
RESULTSBaseline CharacteristicsA total of 149 patients were included, 58 in the control group and 91 in the ELR group (Figure 1). The baseline characteristics and clinical characteristics of the palpitations are shown in Table 2; 86% of the patients in the control group and 95.3% of those in the experimental group (ELR group) experienced at least 1 episode of palpitations per month.

Characteristics of the Baseline Subgroup Populations and Clinical Characteristics of the Patients’ Palpitations
| Control group (n = 58) | ELR group (n = 91) | P | |
|---|---|---|---|
| Age (y) | 45.52 ± 17.06 | 48.76 ± 21.56 | .335 |
| Female | 43 (74.1) | 68 (74.7) | .936 |
| High blood pressure | 7 (12.1) | 30 (33) | .01 |
| Dyslipidemia | 14 (24.1) | 25 (27.5) | .643 |
| Diabetes | 5 (8.6) | 3 (3.3) | .276 |
| Active smoker | 6 (10.3) | 7 (7.7) | .313 |
| Left ventricular ejection fraction | 62.20 ± 4.89 | 60.59 ± 6.78 | .375 |
| Ischemic heart disease | 0 (0) | 4 (15.4) | .136 |
| Cardiomyopathy | 1 (1.7) | 6 (6.6) | .167 |
| Valvular heart disease | 2 (3.4) | 6 (6.6) | .333 |
| Frequency of symptoms | |||
| Almost daily (> 3 episodes/wk) | 18 (36) | 18 (21.2) | .012 |
| Weekly | 13 (26) | 44 (51.8) | |
| Monthly | 12 (24) | 19 (22.4) | |
| Quarterly | 7 (14) | 4 (4.7) | |
| Episode duration | |||
| Seconds | 17 (37) | 20 (29) | .302 |
| From 1 to 10 min | 13 (28.3) | 32 (46.4) | |
| From 10 to 60 min | 11 (23.9) | 11 (15.9) | |
| More than 60 min | 5 (10.9) | 5 (7.2) | |
ELR, external loop recorder. Data are expressed as No. (%) or mean ± standard deviation.
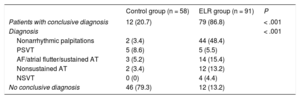
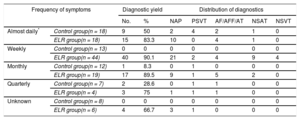
Of the control group patients, 20.7% were diagnosed vs 86.8% of the patients with a confirmed diagnosis in the experimental group (ELR group) (P < .001). The diagnostic percentages are shown in Table 3. Clinically significant arrhythmias were recorded in 17.2% of the control group patients and in 38.5% of those in the ELR group. The patients’ symptoms had no arrhythmic origin in 3.45% of patients in the control group and 48.5% of those in the ELR group. The diagnostic yield of the new protocol remained similar, despite the frequency of symptoms (Table 4). In the multivariate logistic regression model, the odds ratio for diagnosis in the ELR group vs the control group was 26.4 (95%CI, 8.4-82.9).
Diagnostic Yield and Distribution
| Control group (n = 58) | ELR group (n = 91) | P | |
|---|---|---|---|
| Patients with conclusive diagnosis | 12 (20.7) | 79 (86.8) | < .001 |
| Diagnosis | < .001 | ||
| Nonarrhythmic palpitations | 2 (3.4) | 44 (48.4) | |
| PSVT | 5 (8.6) | 5 (5.5) | |
| AF/atrial flutter/sustained AT | 3 (5.2) | 14 (15.4) | |
| Nonsustained AT | 2 (3.4) | 12 (13.2) | |
| NSVT | 0 (0) | 4 (4.4) | |
| No conclusive diagnosis | 46 (79.3) | 12 (13.2) | |
AF, atrial fibrillation; AT, atrial tachycardia; ELR, external loop recorder; NSVT, nonsustained ventricular tachycardia; PSVT, paroxysmal supraventricular tachycardia.
The data are expressed as No. (%).
Diagnostic Yield Stratification by Frequency of the Symptoms
| Frequency of symptoms | Diagnostic yield | Distribution of diagnostics | ||||||
|---|---|---|---|---|---|---|---|---|
| No. | % | NAP | PSVT | AF/AFF/AT | NSAT | NSVT | ||
| Almost daily* | Control group(n = 18) | 9 | 50 | 2 | 4 | 2 | 1 | 0 |
| ELR group(n = 18) | 15 | 83.3 | 10 | 0 | 4 | 1 | 0 | |
| Weekly | Control group(n = 13) | 0 | 0 | 0 | 0 | 0 | 0 | 0 |
| ELR group(n = 44) | 40 | 90.1 | 21 | 2 | 4 | 9 | 4 | |
| Monthly | Control group(n = 12) | 1 | 8.3 | 0 | 1 | 0 | 0 | 0 |
| ELR group(n = 19) | 17 | 89.5 | 9 | 1 | 5 | 2 | 0 | |
| Quarterly | Control group(n = 7) | 2 | 28.6 | 0 | 1 | 1 | 0 | 0 |
| ELR group(n = 4) | 3 | 75 | 1 | 1 | 1 | 0 | 0 | |
| Unknown | Control group(n = 8) | 0 | 0 | 0 | 0 | 0 | 0 | 0 |
| ELR group(n = 6) | 4 | 66.7 | 3 | 1 | 0 | 0 | 0 | |
AF, atrial fibrillation; AFF, atrial flutter; AT, atrial tachycardia; ELR, external loop recorder; NAP, nonarrhythmic palpitations; NSAT: nonsustained atrial tachycardia; NSVT, nonsustained ventricular tachycardia; PSVT, paroxysmal supraventricular tachycardia.
For diagnosed patients, the mean time to diagnosis was 204 days in the control group and 42 days in the ELR group.
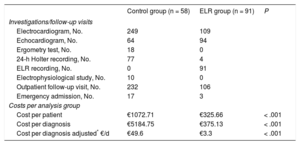
Cost Analysis per DiagnosisTable 5 summarizes all costs per group. The cost per patient and cost per diagnosis in the control group were €1072.71 and €5184.75, respectively, decreasing to €325.66 and €375.13, respectively, for the ELR group. From the Poisson regression model, the cost per diagnosis was €49.6/d (95%CI, €21.14-116.20/d) in the control group and €3.3/d (95%CI, €1.60-6.93 /d) in the ELR group (P < .001).
Investigations/follow-up Visits Carried out per Group and Costs per Analysis Group
| Control group (n = 58) | ELR group (n = 91) | P | |
|---|---|---|---|
| Investigations/follow-up visits | |||
| Electrocardiogram, No. | 249 | 109 | |
| Echocardiogram, No. | 64 | 94 | |
| Ergometry test, No. | 18 | 0 | |
| 24-h Holter recording, No. | 77 | 4 | |
| ELR recording, No. | 0 | 91 | |
| Electrophysiological study, No. | 10 | 0 | |
| Outpatient follow-up visit, No. | 232 | 106 | |
| Emergency admission, No. | 17 | 3 | |
| Costs per analysis group | |||
| Cost per patient | €1072.71 | €325.66 | < .001 |
| Cost per diagnosis | €5184.75 | €375.13 | < .001 |
| Cost per diagnosis adjusted* €/d | €49.6 | €3.3 | < .001 |
ELR, external loop recorder.
The cost-effectiveness study revealed that the systematic use of ELR resulted in a cost reduction of €11.30 for each percentage point of increase in diagnostic yield, which is represented in the cost-effectiveness plane shown in Figure 2.
. Conversely, when the results are in quadrant II, the new intervention is shown to be more effective and less expensive than the alternative. p.p., percentage point.")
Incremental cost-effectiveness plane. When the results are located in quadrant IV, the new intervention should be rejected because it is more expensive and less effective (intervention dominated). Conversely, when the results are in quadrant II, the new intervention is shown to be more effective and less expensive than the alternative. p.p., percentage point.
Palpitations are a frequent reason for medical consultation, and their diagnosis continues to be challenging for physicians. For many physicians, the standard diagnostic approach is still fundamentally based on 24-hour Holter ambulatory monitoring (following an initial cardiac evaluation with medical history and physical examination, reserving further examinations such as electrophysiological studies for selected cases). It offers a low diagnosis rate (12%-30%) because the symptoms tend to be intermittent and infrequent.5,6 Previous studies have demonstrated that event recorders offer a comparatively higher diagnostic rate, basically due to the prolonged monitoring period.10,14–16 Devices with a loop recorder system not only record the electrocardiogram at the right moment when the patient activates it manually but also extend electrocardiogram recording some minutes before the event. Moreover, new-generation devices have algorithms that enable automatic recording of arrhythmias. External loop recorder devices have a significantly lower cost compared with implantable Holter monitors, as well as the advantage of not requiring any invasive intervention, although the monitoring time is lower.9,16
The rate of confirmed diagnosis found in our study in both groups is consistent with rates reported in the literature with similar devices.10,14,15 In the SYNARR-Flash10 study designed to determine the diagnostic yield of the SpiderFlash device, a diagnostic rate of 71% was found for the group of patients with no documented palpitations. In our study, this rate increased to 86.8%, probably explained by a slightly higher frequency of symptoms in the study group. Likewise, the diagnostic yield is similar to that reported in the literature with the use of implantable Holter monitors in patients with similar characteristics to those included in our study.16
Compared with the conventional strategy, the systematic use of ELR enabled diagnosis of a higher percentage of both clinically significant arrhythmias and nonarrhythmic palpitations. Regarding palpitations of nonarrhythmic origin, the difference between the 2 groups was very noticeable. Whereas with a conventional strategy, the arrhythmic origin of the palpitations could be safely ruled out in 3.45% of the patients, the systematic use of the ELR allowed us to exclude up to 49.45%. Such diagnoses are also clinically relevant as they allow patients to avoid unnecessary clinical examinations and follow-up visits. Another clinically relevant aspect of the study is that, with the systematic use of an ELR, the time needed to make a diagnosis is short (42 days in our study). Short diagnosis times enable prompt therapy initiation in the event of significant arrhythmias, or provide peace of mind to patients in whom an arrhythmic origin of the symptoms is excluded.
In the cost analysis, systematic use of the ELR resulted in a significant decrease of €11.30 per percentage point of increase in the diagnostic efficiency. In other words, the ELR protocol is able to increase diagnostic efficiency by 67 percentage points while reducing the average cost per patient by €747.05, which means a relative cost reduction of 69.64%. In this way, the new intervention is dominant as it is located in quadrant II of the cost-effectiveness plane (Figure 2), such that the use of ELR in the diagnostic protocol for palpitations is most certainly recommended from an economic point of view.
LimitationsThis study has several limitations. First, it was a single center, nonrandomized, open study with a cohort of historical controls that could generate biases. We attempted to correct potential patient selection biases by defining strict inclusion and exclusion criteria and including consecutive patients in both groups. To avoid possible information biases, strict criteria for results were defined. However, due to nonrandomization, some differences were observed between groups, especially in symptom frequency, which could cause a results bias. Nevertheless, after adjustment for confounders, the diagnostic yield remained higher and the cost for diagnosis lower in the ELR group.
Another potential limitation is that the population studied is a selected population, with a low rate of structural heart disease and relatively frequent symptoms, such that the diagnostic yield of the ELR may be lower when used in a less selective group of patients or a group with more infrequent symptoms. It is also known that the diagnostic yield of electrophysiology study is greater in patients with significant structural heart disease.4
Finally, because this is a cohort comparative study and one of the cohorts is a historical cohort, secular trend changes in management of the patients may have influenced the results.
CONCLUSIONSIn patients with recurrent unexplained palpitations, evaluation by means of a study protocol that includes the systematic use of a new-generation ELR results in a higher diagnostic yield while reducing the cost per diagnosis.
FUNDINGThis work was funded by Instituto de Salud Carlos III, grant FIS PI14/1431, PI15/1655 co-financed by the European Regional Development Fund; CIBERCV and Fundació Marató TV3.
CONFLICTs OF INTERESTNone declared.
- –
Palpitations are one of the most frequent reasons for cardiology consultation, but their diagnosis remains a challenge for the cardiologist because symptoms are usually transient and the patient may be asymptomatic at the time of the examination.
- –
External loop recorders are noninvasive monitoring devices that are useful to study patients with palpitations, but their efficiency in clinical practice has not been studied in depth.
- –
A diagnostic protocol including the systematic use of an ELR to monitor patients with recurrent palpitations is able to increase the successful diagnosis rate from 20.7% to 86.8% compared with the usual diagnostic strategy.
- –
Additionally, time to diagnosis can be shortened from 204 to 42 days.
- –
We have shown that this protocol is cost-effective, resulting in a cost reduction of 69.6%.
The authors would like to thank the Vall d’Hebron arrhythmia unit nursing team for their contribution to patient enrolment. They also thank Mr. Mariano Barbero from LivaNova for the technical support.