
To develop a predictive function of lifetime cardiovascular risk, including morbidity and mortality, in a healthy working population in Spain.
MethodsRetrospective cohort study. We selected healthy workers, aged 18 to 65 years, with no history of cardiovascular disease, who underwent a health assessment between 2004 and 2007. We used 70% of the cohort to develop the risk equation, and the remaining 30% to validate the equation. Four Cox proportional hazards models were constructed using cardiovascular events and competing events as dependent variables. The same models were replicated for men and women separately. Fatal and nonfatal events were assessed until 2014.
ResultsA total of 762 054 individuals were selected. The mean age was 35.48 years and 71.14% were men. Significant risk variables in the model included manual occupations, being a smoker or exsmoker, diabetes mellitus, antihypertensive treatment, systolic blood pressure, total cholesterol, high-density lipoprotein cholesterol, and lipid-lowering treatment; in men, the model also included alcohol consumption, body mass index, a family history of early coronary disease in first-degree relatives, renal failure, and diastolic blood pressure. The area under the curve receiver operating characteristic was 0.84 (95%CI, 0.82-0.85) in men and 0.73 (95%CI, 0.66-0.80) in women. Calibration showed underestimation in low-risk deciles and overestimation in high-risk deciles.
ConclusionsThe new lifetime cardiovascular risk model has satisfactory discrimination and calibration, with better results in men than in women.
Keywords
Abbreviation
Cardiovascular diseases continue to be a major cause of morbidity, mortality, and disability.1
Primary prevention of these diseases aims to lower the risk of cardiovascular disease by combining different strategies. To maximize cost-effectiveness, these efforts mainly focus on persons considered to be at high risk, in order. Patients at higher cardiovascular risk are usually identified by cardiovascular risk (CVR) population calculations. Consequently, CVR calculators are an essential tool for primary prevention, as they are readily available and easy to use, making them an affordable approach to screening. Several clinical practice guidelines, such as the European Guidelines on Cardiovascular Prevention2 and its Spanish adaptation3 as well as the guidelines of the US Preventive Service Task Force4 and the NICE (National Institute for Clinical Excellence),5 already include CVR calculation among their cardiovascular disease prevention guidelines to implement various algorithms in clinical decision-making.
Numerous functions have been developed to estimate CVR based on a certain number of known CVR factors. These functions include the 10-year Framingham function6 for the US population, the SCORE function7 for European countries, and the updated QRISK3 algorithm8 based on primary care patient databases from England.
In the case of Spain, the researchers of the REGICOR study (Registre Gironí del Cor [Girona Heart Registry])9 performed a recalibration for the Spanish population, finding that the original Framingham function overestimates CVR. Likewise, the SCORE project provides specific tables for countries with a low incidence of cardiovascular disease and has also been adapted for Spain using data from the MONICA study (MONItoring Trends and Determinants in CArdiovascular Disease)-Catalonia.10 Recently, a study has been published on the validity of both equations, concluding that they significantly overestimate cardiovascular mortality among the Spanish population.11
The ICARIA (Ibermutuamur CArdiovascular RIsk Assessment) study, based on data obtained from occupational health assessments, showed high prevalences of CVR factors, metabolic syndrome, and patients with high CVR. A high incidence of nonfatal cardiovascular events has also been observed in patients with a moderate-to-high SCORE.12,13 Additionally, moderate-to-high CVR is associated with longer, more costly sick leave episodes due to cardiovascular and noncardiovascular illnesses, and an improvement in CVR has been seen to be accompanied by reduced sick leave during 1-year follow-up.14,15
Nevertheless, all these risk calculation tables, currently in use, estimate short-term risk, usually at 10 years, and can be used for middle-aged individuals aged 35 or 40 years or older. Most young adults, considered to have a low 10-year risk according to the current tables, would probably be at high risk if long-term or lifetime risk were analyzed. For this reason, the latest European guidelines for cardiovascular prevention recommend calculating lifetime risk, vascular age, or relative risk in young adults.2 Some cardiovascular primary prevention algorithms even recommend combining both tools and estimating the lifetime CVR of patients with low 10-year CVR.16 Furthermore, it has been observed that CVR factors are strongly implicated in subclinical arteriosclerosis prevalence and progression in individuals younger than 50 years.17 Along this line of research, a function has been developed to estimate the 30-year CVR of descendants of the original Framingham cohort,18 and even the lifetime risk,19–23 ie, the lifetime coronary, cerebrovascular, and CVR by using data obtained from numerous cohort studies conducted in the United States over the past 50 years. In England, a lifetime CVR function has also been developed from recently updated databases obtained by primary care physicians.24 These functions assign a long-term or lifetime probability of cardiovascular disease and are of particular interest among younger individuals, who usually do not have high short-term risk.
The aim of the present study was to prepare a predictive function of lifetime CVR (IBERLIFERISK) for fatal and nonfatal cardiovascular events in the Spanish working population.
METHODSThis study was based on a retrospective cohort design with 7 to 10 years of follow-up. To conduct the study, we selected employees aged 18 to 65 years who were working for member companies of a large nationwide occupational insurance firm (Ibermutuamur), who had no history of cardiovascular disease, and who had passed an occupational health assessment at the Sociedad de Prevención de Ibermutuamur (now Cualtis) between 2004 and 2007. Informed consent was obtained from all participants prior to enrollment in the study, in accordance with the principles set forth in the Declaration of Helsinki. The protocol was reviewed and approved by the respective ethics committee.
The usual information for an ordinary health assessment was recorded at the baseline visit: sociodemographic variables, company industry (coded according to the National Business Activity Code, 1994 version), and clinical variables, such as other disease history, active drug therapy, and anthropometric and laboratory values.
The study collected information from Ibermutuamur's official records on all study participants’ sick leave episodes from the date of enrollment until 31 December 2014. For participants who withdrew from the study for other reasons (change in insurance firm, unemployment) before the data lock point, information was requested from the National Statistics Institute for all study participants and was available for mortality but not for nonfatal cardiovascular events.
The primary outcome variable, namely, incidence of fatal or nonfatal cardiovascular event, was coded using the ICD-9-CM (International Classification of Diseases, Ninth Revision, Clinical Modification), 2002: ischemic heart disease (codes 410-414), heart failure (code 428), cerebrovascular disease (codes 431-438, except 432.1, 437.2, 437.3, and 437.7), and peripheral arterial disease (codes 440-444, except 442, 443.0, and 443.1). Fatal cardiovascular events also included deaths where the cause was coded as hypertensive disease (codes 401-405) or arrhythmia (codes 426-427, except 427.5).
For purposes of analysis, the study cohort was randomly distributed into 2 groups at a ratio of 7:3. The larger cohort comprised 70% of all participants (referral cohort) and was used to develop the CVR lifetime equation in the Spanish working population, whereas the other (validation) cohort included the remaining 30% and was used to validate the CVR equation developed in the first cohort.
Statistical AnalysisAll statistical analyses were performed using STATA14. To maximize usable information, multiple imputation was used for any missing primary endpoint values. Systolic and diastolic pressure values, total cholesterol, high-density lipoprotein cholesterol, and body mass index were imputed, as they are classic variables already used in other CVR calculators. Imputation was performed using the Mi impute function of STATA, an iterative stochastic method of imputation in which the distribution of observed data is used to estimate multiple values that reflect the uncertainty of the actual values. The imputations were performed by applying a data augmentation algorithm using a Markov chain Monte Carlo iterative method, separately for each cohort and stratifying by sex.25 A total of 20 imputations were generated which combined the effect of the estimates by following Rubin's rule.26
Development of the Risk Model EquationTo allow the CVR rates to be estimated for all age brackets, whether the youngest participant at the start of the study (age 18 years) or the oldest at the end (age 75 years), age was used as a latent function. To do so, the following key dates were defined: date of birth, date of assessment (study start date, ie, date the individual was event-free and began the observation period), and end date of follow-up (date of fatal or nonfatal cardiovascular event, date of loss to follow-up, or data lock point, set as 31 December 2014 to coincide with the mortality data available). Following classic cause-specific risk estimation models, 2 independent regression models were constructed and combined to take into account the presence of competing risks in risk estimation. Four Cox proportional hazards models were constructed, reproducing 2 different equations for each sex and including the same variables. One of them used the occurrence of fatal and nonfatal cardiovascular events as a dependent variable, whereas the complementary model used the occurrence of any competing event, ie, death by any other cause. The proportionality assumptions that the Cox proportional hazards model requires for each of the 4 models were checked, both analytically and graphically.
To develop the cumulative incidence function of cardiovascular disease, the contribution of CVR at a particular age was multiplied by the probability of being alive and free of cardiovascular events at that age, and those values were totaled over the age bracket of interest.27 This approach includes the cohort effect when calculating risks for all ages and all age brackets possible.
Validation of the Risk Model EquationThe formula obtained to calculate CVR in the referral cohort was applied to all participants in the validation cohort, and the risk scores expected according to the model were calculated. The calibration was performed by plotting the proportion of expected events and the proportion of 5-year events by risk decile. The proportion of observed events was estimated using the Nelson-Aalen28 nonparametric estimator for cumulative hazard rate function, which includes the presence of competing events (deaths by any other cause) by taking participants with censored data into account in the calculation. Discrimination was evaluated by calculating the area under the ROC (receiver operating characteristics) curve.
RESULTSStudy Population CharacteristicsA total of 762 054 participants aged 18 to 65 (mean, 35.48 ± 10.56) years who met the inclusion criteria were selected. Of these, 71.14% were men. The referral cohort included 533 439 participants randomly selected from all participants; a total of 2694 cardiovascular events were recorded among men and 266 among women, with a total follow-up of 2 444 546.1 and 1 025 303.3 person-years, respectively, and 4706 and 610 competing events in men and women. The validation cohort had 1187 cardiovascular events among men and 122 among women, with a total follow-up of 1 049 337.7 and 439 717.55 person-years, and 1994 and 319 competing events in men and women.
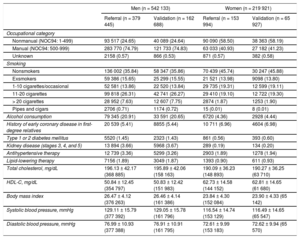
When both cohorts were combined, mean age was 35.94 ± 10.87 years in men and 34.23 ± 9.63 years in women; men were more likely to have a manual occupation (74.80%) than women (41.02%), were more likely to be smokers or exsmokers (64.15% vs 54.22%), and were more likely to consume alcohol at any level (70.54% vs 45.89%). In terms of medical history, 1853 (0.34%) men and 445 (0.20%) women had type 1 diabetes mellitus, and 5990 (1.10%) men and 809 (0.37%) women had type 2 diabetes mellitus; 5.75% of men and 2.9% of women had hypertension, and 6.55% and 3.84% had dyslipidemia. The 2 study cohorts showed a similar distribution (Table 1).
Baseline Values for Referral and Validation Cohorts
| Men (n = 542 133) | Women (n = 219 921) | |||
|---|---|---|---|---|
| Referral (n = 379 445) | Validation (n = 162 688) | Referral (n = 153 994) | Validation (n = 65 927) | |
| Occupational category | ||||
| Nonmanual (NOC94: 1-499) | 93 517 (24.65) | 40 089 (24.64) | 90 090 (58.50) | 38 363 (58.19) |
| Manual (NOC94: 500-999) | 283 770 (74.79) | 121 733 (74.83) | 63 033 (40.93) | 27 182 (41.23) |
| Unknown | 2158 (0.57) | 866 (0.53) | 871 (0.57) | 382 (0.58) |
| Smoking | ||||
| Nonsmokers | 136 002 (35.84) | 58 347 (35.86) | 70 439 (45.74) | 30 247 (45.88) |
| Exsmokers | 59 386 (15.65) | 25 299 (15.55) | 21 521 (13.98) | 9098 (13.80) |
| 1-10 cigarettes/occasional | 52 581 (13.86) | 22 520 (13.84) | 29 735 (19.31) | 12 599 (19.11) |
| 11-20 cigarettes | 99 818 (26.31) | 42 741 (26.27) | 29 410 (19.10) | 12 722 (19.30) |
| > 20 cigarettes | 28 952 (7.63) | 12 607 (7.75) | 2874 (1.87) | 1253 (1.90) |
| Pipes and cigars | 2706 (0.71) | 1174 (0.72) | 15 (0.01) | 8 (0.01) |
| Alcohol consumption | 79 345 (20.91) | 33 591 (20.65) | 6720 (4.36) | 2928 (4.44) |
| History of early coronary disease in first-degree relatives | 20 539 (5.41) | 8855 (5.44) | 10 711 (6.96) | 4604 (6.98) |
| Type 1 or 2 diabetes mellitus | 5520 (1.45) | 2323 (1.43) | 861 (0.56) | 393 (0.60) |
| Kidney disease (stages 3, 4, and 5) | 13 894 (3.66) | 5968 (3.67) | 289 (0.19) | 134 (0.20) |
| Antihypertensive therapy | 12 739 (3.36) | 5299 (3.26) | 2903 (1.89) | 1278 (1.94) |
| Lipid-lowering therapy | 7156 (1.89) | 3049 (1.87) | 1393 (0.90) | 611 (0.93) |
| Total cholesterol, mg/dL | 196.13 ± 42.17 (368 885) | 195.89 ± 42.06 (158 163) | 190.09 ± 36.23 (148 893) | 190.27 ± 36.25 (63 710) |
| HDL-C, mg/dL | 50.84 ± 12.45 (354 797) | 50.83 ± 12.42 (151 983) | 62.73 ± 14.58 (144 152) | 62.81 ± 14.65 (61 680) |
| Body mass index | 26.47 ± 4.12 (376 263) | 26.46 ± 4.14 (161 386) | 23.84 ± 4.30 (152 084) | 23.90 ± 4.33 (65 142) |
| Systolic blood pressure, mmHg | 129.11 ± 15.79 (377 392) | 129.05 ± 15.78 (161 796) | 116.54 ± 14.74 (153 129) | 116.49 ± 14.65 (65 547) |
| Diastolic blood pressure, mmHg | 76.99 ± 10.93 (377 388) | 76.91 ± 10.91 (161 795) | 72.61 ± 9.99 (153 183) | 72.62 ± 9.94 (65 570) |
HDL-C, high-density lipoprotein cholesterol; NOC, National Occupational Classification.
Data are expressed as No. (%) or mean ± standard deviation.
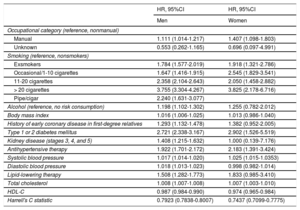
In the CVR model developed, significant CVR factors were found to be manual occupation, smoker or exsmoker, diabetes mellitus, antihypertensive therapy, systolic blood pressure values, lipid-lowering agent, and total cholesterol values; other factors found in men were alcohol consumption, body mass index, a history of coronary disease in first-degree relatives, kidney disease, and diastolic blood pressure values. High-density lipoprotein cholesterol levels were a protective factor for both men and women (Table 2). The risk predictors for the competing risks model are listed in Table 3.
Cardiovascular Disease Hazard Ratios Adjusted by Individual Predictor Variables in the Referral Cohort
| HR, 95%CI | HR, 95%CI | |
|---|---|---|
| Men | Women | |
| Occupational category (reference, nonmanual) | ||
| Manual | 1.111 (1.014-1.217) | 1.407 (1.098-1.803) |
| Unknown | 0.553 (0.262-1.165) | 0.696 (0.097-4.991) |
| Smoking (reference, nonsmokers) | ||
| Exsmokers | 1.784 (1.577-2.019) | 1.918 (1.321-2.786) |
| Occasional/1-10 cigarettes | 1.647 (1.416-1.915) | 2.545 (1.829-3.541) |
| 11-20 cigarettes | 2.358 (2.104-2.643) | 2.050 (1.458-2.882) |
| > 20 cigarettes | 3.755 (3.304-4.267) | 3.825 (2.178-6.716) |
| Pipe/cigar | 2.240 (1.631-3.077) | |
| Alcohol (reference, no risk consumption) | 1.198 (1.102-1.302) | 1.255 (0.782-2.012) |
| Body mass index | 1.016 (1.006-1.025) | 1.013 (0.986-1.040) |
| History of early coronary disease in first-degree relatives | 1.293 (1.132-1.478) | 1.382 (0.952-2.005) |
| Type 1 or 2 diabetes mellitus | 2.721 (2.338-3.167) | 2.902 (1.526-5.519) |
| Kidney disease (stages 3, 4, and 5) | 1.408 (1.215-1.632) | 1.000 (0.139-7.176) |
| Antihypertensive therapy | 1.922 (1.701-2.172) | 2.183 (1.391-3.424) |
| Systolic blood pressure | 1.017 (1.014-1.020) | 1.025 (1.015-1.0353) |
| Diastolic blood pressure | 1.018 (1.013-1.023) | 0.998 (0.982-1.014) |
| Lipid-lowering therapy | 1.508 (1.282-1.773) | 1.833 (0.985-3.410) |
| Total cholesterol | 1.008 (1.007-1.008) | 1.007 (1.003-1.010) |
| HDL-C | 0.987 (0.984-0.990) | 0.974 (0.965-0.984) |
| Harrell's C statistic | 0.7923 (0.7838-0.8007) | 0.7437 (0.7099-0.7775) |
95%CI, 95% confidence interval; HDL-C, high-density lipoprotein cholesterol; HR, hazard ratio.
Competing Event Mortality Hazard Ratios Adjusted by Individual Predictor Variables in the Referral Cohort
| HR, 95%CI | HR, 95%CI | |
|---|---|---|
| Men | Women | |
| Occupational category (reference, nonmanual) | ||
| Manual | 1.453 (1.346-1.569) | 1.525 (1.296-1.795) |
| Unknown | 1.223 (0.810-1.857) | 0.686 (0.171-2.760) |
| Smoking (reference, nonsmokers) | ||
| Exsmokers | 1.655 (1.503-1.823) | 1.212 (0.943-1.557) |
| Occasional/1-10 cigarettes | 1.586 (1.420-1.771) | 1.317 (1.045-1.658) |
| 11-20 cigarettes | 2.321 (2.133-2.525) | 1.813 (1.477-2.227) |
| > 20 cigarettes | 4.178 (3.800-4.593) | 2.787 (1.894-4.101) |
| Pipe/cigar | 1.716 (1.282-2.299) | |
| Alcohol (reference, no risk consumption) | 1.551 (1.457-1.651) | 1.506 (1.126-2.013) |
| Body mass index | 0.988 (0.980-0.996) | 1.031 (1.012-1.050) |
| History of early coronary disease in first-degree relatives | 0.933 (0.827-1.054) | 0.843 (0.618-1.151) |
| Type 1 or 2 diabetes mellitus | 2.661 (2.331-3.038) | 1.360 (0.667-2.771) |
| Kidney disease (stages 3, 4, and 5) | 1.420 (1.254-1.609) | 3.078 (1.362-6.957) |
| Antihypertensive therapy | 1.854 (1.663-2.066) | 1.609 (1.106-2.342) |
| Systolic blood pressure | 1.015 (1.013-1.017) | 1.010 (1.002-1.017) |
| Diastolic blood pressure | 1.008 (1.004-1.012) | 1.005 (0.994-1.017) |
| Lipid-lowering therapy | 1.080 (0.920-1.268) | 1.597 (0.953-2.675) |
| Total cholesterol | 1.001 (1.001-1.002) | 1.006 (1.004-1.008) |
| HDL-C | 1.008 (1.006-1.010) | 0.999 (0.994-1.006) |
| Harrell's C statistic | 0.7101 (0.7021-0.7181) | 0.6700 (0.6467-0.6933) |
95%CI, 95% confidence interval; HDL-C, high-density lipoprotein cholesterol; HR, hazard ratio.
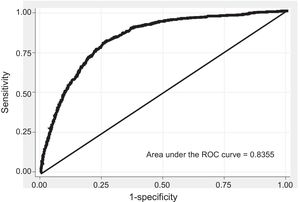
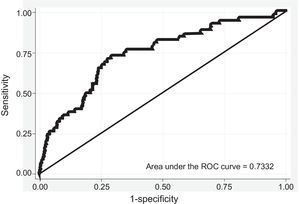
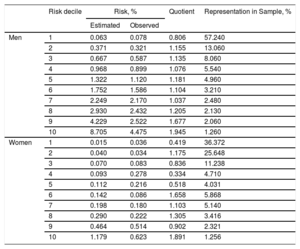
The discrimination of the model was calculated from the area under the ROC curve in the validation cohort, evaluated after 5 years of follow-up; the values obtained were > 0.84 (95% confidence interval [95%CI], 0.82-0,85) in men (Figure 1) and > 0.73 (95%CI, 0.66-0.80) in women (Figure 2). The calibration is shown in Table 4, stated as 5-year predicted and observed risks and predicted-to-observed risk ratio, taking noncardiovascular death as a competing event and stratifying by risk deciles. Risk was slightly underestimated in men in the first risk decile and in women of the first, fourth, and fifth deciles, and was underestimated in men in the last risk deciles and in women in the sixth and last decile. The first risk decile included 57% of men and 36% of women, whereas the last decile included 1.26% of men and women.


Estimated Versus Observed 5-year Cardiovascular Risk, According to Risk Decile in the Validation Cohort
| Risk decile | Risk, % | Quotient | Representation in Sample, % | ||
|---|---|---|---|---|---|
| Estimated | Observed | ||||
| Men | 1 | 0.063 | 0.078 | 0.806 | 57.240 |
| 2 | 0.371 | 0.321 | 1.155 | 13.060 | |
| 3 | 0.667 | 0.587 | 1.135 | 8.060 | |
| 4 | 0.968 | 0.899 | 1.076 | 5.540 | |
| 5 | 1.322 | 1.120 | 1.181 | 4.960 | |
| 6 | 1.752 | 1.586 | 1.104 | 3.210 | |
| 7 | 2.249 | 2.170 | 1.037 | 2.480 | |
| 8 | 2.930 | 2.432 | 1.205 | 2.130 | |
| 9 | 4.229 | 2.522 | 1.677 | 2.060 | |
| 10 | 8.705 | 4.475 | 1.945 | 1.260 | |
| Women | 1 | 0.015 | 0.036 | 0.419 | 36.372 |
| 2 | 0.040 | 0.034 | 1.175 | 25.648 | |
| 3 | 0.070 | 0.083 | 0.836 | 11.238 | |
| 4 | 0.093 | 0.278 | 0.334 | 4.710 | |
| 5 | 0.112 | 0.216 | 0.518 | 4.031 | |
| 6 | 0.142 | 0.086 | 1.658 | 5.868 | |
| 7 | 0.198 | 0.180 | 1.103 | 5.140 | |
| 8 | 0.290 | 0.222 | 1.305 | 3.416 | |
| 9 | 0.464 | 0.514 | 0.902 | 2.321 | |
| 10 | 1.179 | 0.623 | 1.891 | 1.256 | |
The present study obtained a model to calculate the lifetime CVR (IBERLIFERISK) from age 18 to 75 years in the Spanish working population.
The study found that use of the lifetime risk identifies more high-risk patients and reclassifies others from moderate risk to high risk. A study comparing the lifetime risk of the American College of Cardiology/American Heart Association model and of QRISK observed that 1.61% (95%CI, 1.55-1.66) patients were reclassified from moderate risk to high risk according to QRISK and 27.1% (95%CI, 27.11-27.70) according to the American College of Cardiology/American Heart Association score.29 Another study based on the 30-year Framingham model reclassified around 70% as high risk and also discriminated between participants with and without evidence of carotid plaques.30
Consistent with the QRISK lifetime risk model, our model is also flexible and allows risk to be calculated in different age brackets, not necessarily lifetime (in our case, up to age 75 years) but also allows CVR to be calculated at 5, 10, 15 years, or any whole number from the participant's age up to age 75 years.
The discrimination obtained from the model was satisfactory, with an area under the ROC curve of 0.84 (95%CI, 0.82-0.85) in men and 0.73 (95%CI, 0.66-0.80) in women. The QRISK model had an area under the ROC curve of 0.842 (95%CI, 0.840-0.844) in women and 0.828 (95%CI, 0.826-0.830) in men.
Calibration was better for men than for women. The validation was performed using data up to 5 years of follow-up, as this was the follow-up period of most participants in the sample. The calibration was repeated with 8-year data (median follow-up), which showed similar results to those obtained at 5 years (data not shown). One of the reasons for these calibration differences may be the low number of cardiovascular events, particularly in women. Mortality data were obtained from the National Statistics Institute; hence, loss of fatal events is unlikely although nonfatal cardiovascular events may have been lost. Although information is usually collected on this type of event and the analyses also considered any possible losses to follow-up, information could have been lost about nonfatal events in participants who switched their insurance or became unemployed. This study observed only 0.56% cardiovascular events and 1% competing events in the referral cohort, vs 5.19% and 6.34% reported by the QRISK lifetime risk calculation.24 The differences between our results and those obtained by QRISK could be explained, at least partially, by the fact that our population was much younger, with a mean age of 35 years, whereas the mean age was 48 years for QRISK. However, the follow-up time of this study (6.5 years on average) was very similar to that of QRISK (7 years). Some authors consider it necessary to observe 40 to 50 events per endpoint included in the predicted model for their estimate to be valid and reliable.31
The results of our study indicate that men's risk is overestimated, specifically in the high-risk deciles. In women, more erratic behavior was observed in the low-risk deciles and better adjustment in the high-risk deciles, except for the last decile, in which the model overestimates the risk. The QRISK function24 slightly underestimates the risk in the low-risk levels, but shows satisfactory calibration at higher risk.
The lifetime CVR model developed for the Spanish population, like those developed in the United Kingdom (QRISK) and in the United States (American College of Cardiology/American Heart Association), still raises questions that should be answered before the model can be recommended for clinical practice. There is no evidence regarding the actual threshold for considering a patient at high risk according to the lifetime risk, although some authors24 recommend using the 90th percentile value, which would correspond to a threshold > 50%.
There is also no evidence on the very long-term benefits (beyond those observed in clinical trials) of antihypertensive or lipid-lowering agents in young patients with a high lifetime CVR, although it is true that long-term benefits have been reported by post-trial follow-up studies, for instance, by the Heart Protection Study32 on statin use.
Like relative risk or vascular age, lifetime CVR may be a useful tool to improve communication with patients at low-to-moderate absolute 10-year risk, thus raising their awareness of the importance of CVR and encouraging them to make changes needed to acquire healthy habits. Although the lifetime risk model was derived from a different sample than the one used later to validate it, it is always desirable to perform a validation in a completely different sample from the study sample. This external validation is expected to be performed with 2 different samples: one of them would be a cohort of Ibermutuamur workers who pass a health assessment during 2008 and 2009 and another would be a sample of primary care patients. This score will also be compared with other lifetime risk scores (QRISK and American Heart Association) to assess its applicability. Likewise, a platform is being developed to calculate lifetime risk individually, as done by the QRISK investigators, as it is not viable to create a table listing all the combinations of the risk factors included in the model or to calculate risk from the individual's age up to any higher age.
CONCLUSIONSThis study has obtained a model to calculate lifetime CVR (IBERLIFERISK) in the Spanish working population aged 18 to 75 years. The model showed satisfactory discrimination and calibration, but was better in men than in women.
FUNDINGProject coordinated and funded by the Fondo de Investigaciones Sanitarias (Health Research Fund) (PI14/01177), Carlos III Health Institute, Ministry of Economy and Competitiveness.
CONFLICTS OF INTERESTNone declared.
- –
The lifetime CVR may be a useful tool for patients with a moderate 10-year CVR.
- –
Two methods are used to calculate lifetime CVR, one developed in the United Kingdom (QRISK) and the other in the United States (American College of Cardiology/American Heart Association).
- –
A lifetime CVR equation has been developed in the Spanish working population and may be useful for patients with a low-to-moderate short-term absolute CVR but high lifetime CVR, particularly to encourage more intense lifestyle changes.
We would like express our appreciation to Dr Joan Vila from the IMIM (Institut Hospital del Mar d’Investigacions Mèdiques [Hospital del Mar Institute for Medical Research]) for his review of the study methodology.