At-rest echocardiography is a poor predictor of exercise capacity in patients with hypertrophic cardiomyopathy. We aimed to test the performance of treadmill exercise Doppler echocardiography in the prediction of functional limitations in these patients.
MethodsEighty-seven consecutive patients with hypertrophic cardiomyopathy underwent treadmill exercise echocardiography with direct measurement of oxygen consumption. Both at rest and at peak exercise, the mitral inflow, mitral regurgitation, left ventricular outflow tract obstruction and mitral annulus velocities were assessed.
ResultsForty-three patients developed left ventricular outflow tract obstruction during exercise, which significantly decreased oxygen consumption (21.3 [5.7] mL/kg/min vs 24.6 [6.1] mL/kg/min; P=.012), and had greater left atrial volume (42.1 [14.5] mL/m2 vs 31.1 [11.6] mL/m2; P<.001) and a higher degree of mitral regurgitation and E/E’ ratio during exercise. Exercise variables improved the predictive value of functional capacity (adjusted R2 rose from 0.38 to 0.49). Independent predictors of oxygen consumption were age, left atrial volume, E/E’ ratio and the presence of left ventricular outflow tract obstruction. In a subset of patients without left ventricular outflow obstruction, only left ventricular and atrial volume indexes were independent predictors of exercise capacity.
ConclusionsIn patients with hypertrophic cardiomyopathy, left ventricular outflow tract obstruction and left atrial volume are the main predictors of exercise capacity. Exercise echocardiography is a better predictor of functional performance than at-rest echocardiography, although its predictive power is under 50%. In nonobstructed patients, left atrial and ventricular volumes were the independent factors.
Keywords
.
IntroductionExercise intolerance is the most common symptom in patients with hypertrophic cardiomyopathy (HCM).1,2 The majority of patients are incapable of increasing their oxygen consumption (VO2) during exercise as the result of an inability to increase systolic volume.3,4 Left ventricular outflow (LVOT) tract obstruction, mitral regurgitation, prolonged isovolumetric relaxation, and an increased stiffness of the ventricular chamber are the underlying pathophysiologic mechanisms.3–6
Doppler ultrasound evaluation of these patients facilitates an estimation of the gradient in the LVOT, mitral regurgitation, and filling pressures.7–11 However, in patients with HCM at-rest Doppler indexes have been shown to be poorly correlated with capacity for exercise and left atrial pressure12-15 and, during exercise, the mechanisms involved can be different for each patient. Some patients suffer significant obstruction that is not present at rest or increases with exercise when various levels of mitral regurgitation are present.6 On other occasions, diastolic dysfunction is the primary limiting mechanism.4
The majority of studies performed until now have attempted to correlate Doppler ultrasound values in at-rest tests with exercise test results. Few studies have compared exercise Doppler ultrasound values with maximum oxygen consumption (VO2max) and none have considered obstruction as an independent qualitative value in the pressure gradient reached during exercise.
Our study combines cardiopulmonary test results with expired gas analysis and Doppler ultrasound during exercise in order to describe exercise-induced changes in Doppler fluctuations and determine which factors are involved in functional limitations experienced by patients with and without LVOT obstruction.
MethodsStudy PopulationWe examined a consecutive cohort of patients with HCM who were referred to our hospital for Doppler ultrasound during exercise and cardiopulmonary tests. HCM was diagnosed in the presence of nondilated hypertrophic left ventricle (LV) with a maximum thickness of ≤15mm in index cases or >12mm in their family members, and with no other possible cause.16
We performed a complete clinical evaluation of all patients, an at-rest Doppler ultrasound analysis (with tissue Doppler), and a stress test. Two-dimensional and M-mode measurements, as well as the Doppler analysis, were carried out using a Sonos 7500 ultrasound system (Philips Medical Systems; Andover, Massachusetts, United States). Baseline values and those following exercise were taken with the patient in left lateral decubitus, and were stored digitally for review and analysis using the Xcelera system (Philips Medical Systems; Andover, Massachusetts, United States). All measurements were then analyzed by the same individual, blinded to the stress test results. For each measurement, 3 different cardiac cycles were averaged, in accordance with the American Society of Echocardiography guidelines.17
All patients gave informed consent to perform the test and the study protocol was approved by our clinical research ethics committee.
At-rest Doppler UltrasoundLV wall thickness was measured in the short axes of the LV at the mitral valve and papillary muscles in order to obtain maximum wall thickness. The LV ejection fraction was calculated using the Simpson method. Mitral Doppler readings were obtained from the apical 4-chamber view, placing the volume sample at the edge of the mitral leaflets. Peak E-wave and A-wave velocities were averaged in 3 consecutive cycles. Mitral ring velocities were obtained using tissue Doppler placing the volume sample in the lateral/septal ring. We obtained 3 to 5 cycles and averaged 3 for the early (E’) and late (A’) diastolic waves, as well as for an evaluation of diastolic intervals. In accordance with the classification system by Garcia et al.,18 we established 4 different filling patterns in mitral flow: normal, prolonged isovolumetric relaxation, pseudonormal, and restrictive. The LVOT was measured using color-guided continuous wave Doppler. We considered obstructive entities those that reached a gradient>30mmHg in the stress test. The classification of mitral regurgitation was based on the planar analysis of the regurgitating surface: mild (1-4cm2), moderate (4-8cm2), and severe (>8cm2). Left atrial volume indexed for body surface area was obtained using the 2-plane Simpson method (mL/m2).19
Cardiopulmonary TestFollowing the baseline Doppler ultrasound examination, we administered a stress test limited to the symptoms present, using a treadmill following the Bruce protocol. Patients were urged to exercise until exhaustion. Heart rate, blood pressure, and a 12-lead electrocardiogram were monitored and registered at rest, every 2min during exercise, and 5min after exercise. Gas exchange values and ventilation parameters were obtained using a pneumotachograph and CPX System analyzer (Medical Graphics Corp.; St. Paul, Minnesota, United States), calibrated as necessary before each test. The VO2, VCO2, and other ventilatory parameters and calculations were determined during each respiration and averaged every 10s. Before starting the test, the respiratory exchange rate had to be≤0.85. VO2max was established as the highest value of the 10-s averages during the last minute of exercise (in mL/kg/min). Functional capacity was determined as the percentage of the observed maximum VO2max as compared to the theoretical maximum value based on age, sex, and body surface area.20 The criteria for interrupting the test were exhaustion, severe arrhythmia, severe hypertension (systolic>240mmHg or diastolic>110mmHg), hypotensive response (>20mmHg), or limiting symptoms. We defined an abnormal pressure response as an increase<25mmHg or a drop>10mmHg during exercise.21
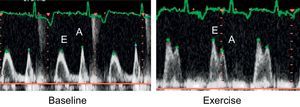
Stress EchocardiogramWhen any of the interruption criteria for the test was reached, the patient was rapidly placed on a gurney, in the same left lateral decubitus position as before. We then recorded 2 cycles of the apical 4-chamber view, 2-dimensional color images, 5 continuous Doppler LVOT cycles, pulsed mitral Doppler, and tissue Doppler of the lateral/septal ring. All images were taken 1min after peak exercise. We considered pseudonormalization of diastolic flow induced by exercise as the change from a prolonged at-rest relaxation pattern to a pseudonormal or restrictive pattern with exercise (Fig. 1).
Statistical Analysis and after exercise (B) in patients with a prolonged isovolumetric relaxation pattern at rest, which becomes pseudonormal during exercise, eith an inverted E/A ratio.")
We used the Kolmogorov-Smirnov test to determine whether each variable exhibited a normal distribution. Variables with a normal distribution were expressed as mean (standard deviation), and those without a normal distribution were expressed as a median [interquartile range]. Qualitative variables were expressed as percentages. The differences between groups were compared using chi-square, Mann-Whitney U, Student t tests or analyses of variance, as appropriate. To evaluate the relationship between variables and VO2 we used Pearson's and Spearman's correlation coefficients. We used a backwards multiple regression analysis to determine which independent factors were associated with functional capacity, expressed as percentage of VO2max. We introduced variables with a significant association resulting from the simple analysis (P<.05) into the model. We used two different models: one with echocardiographic and at-rest Doppler values and another including all variables for both at-rest and exercise tests. In addition to analyzing the overall patient group, we assessed patients with and without obstruction separately to determine the independent predictors for one presentation of the disease or another. We considered a P-value<.05 as statistically significant. For the statistical analysis, we used SPSS statistical software, version 13 (SPSS, Inc.).
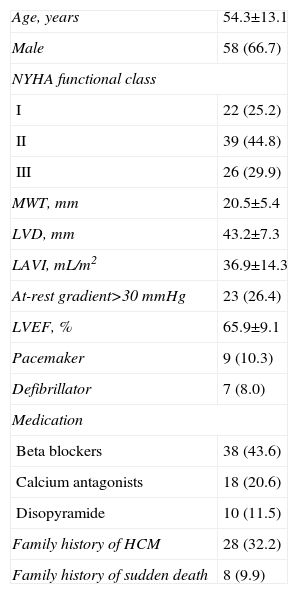
ResultsBaseline Characteristics and Stress TestIn total, we registered 103 patients referred to our department for stress tests including VO2 and Doppler ultrasound during exercise; 16 were excluded due to persistent atrial fibrillation. Therefore, the study included 87 patients (29 female; mean age 51.1 [16.4] years) (Table 1). The majority of patients (43.9%) had functional class II according to the New York Heart Association scale; no patients had undergone operations or alcohol septal ablation previously, and 9 patients carried pacemakers.
Clinical and Echocardiographic Characteristics of the Study Population (n=87).
| Age, years | 54.3±13.1 |
| Male | 58 (66.7) |
| NYHA functional class | |
| I | 22 (25.2) |
| II | 39 (44.8) |
| III | 26 (29.9) |
| MWT, mm | 20.5±5.4 |
| LVD, mm | 43.2±7.3 |
| LAVI, mL/m2 | 36.9±14.3 |
| At-rest gradient>30 mmHg | 23 (26.4) |
| LVEF, % | 65.9±9.1 |
| Pacemaker | 9 (10.3) |
| Defibrillator | 7 (8.0) |
| Medication | |
| Beta blockers | 38 (43.6) |
| Calcium antagonists | 18 (20.6) |
| Disopyramide | 10 (11.5) |
| Family history of HCM | 28 (32.2) |
| Family history of sudden death | 8 (9.9) |
LAVI: left atrial volume index; LVD, left ventricular telediastolic diameter; LVEF, left ventricular ejection fraction; HCM, hypertrophic cardiomyopathy; MWT, maximum wall thickness; NYHA, New York Heart Association.
Variables expressed as mean±standard deviation or no. (%).
Patients walked for a mean 7.15 (2.4) min, the maximum heart rate was 130.1 (25.8) bpm, and the respiratory exchange rate reached 1.01 (0.08). There were no observable complications. One patient suffered a paroxysmal atrial fibrillation at peak exercise, with spontaneous reversion during the first minute of recovery. An abnormal pressure response was observed in 23 patients, although only one of them was hypotensive. Ten of these patients were under treatment (7 with beta blockers and 3 with calcium antagonists).
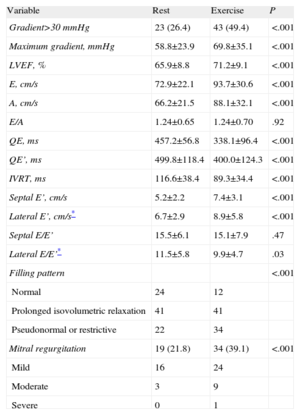
Exercise UltrasoundThe results from the ultrasound stress tests are summarized in Table 2. We did not observe segmental abnormalities in the induced contractility during exercise. The LV ejection fraction increased from 65.9 (9.1)% (range: 53%-85%) to 71.5 (9.1)% (range: 57%-85%) (P<.001).
Echocardiographic Evaluation While at Rest and After Exercise.
| Variable | Rest | Exercise | P |
| Gradient>30 mmHg | 23 (26.4) | 43 (49.4) | <.001 |
| Maximum gradient, mmHg | 58.8±23.9 | 69.8±35.1 | <.001 |
| LVEF, % | 65.9±8.8 | 71.2±9.1 | <.001 |
| E, cm/s | 72.9±22.1 | 93.7±30.6 | <.001 |
| A, cm/s | 66.2±21.5 | 88.1±32.1 | <.001 |
| E/A | 1.24±0.65 | 1.24±0.70 | .92 |
| QE, ms | 457.2±56.8 | 338.1±96.4 | <.001 |
| QE’, ms | 499.8±118.4 | 400.0±124.3 | <.001 |
| IVRT, ms | 116.6±38.4 | 89.3±34.4 | <.001 |
| Septal E’, cm/s | 5.2±2.2 | 7.4±3.1 | <.001 |
| Lateral E’, cm/s* | 6.7±2.9 | 8.9±5.8 | <.001 |
| Septal E/E’ | 15.5±6.1 | 15.1±7.9 | .47 |
| Lateral E/E’* | 11.5±5.8 | 9.9±4.7 | .03 |
| Filling pattern | <.001 | ||
| Normal | 24 | 12 | |
| Prolonged isovolumetric relaxation | 41 | 41 | |
| Pseudonormal or restrictive | 22 | 34 | |
| Mitral regurgitation | 19 (21.8) | 34 (39.1) | <.001 |
| Mild | 16 | 24 | |
| Moderate | 3 | 9 | |
| Severe | 0 | 1 |
IVRT, isovolumetric relaxation time; LVEF, left ventricular ejection fraction; QE, time between mitral E-wave and Q- wave; QE’, time between septal E’-wave and Q-wave.
Values expressed as mean±standard deviation or no. (%).
In general, mitral and ring flow velocities increased with exercise (Table 2). There were significant increases in E-wave and A-wave values, but the E/A ratio was constant. We also observed a proportional increase in ring E’ wave values with no differences in the E/E’ relationship after exercise as compared to baseline values.
Mitral Filling PatternIn some patients, we observed that exercise deteriorated mitral filling patterns (Table 2). At rest, 14 of the 41 patients with a prolonged isovolumetric relaxation pattern developed a pseudonormal or restrictive pattern with exercise (Fig. 1). This pseudonormalization was associated with a greater left atrial volume indexed for body surface area (47.3 [14.6] mL/m2 vs 32.4 [14.5] mL/m2; P<.05), worse functional capacity (66.5 [11.4]% vs 81.8 [20.8]%; P<.05), higher E/E’ ratio following exercise (19.4 [7.9] vs 12.5 [6.4]; P=.015) and more frequent mitral regurgitation following exercise (71.4% vs 25.9%; P<.01).
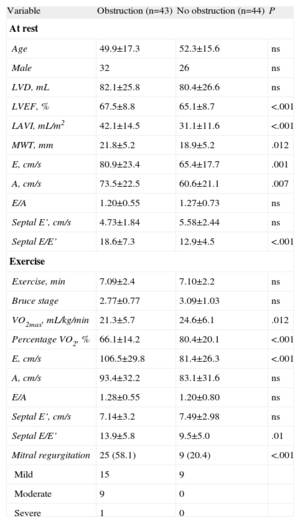
Left Ventricular Outflow Tract ObstructionAt rest, 23 patients experienced obstruction (31.5%), and another 20 patients developed gradients>30mmHg with exercise. These 43 patients compose the group with obstructive patterns. Patients with obstruction had more dilated left atria and a greater wall thickness (Table 3). Patients with obstructive patterns had a higher mitral regurgitation value and E/E’ ratio at rest and after exercise. The VO2max (in mL/kg/min or as functional capacity) of patients with obstruction was significantly lower than in nonobstructed cases (Table 3).
Comparison Between Patients With and Without Left Ventricular Outflow Tract Obstruction.
| Variable | Obstruction (n=43) | No obstruction (n=44) | P |
| At rest | |||
| Age | 49.9±17.3 | 52.3±15.6 | ns |
| Male | 32 | 26 | ns |
| LVD, mL | 82.1±25.8 | 80.4±26.6 | ns |
| LVEF, % | 67.5±8.8 | 65.1±8.7 | <.001 |
| LAVI, mL/m2 | 42.1±14.5 | 31.1±11.6 | <.001 |
| MWT, mm | 21.8±5.2 | 18.9±5.2 | .012 |
| E, cm/s | 80.9±23.4 | 65.4±17.7 | .001 |
| A, cm/s | 73.5±22.5 | 60.6±21.1 | .007 |
| E/A | 1.20±0.55 | 1.27±0.73 | ns |
| Septal E’, cm/s | 4.73±1.84 | 5.58±2.44 | ns |
| Septal E/E’ | 18.6±7.3 | 12.9±4.5 | <.001 |
| Exercise | |||
| Exercise, min | 7.09±2.4 | 7.10±2.2 | ns |
| Bruce stage | 2.77±0.77 | 3.09±1.03 | ns |
| VO2max, mL/kg/min | 21.3±5.7 | 24.6±6.1 | .012 |
| Percentage VO2, % | 66.1±14.2 | 80.4±20.1 | <.001 |
| E, cm/s | 106.5±29.8 | 81.4±26.3 | <.001 |
| A, cm/s | 93.4±32.2 | 83.1±31.6 | ns |
| E/A | 1.28±0.55 | 1.20±0.80 | ns |
| Septal E’, cm/s | 7.14±3.2 | 7.49±2.98 | ns |
| Septal E/E’ | 13.9±5.8 | 9.5±5.0 | .01 |
| Mitral regurgitation | 25 (58.1) | 9 (20.4) | <.001 |
| Mild | 15 | 9 | |
| Moderate | 9 | 0 | |
| Severe | 1 | 0 | |
LAVI, left atrial volume index; LVD, left ventricular telediastolic volume; LVEF, left ventricular ejection fraction; MWT, maximum wall thickness; ns, not significant; VO2, oxygen consumption; VO2max, maximum oxygen consumption.
Data are expressed as mean±standard deviation or no. (%).
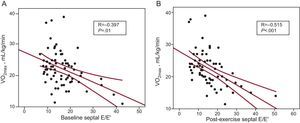
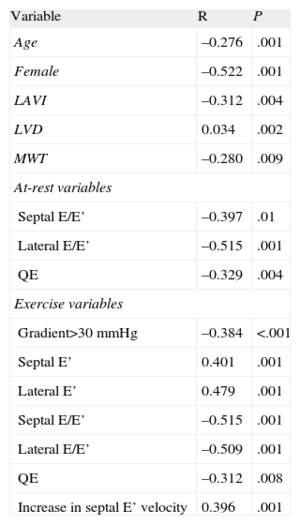
Table 4 shows the correlations between the different variables and VO2max. An obstruction at the peak of exercise>30mmHg was correlated with VO2 (r=−0.384; P<.001). However, we did not observe a significant relationship between VO2 and maximum gradient at rest or at exercise. Age (r=−0.28; P=.001), sex (r=−0.52; P<.0001) and left ventricular and atrial volume were correlated with VO2. As regards Doppler parameters, the lateral/septal E/E’ ratios and time between mitral E wave and Q-wave (QE interval) were significantly correlated with VO2, both at rest and upon exercising (Fig. 2). An increase in the septal ring E’ wave (r=0.396; P=.001) was associated with a higher VO2.
Variables Associated With Maximum Oxygen Consumption. Univariate Analysis.
| Variable | R | P |
| Age | –0.276 | .001 |
| Female | –0.522 | .001 |
| LAVI | –0.312 | .004 |
| LVD | 0.034 | .002 |
| MWT | –0.280 | .009 |
| At-rest variables | ||
| Septal E/E’ | –0.397 | .01 |
| Lateral E/E’ | –0.515 | .001 |
| QE | –0.329 | .004 |
| Exercise variables | ||
| Gradient>30 mmHg | –0.384 | <.001 |
| Septal E’ | 0.401 | .001 |
| Lateral E’ | 0.479 | .001 |
| Septal E/E’ | –0.515 | .001 |
| Lateral E/E’ | –0.509 | .001 |
| QE | –0.312 | .008 |
| Increase in septal E’ velocity | 0.396 | .001 |
LAVI, left atrial volume index; LVD, left ventricular telediastolic volume; MWT, maximum wall thickness; QE, time between mitral E-wave and Q-wave.
 and after exercise (B). VO2max, maximum oxygen consumption.")
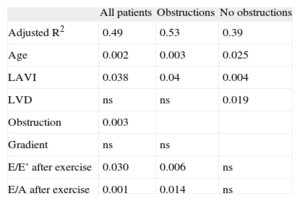
In the multiple regression analysis, the model including at-rest variables yielded an adjusted R2 of 0.379, and the only factors independently associated with functional capacity were sex (P=.001) and left atrial volume (P=.001). The model that included both at rest and exercise variables showed an adjusted R2 of 0.49. In this model, the independent factors were age, left atrial volume index, obstruction during exercise, and E/E’ and E/A ratios after exercise (Table 4). In obstructive cases, these same variables also were independently associated with functional capacity, with a predictive value>50% (adjusted R2=0.53). In nonobstructed cases, the determining factors for functional capacity were left atrial and ventricular volumes (adjusted R2=0.39).
DiscussionOur study shows that the obstructive forms of HCM cause a greater functional limitation than do nonobstructive forms, independent of the severity of obstruction. In effect, neither maximum at-rest gradient nor peak exercise gradient was significantly associated with VO2max, even when we analyzed obstructive forms separately. Previous studies also failed to establish a relationship between gradient and functional limitation in these patients.4,22,23 Our study established the type of obstructive form based on Doppler study during exercise. In previous studies, the baseline or peak exercise gradients were assessed without considering the qualitative nature of the obstruction. We established the type of obstruction as an independent variable, since these obstructive forms not only involve a pressure gradient in the LVOT but are also associated with other mechanisms such as mitral regurgitation. In this manner, we observed that mitral regurgitation upon exercise was more common and severe in patients that suffered obstruction. As a consequence of these mechanisms, patients with obstruction have greater functional repercussions, both at rest and upon exercise. Thus, the left atrial volume, maximum wall thickness, and E/E’ ratio, both at rest and during exercise, were significantly higher than in patients without obstruction. The fact that obstruction was one of the most important limiting factors is in accordance with previous studies in which a gradient>30mmHg was a prognostic factor for heart failure and cardiovascular death.24
Other factors associated with a greater functional limitation were age, left atrial volume, and Doppler parameters for E/A during exercise and the E/E’ ratio of the septal ring. In our study, Doppler values obtained during peak exercise were better correlated with functional capacity (Fig. 2). When we only applied at-rest data in the predictive model, we obtained an R2=0.38, whereas with the exercise data this value increased to 0.49. However, the results appear not to be quite clinically relevant, since a 50% variability rate seems excessive for predicting functional limitations in a given patient. This low predictive value of functional capacity in HCM patients is similar to the results published by other authors, whether using echocardiographic data,4,23,25,26 clinical data,22 or biological markers such as N-terminal pro-B-type natriuretic peptide.27
During exercise, 14 patients had a pseudonormal pattern for mitral filling. We attributed this pseudonormalization, which was correlated with a lower VO2, to an increase in filling pressures during exercise. These patients have higher left atrial volumes, levels of mitral regurgitation, and E/E’ ratios. Although the E/E’ ratio in HCM patients does not reliably show LV pressure,15 upon exercising, as a consequence of increased heart rate, the shortening of diastole, and an increase in the preload due to mitral regurgitation, it is easy to understand that pressures increase in the presence of a hypertrophic and rigid LV. In a previous study, LV stiffness, determined by a combination of Doppler ultrasound and cardiac magnetic resonance, was associated with a reduced functional capacity.28
In patients without obstruction, LV volume was a determining factor for functional capacity. A higher ventricular volume was associated with a higher VO2. This coincides with the abovementioned results, since a more dilated LV, with preserved LV ejection fraction, can maintain a higher cardiac output and higher VO2 during exercise.
The indexed left atrial volume is the only echocardiographic variable that is independently associated with functional capacity in all patients, either with or without obstructions. Atrial remodelling reflects the chronicity and strong increase in atrial pressure. Atrial dilation has been associated with hypertrophy, diastolic dysfunction, increased filling pressures, reduced functional level, and increased risk of arrhythmia.29 In clinical practice, indexed atrial volume is more useful than transverse diameter.30 Our results coincide with previous studies (Table 5).31
Functional Capacity Values Expressed as Percentage of Maximum Oxygen Consumption. Multivariate Analysis.
| All patients | Obstructions | No obstructions | |
| Adjusted R2 | 0.49 | 0.53 | 0.39 |
| Age | 0.002 | 0.003 | 0.025 |
| LAVI | 0.038 | 0.04 | 0.004 |
| LVD | ns | ns | 0.019 |
| Obstruction | 0.003 | ||
| Gradient | ns | ns | |
| E/E’ after exercise | 0.030 | 0.006 | ns |
| E/A after exercise | 0.001 | 0.014 | ns |
LAVI, left atrial volume index; LVD, left ventricular telediastolic volume; ns, not significant.
The analysis of the lateral ring was included halfway through the study, which is the reason why this variable was assessed in only 36 of the 87 patients. In the analysis of these 36 patients we did not observe that variables obtained from the lateral ring measurement improved compared to those of the septal ring, and it is not possible to conclude whether larger samples could improve the predictive value of these variables for functional capacity.
ConclusionsThe Doppler ultrasound analysis during exercise facilitates recognition of latent obstruction and improves the predictive value for functional capacity over at-rest data, although it only explained 50% of the variability of this parameter. The type of obstruction is the most important independent factor for functional limitation. Additionally, age and left atrial volume are determining factors. E/A and E/E’ ratios following exercise (in obstructed cases) and LV volume (in nonobstructed cases) were also independent factors associated with functional capacity.
Conflicts of InterestNone declared.