Cardiac involvement determines prognosis and treatment options in transthyretin-familial amyloidosis. Cardiac magnetic resonance T1 mapping techniques are useful to assess myocardial extracellular volume. This study hypothesized that myocardial extracellular volume allows identification of amyloidotic cardiomyopathy and correlates with the degree of neurological impairment in transthyretin-familial amyloidosis.
MethodsA total of 31 transthyretin-familial amyloidosis patients (19 mean age, 49 ± 12 years; 26 with the Val30Met mutation) underwent a T1 mapping cardiac magnetic resonance study and a neurological evaluation with Neuropathy Impairment Score of the Lower Limb score, Norfolk Quality of Life questionnaire, and Karnofsky index.
ResultsFive patients had cardiac amyloidosis (all confirmed by 99mTc-DPD scintigraphy). Mean extracellular volume was increased in patients with cardiac amyloidosis (0.490 ± 0.131 vs 0.289 ± 0.035; P = .026). Extracellular volume correlated with age (R = 0.467; P = .008), N-terminal pro-B-type natriuretic peptide (RS = 0.846; P < .001), maximum wall thickness (R = 0.621; P < .001), left ventricular mass index (R = 0.685; P < .001), left ventricular ejection fraction (R = –0.378; P = .036), Neuropathy Impairment Score of the Lower Limb (RS = 0.604; P = .001), Norfolk Quality of Life questionnaire (RS = 0.529; P = .003) and Karnofsky index (RS= –0.517; P = .004). A cutoff value of extracellular volume of 0.357 was diagnostic of cardiac amyloidosis with 100% sensitivity and specificity (P < .001). Extracellular volume and N-terminal pro-B-type natriuretic peptide were the only cardiac parameters that significantly correlated with neurologic scores.
ConclusionsExtracellular volume quantification allows identification of cardiac amyloidosis and correlates with the degree of neurological impairment in transthyretin-familial amyloidosis. This noninvasive technique could be a useful tool for early diagnosis of cardiac amyloidosis and to track cardiac and extracardiac amyloid disease.
Keywords
Transthyretin (TTR) familial amyloidosis, also known as familial amyloid polyneuropathy (TTR-FAP), is an autosomal dominant inherited disorder caused by mutations in the TTR gene.1
In this disorder, mutated TTR protein precipitates as extracellular amyloid deposits, mainly in peripheral nerves and in the heart.1,2 Although neurological impairment usually dominates clinical manifestations, heart involvement frequently determines the prognosis.2–4
Available treatments for TTR-FAP include liver transplantation5 and the TTR stabilizer tafamidis.6 Several other compounds are under investigation with promising initial results.7 Currently, it is recommended to start drug therapy or proceed with liver transplantation when the first signs and symptoms of neurological impairment are identified.8,9
Unfortunately, when the first symptoms appear, amyloid deposits could be large enough to compromise the patient's clinical course thereafter. Methods to detect early amyloid deposits are therefore needed. Moreover, a method that quantifies the amount of amyloid in the tissues over time would be desirable to monitor treatment response and to establish a cutoff point to start treatment.2
Amyloidotic cardiomyopathy (AC) is one of the leading causes of death in TTR-FAP patients2,3,5 and a significant number of TTR-FAP patients have underdetected cardiac involvement.2,10
The definitive diagnosis of AC requires histological evidence of amyloid deposits2–4; however, endomyocardial biopsy has associated risks and a noninvasive diagnostic approach with imaging techniques is commonly preferred. In patients with genetically confirmed TTR-FAP, AC is accepted in cases of unexplained increased ventricular thickness/mass and typical findings of AC either on 99mTC-DPD scintigraphy or on cardiac magnetic resonance (CMR).2,8,11
T1 mapping CMR techniques allow, through a simple equation, an estimate of the heart volume occupied by extracellular components.12,13 As TTR amyloid deposits are extracellular, cardiac extracellular volume (ECV) value reflects the amount of TTR amyloid deposits in the myocardium and could serve as a tool to diagnose AC and to monitor its progression.13,14 Furthermore, cardiac ECV could reflect the amount of amyloid deposits that are present in other tissues.
The purpose of this study was 2-fold: to determine if increased ECV allows the identification of AC in TTR-FAP patients, and to explore if cardiac ECV correlates with the degree of neurological impairment caused by TTR amyloid extracardiac deposits.
METHODSStudy PopulationAfter approval from the institutional review board, 31 genetically proven TTR-FAP participants (19 men; mean age, 49 ± 12 years) at different stages of the disease were recruited at 5 Spanish centers. All participants provided written informed consent and underwent CMR scanning.
Eligibility requirements included a glomerular filtration rate > 30mL/min/1.72m2 and no other contraindications to CMR (ie, cardiac devices).
Exclusion criteria were formal CMR contraindications and prior myocardial infarction.
Clinical EvaluationAll participants underwent a detailed clinical history and physical examination and provided a blood sample prior to CMR study. Creatinine, albumin, hematocrit and N-terminal pro-B-type natriuretic peptide (NT-proBNP) levels were determined. Orthostatic challenge was also investigated by examining lying-to-standing blood pressure changes.15
Neurological assessment was performed by a trained physician on the same day and included the following tests: Neuropathy Impairment Score-Lower limbs (NIS-LL) scale, Norfolk QOL-DN (Norfolk Quality of Life-Diabetic Neuropathy) questionnaire, and Karnofsky index. These scales were selected because of their low complexity and their use in previous TTR-FAP drug trials.6,7 The scales were applied by the same physician to reduce their variability. The NIS-LL (0 to 88) is the sum score of motor, reflex and sensory (vibration, joint point position, and pinprick sensation of the index finger) functions in the lower limbs (firstly affected in TTR-FAP).16 A patient with no neurologic abnormalities would have a score of 0. Norfolk QOL-DN is a 35-item questionnaire (47 items in the Spanish version) arranged thematically into 5 domains: physical functioning/large fiber neuropathy, activities of daily living, symptoms, small fiber neuropathy, and autonomic neuropathy.17 The total quality of life score is the sum of all domains with a range from 0 (best quality of life) to 138 (worst possible quality of life). Karnofsky performance status reflects the overall health of the patient (normal 100 to 0).18 Neurological evaluation was not carried out in 2 patients because of the coexistence of other conditions affecting the lower limbs (poliomyelitis and spondyloarthritis with radiculopathy). These 2 patients were not included in the statistical analysis of the neurological correlation with ECV or in the division by clinical subgroups. However, they were included in the analysis of cardiac parameters and none had AC.
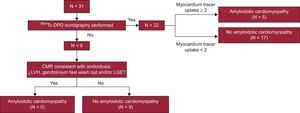
Positive cardiac involvement was based on 99mTc-DPD scintigraphy and CMR findings. Amyloidotic cardiomyopathy was defined as the presence of biventricular intense tracer uptake (grade 2 or 3 as defined by Perugini et al)19 in patients with a 99mTc-DPD scintigraphy (22 participants). Amyloidotic cardiomyopathy was also considered if CMR showed left ventricular hypertrophy (LVH) (> 12mm, in the absence of hypertension and valvular disease) plus rapid gadolinium wash out/typical amyloidotic late gadolinium enhancement (LGE) and biopsy-proven extracardiac amyloidosis.2–4,11,20 In 9 patients, scintigraphy was not available in the referring centers. For these patients, only data from the CMR were considered to define AC (Figure 1). For the statistical analysis, the included patients were divided into 3 groups according to their clinical status: asymptomatic mutation carrier (n = 5), neurological impairment with no AC (n = 19), and AC (n = 5). All patients with AC had also neurological impairment.
Cardiac Magnetic Resonance Protocol
All participants underwent a standard CMR study on a 3-T clinical scanner (Achieva, Philips Healthcare; Best, The Netherlands). A standard volume and LGE study was performed.21 Before contrast administration, T1 mapping sequences of the Modified Look-Locker Inversion Recovery (MOLLI) in short-axis geometry at a basal and mid-cavity level (2 sections) and 4-chambers (1 section) views were acquired. A 0.1 mmol/kg bolus of gadolinium-based contrast (gadopentetate dimeglumine, Magnevist, Bayer; Berlin, Germany) was administered and standard LGE images were acquired 15min later. Next, gadolinium DTPA was administered through an infusion system at a rate of 0.00115 mmol/kg/min for at least 20min to achieve blood:myocardial contrast equilibrium. After continuous infusion was completed, a new T1 mapping MOLLI image acquisition was undertaken, which allowed measurement of the change in T1 before and after a steady-state, as previously published.12
All CMR images and maps were analyzed offline in a workspace Philips platform (Philips; Best, The Netherlands).
Extracellular Volume CalculationT1 maps where generated by nonlinear fitting of the signal intensity to the model previously proposed.22 The T1 value was the average of the complete T1 measurements at the basal and medium ventricular short axis views (complete myocardium ROI [region of interest]). Extreme values of ± 2 standard deviations of the mean T1 value of a ROI placed in the septum were automatically excluded. Cardiac extracellular volume was calculated as previously reported.12
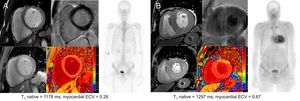
Examples of ECV values in an asymptomatic mutation carrier and in a patient with AC are shown in Figure 2.
 and in a patient with amyloid cardiomyopathy (B). CMR images correspond to short axis cine, LGE (above) and T1 maps (below). CMR, cardiac magnetic resonance; ECV, extracellular volume; LGE, late gadolinium enhancement.")
Cardiac CMR and scintigraphy findings in an asymptomatic mutation carrier (A) and in a patient with amyloid cardiomyopathy (B). CMR images correspond to short axis cine, LGE (above) and T1 maps (below). CMR, cardiac magnetic resonance; ECV, extracellular volume; LGE, late gadolinium enhancement.
Categorical data are expressed as percentages and were compared using Fisher's exact test. Normally distributed variables are expressed as the mean ± standard deviation while nonnormally distributed variables are expressed as the median [interquartile range]. For the statistical analysis, Student's t test and Mann-Whitney nonparametric test were used in 2-group comparisons.
The correlation between variables was assessed using Pearson's (R) or Spearman's Rho (RS) coefficient. A 1-way ANOVA (analysis of variance) or Kruskal-Wallis analysis was used to assess the correlation of continuous variables with clinical status. Statistical significance was defined as P < .05. The entire analysis was performed using the SPSS package, version 20.0.0 (IBM Corp.; Armonk, New York, United States).
RESULTSThirty-one patients (mean age, 49 ± 12 years [range, 34-71]; 19 men [61%]) with genetically diagnosed TTR-FAP were studied. The most common mutation was Val30Met (n = 26 [84%]). Other mutations were delV122 (n = 3 [10%]), Glu89Gln (n = 1 [3%]), and Glu89Lys (n = 1 [3%]). Twenty-one patients (68%) came from the 2 Spanish Val30Met TTR-FAP endemic regions: Huelva (n = 14) and Mallorca (n = 7). Five participants (4 men) with a mean age of 40 ± 6 years were considered mutation carriers, defined as individuals with no evidence of disease. Mutations of asymptomatic genetic carriers were delV122 (n = 3), Glu89Lys (n = 1), and Val30Met (n = 1).
Thirteen patients (42%) had undergone liver transplantation previously and no patient was receiving tafamidis when the CMR study was performed. All transplanted patients in this cohort were Val30Met and belonged to one of the endemic regions. None of them were in the subgroup of asymptomatic carriers as this treatment is only indicated when there are disease manifestations. However, only 1 of these patients had cardiac involvement.
Nineteen patients (61%) showed signs of isolated neurological impairment. Orthostatic hypotension was present in 9 patients (33%) and 12 patients (39%) had gastrointestinal disturbances (constipation/diarrhea). No patient reported urinary tract infections.
Five patients (4 men; mean age, 65 ± 8 years) were diagnosed with AC (Figure 1). Patients with AC were Val30Met (n = 4) and Glu89Gln (n = 1). All patients with AC showed also some degree of neurological impairment.
On CMR study, all patients with AC showed LVH and fast wash-out of gadolinium. The pattern of LGE in patients with AC was diverse: global transmural LGE (n = 2), transmural LGE except in lateral basal and middle segments (n = 1), nonischemic patched LGE (n = 1), and no LGE (n = 1). None of the patients with transmural LGE pattern had other features that suggested the existence of a previous myocardial infarction, such as wall motion abnormalities or thinning of the ventricular wall.
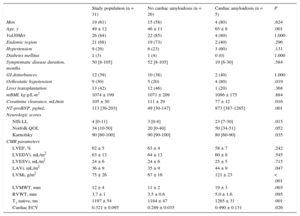
A summary of clinical features and CMR findings is presented in Table 1.
Clinical Characteristics, Neurological Involvement and Cardiac Magnetic Resonance Findings
| Study population (n = 31) | No cardiac amyloidosis (n = 26) | Cardiac amyloidosis (n = 5) | P | |
|---|---|---|---|---|
| Men | 19 (61) | 15 (58) | 4 (80) | .624 |
| Age, y | 49 ± 12 | 46 ± 11 | 65 ± 8 | .001 |
| Val30Met | 26 (84) | 22 (85) | 4 (80) | 1.000 |
| Endemic region | 21 (68) | 19 (73) | 2 (40) | .296 |
| Hypertension | 9 (29) | 6 (23) | 3 (60) | .131 |
| Diabetes mellitus | 1 (3) | 1 (4) | 0 (0) | 1.000 |
| Symptomatic disease duration, months | 50 [8-105] | 52 [8-105] | 19 [6-30] | .584 |
| GI disturbances | 12 (39) | 10 (38) | 2 (40) | 1.000 |
| Orthostatic hypotension | 9 (30) | 5 (20) | 4 (80) | .019 |
| Liver transplantation | 13 (42) | 12 (46) | 1 (20) | .368 |
| mBMI, kg·g/L·m2 | 1074 ± 199 | 1071 ± 209 | 1086 ± 175 | .884 |
| Creatinine clearance, mL/min | 105 ± 30 | 111 ± 29 | 77 ± 12 | .016 |
| NT-proBNP, pg/mL | 113 [36-203] | 49 [30-147] | 873 [387-1285] | .001 |
| Neurologic scores | ||||
| NIS-LL | 4 [0-11] | 3 [0-8] | 23 [7-30] | .015 |
| Norfolk QOL | 34 [10-50] | 20 [0-40] | 50 [34-51] | .052 |
| Karnofsky | 90 [80-100] | 90 [90-100] | 80 [60-90] | .035 |
| CMR parameters | ||||
| LVEF, % | 62 ± 5 | 63 ± 4 | 58 ± 7 | .242 |
| LVEDVi, mL/m2 | 63 ± 13 | 64 ± 13 | 60 ± 8 | .545 |
| LVESVi, mL/m2 | 24 ± 6 | 24 ± 6 | 25 ± 5 | .715 |
| LAVi, mL/m2 | 36 ± 9 | 35 ± 9 | 44 ± 9 | .047 |
| LVMi, g/m2 | 75 ± 26 | 67 ± 16 | 121 ± 23 | < .001 |
| LVMWT, mm | 12 ± 4 | 11 ± 2 | 19 ± 3 | .003 |
| RVWT, mm | 3.7 ± 1 | 3.5 ± 0.6 | 5.0 ± 1.6 | .095 |
| T1 native, ms | 1197 ± 54 | 1184 ± 47 | 1265 ± 31 | .001 |
| Cardiac ECV | 0.321 ± 0.095 | 0.289 ± 0.035 | 0.490 ± 0.131 | .026 |
CMR, cardiac magnetic resonance; ECV, extracellular volume; GI, gastrointestinal; mBMI, modified body mass index; LAVi, left atrial volume index; LVEF, left ventricular ejection fraction; LVEDVi, left ventricular end-diastolic volume indexed; LVESVi, left ventricular end-systolic volume indexed; LVMi, left ventricular mass indexed; LVMWT, left ventricular maximum wall thickness; NIS-LL, Neuropathy Impairment Score-Lower Limbs; NT-proBNP, N-terminal pro-B-type natriuretic peptide; QOL, Quality of Life; RVWT, right ventricular wall thickness.
Data are expressed as no. (%), mean ± standard deviation or median [interquartile range].
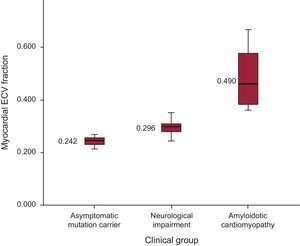
Mean ECV values increased across clinical groups: 0.242 ± 0.02, 0.296 ± 0.027 and 0.490 ± 0.130) for asymptomatic mutation carriers, only neurological symptoms, and AC, respectively (P < .001) (Figure 3). Inter- and intraobserver variability in ECV showed no significant differences (R = 0.66; P < .005 and R = 0.94; P < .005, respectively).

Although there was a direct correlation between ECV and age (Table 2), we found no differences in mean ECV by sex (male, 0.325 ± 0.103 vs female, 0.316 ± 0.085; P = .794), cardiovascular risk factors (hypertension 0.357 ± 0.125 vs no hypertension 0.307 ± 0.078; P = .184; and diabetes 0.305 ± 0.000 vs no diabetes 0.322 ± 0.096; P = .864) or type of mutation (Val30Met 0.324 ± 0.084 vs other mutations 0.309 ± 0.151; P = .752).
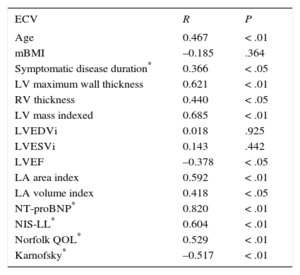
Correlations of Myocardial Extracellular Volume With Diverse Parameters
| ECV | R | P |
|---|---|---|
| Age | 0.467 | < .01 |
| mBMI | –0.185 | .364 |
| Symptomatic disease duration* | 0.366 | < .05 |
| LV maximum wall thickness | 0.621 | < .01 |
| RV thickness | 0.440 | < .05 |
| LV mass indexed | 0.685 | < .01 |
| LVEDVi | 0.018 | .925 |
| LVESVi | 0.143 | .442 |
| LVEF | –0.378 | < .05 |
| LA area index | 0.592 | < .01 |
| LA volume index | 0.418 | < .05 |
| NT-proBNP* | 0.820 | < .01 |
| NIS-LL* | 0.604 | < .01 |
| Norfolk QOL* | 0.529 | < .01 |
| Karnofsky* | –0.517 | < .01 |
ECV, extracellular volume; LA, left atrium; LV, left ventricle; LVEDVI, left ventricular end-diastolic volume index; LVEF, left ventricular ejection fraction; LVESVI, left ventricular end-systolic volume index; mBMI, modified body mass index; NT-proBNP, N-terminal pro-B-type natriuretic peptide; NIS-LL, Neuropathy Impairment Score-Lower Limbs; QOL, quality of life; RV, right ventricle.
Extracellular volume correlated with several cardiac parameters (Table 2). Cardiac ECV correlated directly with indexed left ventricular mass, left ventricle maximum wall thickness, right ventricular thickness, and indexed left atrial area/volume and NT-proBNP. Extracellualr volume also correlated inversely with left ventricular ejection fraction (Table 2); however, the strongest correlation occurred with NT-proBNP (RS = 0.820; P < .001).
Cardiac ECV and T1 native values were significantly higher in patients with positive LGE (0.522 ± 0.126 vs 0.292 ± 0.037; P = .034, and 1263 ± 35 vs 1188 ± 49ms; P = .007, respectively) and with rapid gadolinium kinetics (0.461 ± 0.137 vs 0.288 ± 0.036; P = .027, and 1264 ± 27 vs 1181 ± 45 ms; P < .001, respectively).
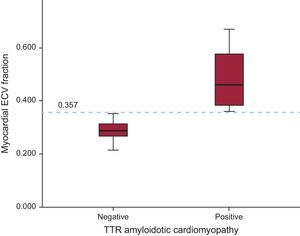
All patients with AC showed increased ECV values. Mean ECV was increased in patients with AC vs patients without AC (0.490 ± 0.131 vs 0.289 ± 0.035; P = .026). Furthermore, the cutoff value of ECV = 0.357 calculated by ROC (receiver operating characteristic) curve was diagnostic of AC with 100% sensitivity and specificity (P < .001) (Figure 4).
Extracellular Volume and Neurological Manifestations
The NIS-LL, Norfolk and Karnofsky scores correlated with ECV (Table 2), while T1 native only correlated with NIS-LL (RS = 0.403; P = .030). The NT-proBNP also correlated with NIS-LL (RS = 0.720; P < .01), Norfolk QOL (RS = 0.616; P < .01) and Karnofsky index (RS = –0.708; P < .01). We also found statistically significant differences in NIS-LL and Karnofsky scores accross clinical groups, with worst scores in the AC group (Table 1).
DISCUSSIONTo our knowledge, this study is the first to evaluate the value of cardiac ECV determined by CMR T1 mapping techniques for the diagnosis of AC in a population of exclusively TTR-FAP patients. This study shows that cardiac ECV is severely increased among TTR-FAP patients with AC and that ECV increases across the clinical spectrum of the condition. Furthermore, our study shows that cardiac ECV correlates with neurological manifestations of the condition.
Amyloidosis is the paradigm of deposition diseases affecting the extracellular space.1–4 In TTR-FAP, amyloid deposits grow progressively and affect mainly the nerves and the heart.1–4,23 While neurological symptoms usually dominate clinical features, heart involvement frequently determines the prognosis.2–4,23 Nerve and cardiac biopsies could be employed to confirm amyloid deposition2–4 but cannot be used as a follow-up method due to patchy amyloid deposition and the impossibility of repeating biopsies on the exact same site.
Both cardiac and neurological tests employed in TTR-FAP follow-up have shown several limitations. On the one hand, neurological tests rely on physicians’ ability to gather data and they are not specific to a single type of neuropathy.24 On the other hand, CMR and 99mTc-DPD scintigraphy provide a yes/no answer to the presence of cardiac amyloid disease but do not provide a precise value of the amyloid burden that could be tracked over time.
A noninvasive technique that permits early detection of amyloid deposits and estimates the amyloid burden in tissues would be particularly useful in TTR-FAP. Furthermore, despite recent advances in noninvasive techniques, the diagnosis of AC is still challenging, and characteristic and easily recognizable features are often found only at advanced stages.2,11 If our findings are confirmed by additional studies, ECV could be extremely useful to diagnose early cardiac involvement in TTR-FAP.
Calculation of ECV by CMR and T1 mapping techniques have the potential to become the method of choice for objective amyloid quantification in TTR-FAP.
T1 mapping has already shown its usefulness in the differential diagnosis of LVH and both ECV and T1 native values have been reported to be higher in patients with AC than in healthy controls, patients with hypertrophic cardiomyopathy, and those with severe aortic stenosis.13
To date, ECV has been studied in a AC setting mainly in AL (amyloid light-chain) amyloidosis patients.25–28 The first ECV values of cardiac involvement in amyloidosis were published by Sado et al13 in 27 cardiac AL amyloidosis patients using a 1.5T scanner and a fast low-angle single-shot inversion recovery (FLASH IR) sequence at increasing inversion times from 140 to 900ms to allow quantification of T1. That study revealed a dramatic difference in ECV between AC patients and patients with other cardiac conditions.13 Later, several other groups reported their experience mainly in AL amyloidosis and also with a 1.5T scanner.25–28 The reported ECV values ranged between 0.44 ± 0.12 and 0.46 ± 0.07. Some of the published data for AL amyloidosis were reported on the basis of T1 values, with precontrast T1 times of 1140 ± 61,27 1130 ± 68,25 and 1080 ± 8728 in a 1.5T scanner with a ShMOLLI sequence. Thus far, only 1 group has reported their experience in ATTR (amyloidogenic transthyretin) AC, but only precontrast T1 values were reported.25 In that study, a group of 85 patients with ATTR (35 with hereditary ATTR) showed a native T1 time of 1097 ± 43 ms and ECV data were not reported. Considering prior ECV data, our ECV results in TTR-FAP patients with cardiac involvement, 0.490 ± 0.131, are in agreement with previous reports on AL cardiac amyloidosis.
In our cohort, an ECV value of 0.357 was diagnostic of AC with 100% sensitivity and specificity. Studies with a larger sample size are needed to adequately address the spectrum of ECV in this disease and to determine the best diagnostic cutoff value.
That ECV accurately reflects cardiac involvement in TTR-FAP is further supported in our study by the fact that ECV correlated with several cardiac parameters and very strongly with NT-proBNP values (RS = 0.820; P < .001). The NT-proBNP has been reported as a prognostic factor in AL amyloidosis,29 but there are limited data in TTR amyloidosis.10,30 Recent evidence suggests that NT-proBNP and change in LV mass are markers of disease progression in TTR-FAP patients.31,32
Finally, our study has shown that ECV correlates with neurological involvement in TTR-FAP patients and that ECV progresses across the disease spectrum of the condition. These findings support the concept that ECV monitoring of amyloid burden could be possible in TTR-FAP patients as has already been reported in murine models.33
As discussed before, liver transplantation is a therapeutic alternative for these patients that avoids the production of amylogenic protein. Only 1 of the 13 liver transplanted patients in our study had evidence of AC. The “protective cardiac effect” of liver transplantation in these individuals could be argued based on our results, but we believe that prospective studies with a larger sample size are still needed to determine the usefulness of ECV in monitoring the different treatments for ATTR-FAP.
Finally, ECV is a promising tool for human research and could be used as a surrogate marker of the response to new compounds, facilitating the performance of clinical trials in a rare disease. From a clinical viewpoint, ECV could be used to monitor drug response and to help with decision-making on liver transplantation, even though simple amyloid burden quantification may not reflect the unique pathological mechanism of amyloidosis.
LimitationsThis study is limited by its modest patient size, despite its multicenter nature. The TTR-FAP is a rare disease and conduction disorders requiring a pacemaker and nephropathy are not infrequent complications of this disease, limiting CMR research studies. Further studies in larger patient series with diverse mutations will be needed to confirm our findings.
Another limitation of our study is the absence of endomyocardial biopsies to confirm AC. Endomyocardial biopsies implies some risks and therefore AC is currently accepted in TTR-FAP patients, in the presence of a pathogenic mutation and findings suggestive of AC on cardiac imaging tests.8 In particular, the 5 patients with AC in our study had typical findings of heart involvement both on CMR and scintigraphy (Figure 1).
Some patients in our study had hypertension or diabetes. These cardiovascular risk factors were not considered exclusion criteria as in previous studies in the field,25,26 although we cannot rule out their influence on ECV.
Cardiac ECV is likely to correlate with the burden of cardiac involvement in AC but this still needs to be proven with biopsy or autopsy findings. Although T1 mapping techniques in 3T scanners have been previously validated in healthy volunteers,34 there are few data on 3T ECV values in amyloidosis.
Finally, a significant portion of patients had undergone liver transplantation and the impact on cardiac involvement of this therapy is unknown.
CONCLUSIONSCardiac ECV quantification by CMR allows identification of AC and correlates with the degree of neurological impairment in TTR-FAP patients. Furthermore, ECV increases across the disease spectrum of the condition. This noninvasive technique could become a highly useful tool for early diagnosis of AC and to track cardiac and extracardiac amyloid deposits in this disease if our findings are confirmed by additional studies.
FUNDINGThis work was partially funded by a research grant from Fundación Mutua Madrileña and by Instituto de Salud Carlos III (RD12/0042/0066 and RD12/0042/0054). Grants are supported by the Plan Estatal de Investigación Científica y Técnica y de Innovación 2013-2016 and the European Regional Development Fund “A way of making Europe”.
CONFLICTS OF INTERESTJ. Sánchez-González is an employee of Philips.
- -
Hereditary transthyretin amyloidosis is a rare disease in which deposits increase progressively involving mainly the nerves and the heart. Cardiological and neurological tests to monitor disease progression have several limitations.
- -
New tissue characterization techniques in CMR are particularly interesting in amyloidosis as they allow quantification of extracellular space and amyloid deposits. Native T1 and ECV values are reported to be higher in cardiac amyloidosis than in healthy controls and other causes of hypertrophy.
- -
Cardiac ECV values are reported to correlate with cardiac parameters in other types of cardiac amyloidosis such as AL amyloidosis.
- -
The present study shows that ECV values enable the identification of cardiac involvement among patients with hereditary transthyretin amyloidosis.
- -
Cardiac ECV values increase across the severity of the disease.
- -
This is the first study that demonstrates cardiac ECV correlation with the neurological manifestations of the condition.
- -
These results suggest the capability of ECV to be used as a tool to diagnose the disease, monitor disease progression, and evaluate treatment response.
We gratefully acknowledge Kenneth McCreath for English editing and Noemi Escalera, Maite Dubraska, Angel Macias, and Braulio Perez for their excellent technical assistance.