
The index of microcirculatory resistance (IMR) measured after primary percutaneous coronary intervention (PCI) for ST-segment elevation myocardial infarction (STEMI) is associated with microvascular obstruction (MVO) and adverse clinical events. To evaluate MVO after successful primary PCI for STEMI without pressure wires or hyperemic agents, we investigated the feasibility and usefulness of functional angiography-derived IMR (angio-IMR).
MethodsThe current study included a total of 285 STEMI patients who underwent primary PCI and cardiac magnetic resonance (CMR). Angio-IMR of the culprit vessel after successful primary PCI was calculated using commercial software. MVO, infarct size, and myocardial salvage index were assessed using CMR, which was obtained a median of 3.0 days [interquartile range, 3.0-5.0] after primary PCI.
ResultsAmong the total population, 154 patients (54.0%) showed elevated angio-IMR (> 40 U) in the culprit vessel. MVO was significantly more prevalent in patients with angio-IMR> 40 U than in those with angio-IMR ≤ 40 U (88.3% vs 32.1%, P <.001). Infarct size, extent of MVO, and area at risk were significantly larger in patients with angio-IMR> 40 U than in those with angio-IMR ≤ 40 U (P <.001 for all). Angio-IMR showed a significantly higher discriminatory ability for the presence of MVO than thrombolysis in myocardial infarction flow grade or myocardial blush grade (area under the curve: 0.821, 0.504, and 0.496, respectively, P <.001).
ConclusionsAngio-IMR was significantly associated with CMR-derived infarct size, extent of MVO, and area at risk. An elevated angio-IMR (> 40 U) after primary PCI for STEMI was highly predictive of the presence of MVO in CMR.
This trial was registered at ClnicalTrialsgov (Identifier: NCT04828681).
Keywords
Despite restoration of epicardial coronary blood flow by primary percutaneous coronary intervention (PCI) in patients with acute ST-segment elevation myocardial infarction (STEMI), failure of myocardial reperfusion can occur in up to two-thirds of STEMI patients, which is attributed to the occurrence of coronary microcirculatory dysfunction and microvascular obstruction (MVO).1–3 Therefore, assessment of microcirculatory dysfunction and MVO after primary PCI would be important to evaluate the efficacy of the reperfusion therapy and need for potential further treatments. Cardiac magnetic resonance imaging (CMR) is considered the gold standard to assess MVO, which is known as an adverse prognostic indicator after primary PCI in STEMI patients.4 However, obtaining CMR in STEMI patients is not always possible due to limited availability, medical cost, and logistic issues.5
The index of microcirculatory resistance (IMR) is a pressure wire-based physiologic index that allows quantitative assessment of the microcirculatory function in a target vessel territory. Previous studies have demonstrated that an elevated IMR in the culprit vessel of STEMI after primary PCI is significantly associated with the presence of MVO and the risk of subsequent cardiac death or heart failure admission.1,5–7 However, conventional IMR measurement requires a pressure-temperature sensor wire and induction of hyperemia, which limits the adoption of IMR in daily practice, especially after primary PCI in STEMI patients. Recently, technical advances have enabled derivation of physiologic indexes, such as fractional flow reserve (FFR) or IMR, from angiographic images without the use of pressure-temperature sensor wire or hyperemic agents.8–10 A recent study showed that angiography-derived IMR (angio-IMR) could be used as an alternative to conventional pressure wire-derived IMR in patients with STEMI for prognostic stratification.11,12 Given its simplicity and time- and cost-effectiveness without need for additional procedure(s), angio-IMR would be particularly beneficial in patients with STEMI.
In this regard, the current study aimed to investigate the feasibility of angio-IMR in the evaluation of MVO after successful primary PCI in patients with STEMI.
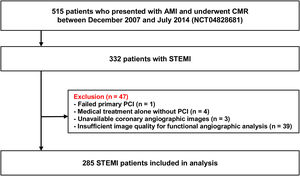
METHODSStudy populationThe study population was derived from the prospective acute myocardial infarction (AMI)-CMR registry of an academic tertiary medical center. In this single-center registry, 515 consecutive patients who presented with AMI and underwent CMR were prospectively enrolled between December 2007 and July 2014. The current study was a retrospective post hoc analysis of the prospective registry data. AMI was defined as the presence of clinical, electrocardiographic, or echocardiographic evidence of myocardial ischemia with elevated cardiac troponin levels above the 99th percentile of upper reference limit. Among the total patients, patients with STEMI (n=332) were selected for the current study, in whom electrocardiogram showed a ST-segment elevation more than 1mm in 2 or more contiguous leads or a presumably new-onset left bundle branch block. Patients with failed primary PCI (n=1), medical treatment alone without PCI (n=4), unavailable coronary angiographic images (n=3), and insufficient image quality for functional angiographic analysis (n=39) were excluded. Following these exclusions, a total of 285 patients were analyzed in the current study (figure 1). The Institutional Review Board of our institute approved this study, and all participants provided written informed consent. Demographic data and cardiovascular risk factors were recorded at the time of the index procedure. The study protocol was registered in clinicaltrials.gov (NCT04828681).
Coronary angiography and primary percutaneous coronary intervention
Coronary angiography was performed using standard techniques. Angiographic views were obtained following administration of intracoronary nitrate (100 or 200μg) using a 5-Fr diagnostic catheter and a 6-Fr guiding catheter in pre- and post-PCI, respectively. For contrast injection, contrast media was injected into a coronary artery through the catheter at a rate of 3 and 4mL/s, respectively, for right and left coronary arteries for approximately 2seconds using an automated injector (ACIST Medical Systems, Eden Prairie, USA). Primary PCI was performed by standard techniques. All angiograms were analyzed in a blinded fashion by independent core laboratory personnel and quantitative coronary angiography was performed in optimal projections with validated software (CAAS II, Pie Medical Imaging, Netherlands).
Analysis of angiography-derived index of microcirculatory resistanceFor the derivation of angio-IMR, angiographic images were analyzed in a post hoc fashion using commercial software (FlashAngio, Rainmed Ltd, China) at an independent core laboratory (Zhongshan Hospital, Fudan University, Shanghai Institute of Cardiovascular Diseases, Shanghai, China). Prior studies have shown the details of angio-IMR derivation,10,11 based on the assumption that mean flow velocity in the entire period of diastole is approximately proportional to that in hyperemia. Briefly, Digital Imaging and Communications in Medicine angiography images and aortic pressures were registered in the FlashAngio console.10 Then, angio-IMR was estimated in 3 steps.8,10,11 First, a 3-dimensional mesh model of the coronary artery was reconstructed along the vessel from the inlet to the distal segment of the target vessel, using at least 2 angiographic projections separated by at least 30̊. Second, angiography-derived FFR (angio-FFR) was estimated by computational pressure-flow dynamics, as described previously.8 Finally, angio-IMR was calculated using the following equation: angio-IMR=estimated hyperemic aortic pressure (Pa) × angio-FFR × (vessel length / K × Vdiastole).10,11 Estimated hyperemic Pa was assumed on the basis of mean arterial pressure (MAP) during the index procedure: MAP x 0.2 when MAP ≥ 95mmHg and MAP x 0.15 when MAP <95mmHg.8,11 Vessel length was determined as the distance between the inlet and the distal segment of the target vessel where angio-FFR and angio-IMR values were acquired.11 K was the constant to adjust the difference between resting and hyperemic flow velocity. Vdiastole represented resting flow velocity during diastole which was derived from the thrombolysis in myocardial infarction (TIMI) frame count method.11
Cardiac magnetic resonance imagingCMR was performed a median of 3.0 days (interquartile range [IQR], 3.0-5.0) after primary PCI using a 1.5T scanner (Magnetom Avanto, Syngo MR D13 version; Siemens Medical Solutions, Germany) with a 32-channel phased array receiver coil. Cine images of the left ventricle (LV) were acquired through a steady-state free-precession sequence in the short-axis, 4-chamber, 3-chamber, and 2-chamber views. T2-weighted black blood images were acquired using a segmented turbo spin-echo sequence in the same short-axis view as the cine sequences. Late gadolinium enhancement images covering the entire LV were acquired 10minutes after intravenous injection of 0.15 mmoL/kg gadobutrol (Bayer Healthcare, Germany) by using segmented phase-sensitive inversion-recovery turbo fast low-angle shot in a contiguous short-axis LV stack. Inversion times were individually adjusted to optimize nulling of visually normal myocardium (200 to 350 msec). All CMR measurements were independently performed in a blinded fashion by experienced cardiovascular radiologists at the same institute. Left ventricular volume analysis was performed using a commercialized software (CAAS MRV version 1.0, Pie Medical Imaging B.V., The Netherlands).13 The endocardial and epicardial borders were manually traced, and papillary muscles and LV trabeculae were excluded from the endocardium.13 The T2-weighted image was used to determine the presence of intramyocardial hemorrhage and quantification of area at risk (AAR).13 Hyperenhanced area was specified as an infarcted area, and hypoenhancement within the hyperenhanced area was considered as evidence of MVO.13 The volume of delayed hyperenhancement was calculated as the sum of the area of delayed hyperenhancement within each segment multiplied by 10mm.13 The proportion of delayed hyperenhancement to LV myocardial volume was defined as infarct size (%). The extent of MVO was calculated in the same manner. The myocardial salvage index was calculated as follows: (AAR-infarct size) × 100/AAR.13
Two-dimensional echocardiographyAll patients underwent comprehensive 2-dimensional echocardiography at baseline (median 2.0 days, [1.0-3.0]) and at 6 months of follow-up (median 199.0 days, [179.0-259.0]). LV wall thickness and LV dimensions were measured at the parasternal long-axis view using standard methods based on the current guidelines.14 LV mass was calculated at the end of diastole by the linear method.14 LV ejection fraction (LVEF) was assessed by the biplane Simpson technique or visual estimation. Transmitral inflow velocities (E and A) and deceleration time were obtained by pulsed-wave Doppler performed in the apical 4-chamber view. Tissue Doppler imaging was used to assess early (e’) and late (a’) atrial diastolic annular velocities in the apical 4-chamber view, and the lateral and septal mitral annulus velocities were averaged. A semiquantitative wall motion score was visually assessed and assigned to each LV segment to calculate the wall motion score index as the average of the scores of all segments visualized (sum score of all segments assessed/number of segments assessed).14
Statistical analysisAll categorical variables are presented as numbers with relative frequencies, and continuous variables as means with standard deviations or medians with IQR according to their distributions, which were checked by the skewness and kurtosis test and visual inspection of Q-Q plots. The correlations between angio-IMR values and CMR-derived quantitative parameters (extent of MVO, infarct size, and AAR) were assessed by calculating Pearson or Spearman correlation coefficients according to the normality. The CMR-derived parameters and echocardiographic parameters were compared according to angio-IMR values with a cutoff value of 40, based on the previous studies.1,5–7,11 Multivariable logistic regression analysis was used to calculate odds ratios (OR) with 95% confidence intervals (95%CI) to find independent predictors for MVO. A multivariable regression model was constructed using all variables with a P value <.1 in the univariable analyses. Using a receiver operating characteristic curve and an area under the curve (AUC), the discriminatory ability of angio-IMR values to predict the presence of MVO in CMR was compared with that of conventional angiographic measures of culprit vessel reperfusion, including TIMI flow grade and myocardial blush grade. All probability values were 2-sided, and P values <.05 were considered statistically significant.
RESULTSBaseline characteristics of study populationAmong the total population, 154 patients (54.0%) had angio-IMR> 40 U and 131 patients (46.0%) had angio-IMR ≤ 40 U. There was no significant difference in demographics or cardiovascular risk factors between the 2 groups (table 1). Patients with angio-IMR> 40 U had higher peak troponin I and creatine kinase-MB levels and tended to have left anterior descending artery as the culprit vessel of STEMI than those with angio-IMR ≤ 40 U. Although there was no significant difference in door-to-balloon time and pre-PCI TIMI flow grade between the 2 groups, TIMI flow grade ≤ 2 after primary PCI was more prevalent among patients with angio-IMR> 40 U. In contrast, post-PCI myocardial brush grade and the incidence of no reflow were similar between the 2 groups. Patients with angio-IMR> 40 U showed a higher mean post-PCI angio-FFR value than those with angio-IMR ≤ 40 U (0.88±0.05 vs 0.92±0.05, P <.001) (table 1).
Baseline characteristics of the study population
| Variables | Total(N=285) | Angio-IMR ≤ 40 U(n=131, 46.0%) | Angio-IMR> 40 U(n=154, 54.0%) | P |
|---|---|---|---|---|
| Patient characteristics | ||||
| Demographics | ||||
| Age, y | 59.5±12.1 | 60.4±11.7 | 58.7±12.5 | .236 |
| Male sex | 232 (81.4) | 104 (79.4) | 128 (83.1) | .420 |
| Body mass index, kg/m2 | 24.6±3.4 | 24.5±3.2 | 24.7±3.6 | .661 |
| Cardiovascular risk factors | ||||
| Hypertension | 122 (42.8) | 61 (46.6) | 61 (39.6) | .237 |
| Diabetes mellitus | 70 (24.6) | 31 (23.7) | 39 (25.3) | .746 |
| Hyperlipidemia | 47 (16.5) | 20 (15.3) | 27 (17.5) | .608 |
| Current smoker | 138 (48.4) | 62 (47.3) | 76 (49.4) | .733 |
| Previous percutaneous coronary intervention | 14 (4.9) | 7 (5.3) | 7 (4.6) | .789 |
| Previous myocardial infarction | 10 (3.5) | 5 (3.8) | 5 (3.3) | .999 |
| Multivessel disease | 123 (43.2) | 57 (43.5) | 66 (42.9) | .999 |
| Hemodynamic parameters | ||||
| Systolic blood pressure, mmHg | 115 [102-127] | 112 [99-124] | 115 [107-131] | .046 |
| Diastolic blood pressure, mmHg | 71 [63-80] | 70 [60-78] | 73 [65-81] | .017 |
| Laboratory profiles | ||||
| Peak troponin I, ng/mL | 61.2 [16.3-143.1] | 31.9 [7.6-83.8] | 86.9 [38.4-173.2] | <.001 |
| Peak CK-MB, ng/mL | 171.1 [60.8-276.4] | 101.5 [36.7-196.7] | 234.8 [133.6-319.7] | <.001 |
| High sensitivity CRP, mg/dL | 1.2 [0.3-7.6] | 1.3 [0.3-7.9] | 1.2 [0.3-7.5] | .964 |
| Low density lipoprotein, mg/dL | 127.0 [100.0-150.0] | 123.0 [99.0-142.0] | 131 [100.0-151.0] | .111 |
| Discharge medication | ||||
| Aspirin | 281 (98.6) | 130 (99.2) | 151 (98.1) | .397 |
| P2Y12 inhibitor | 279 (97.9) | 129 (98.5) | 150 (97.4) | .530 |
| Beta-blocker | 262 (91.9) | 120 (91.6) | 142 (92.2) | .852 |
| RAAS blockade | 233 (81.8) | 107 (81.7) | 126 (81.8) | .976 |
| Statin | 272 (95.4) | 128 (97.7) | 144 (93.5) | .152 |
| Lesion characteristics | ||||
| Culprit vessel | .001 | |||
| Left anterior descending artery | 155 (54.4) | 63 (48.1) | 92 (59.7) | |
| Left circumflex artery | 29 (10.2) | 8 (6.1) | 21 (13.6) | |
| Right coronary artery | 101 (35.4) | 60 (45.8) | 41 (26.6) | |
| Procedural characteristics | ||||
| Door-to-balloon time, min | 68 [50-81] | 68 [48-82] | 67 [51-80] | .588 |
| Pre-PCI TIMI grade | .440 | |||
| TIMI 0 | 215 (75.4) | 95 (72.5) | 120 (77.9) | |
| TIMI 1 | 17 (6.0) | 9 (6.9) | 8 (5.2) | |
| TIMI 2 | 28 (9.8) | 12 (9.2) | 16 (10.4) | |
| TIMI 3 | 25 (8.8) | 15 (11.5) | 10 (6.5) | |
| Post-PCI TIMI grade | .014 | |||
| TIMI ≤ 2 | 17 (6.0) | 2 (1.5) | 15 (9.7) | |
| TIMI 3 | 268 (94.0) | 129 (98.5) | 139 (90.3) | |
| Post-PCI myocardial blush grade | .243 | |||
| Grade 1 | 1 (0.4) | 1 (0.8) | 0 (0.0) | |
| Grade 2 | 19 (6.7) | 6 (4.6) | 13 (8.4) | |
| Grade 3 | 265 (93.0) | 124 (94.7) | 141 (91.6) | |
| TIMI frame count | 9 [7-12] | 9 [7-11] | 10 [7-13] | .103 |
| No reflow | 17 (6.0) | 5 (3.8) | 12 (7.8) | .158 |
| Thrombus aspiration | 181 (63.5) | 75 (57.3) | 106 (68.8) | .043 |
| Side branch occlusion | 6 (2.1) | 2 (1.5) | 4 (2.6) | .690 |
| Glycoprotein IIb/IIIa inhibitor use | 50 (17.5) | 18 (13.7) | 32 (20.8) | .119 |
| Total number of stents | 1.2±0.6 | 1.2±0.7 | 1.2±0.6 | .954 |
| Mean stent diameter | 3.2±0.5 | 3.2±0.5 | 3.2±0.6 | .628 |
| Total length of stents | 31.0±17.2 | 30.9±17.2 | 31.1±17.2 | .952 |
| Angiography-derived physiologic indices | ||||
| Angiography-derived FFR, post-PCI | 0.90±0.05 | 0.88±0.05 | 0.92±0.05 | <.001 |
| Angiography-derived IMR, U | 40.6±13.8 | 29.5±6.4 | 50.2±10.9 | <.001 |
CK-MB, creatine kinase-MB; CRP, C-reactive protein; FFR, fractional flow reservice; IMR, index of microcirculatory resistance; PCI, percutaneous coronary intervention; RAAS, renin-angiotensin-aldosterone system; TIMI, thrombolysis in myocardial infarction.
Values are expressed as No. (%), mean±standard deviation, or median [interquartile range].
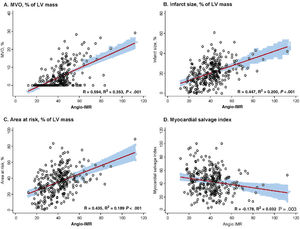
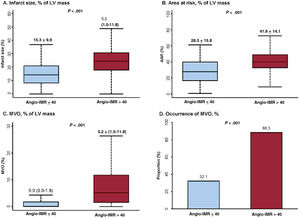
Angio-IMR showed a significant correlation with CMR-derived infarct size, extent of MVO, and AAR (P <.001 for all) (figure 2). Compared with patients with angio-IMR ≤ 40 U, those with angio-IMR> 40 U had a significantly larger infarct size (15.3±9.9% vs 24.9±10.4%, P <.001), AAR (28.3±15.8% vs 41.6±14.1%, P <.001), and extent of MVO (0.0% [0.0-1.8] vs 5.2% [1.5-11.8], P <.001). Conversely, the angio-IMR ≤ 40 U group showed a significantly higher myocardial salvage index than the angio-IMR> 40 U group. In the current study, 62.5% (n=178) of STEMI patients who underwent primary PCI and CMR were found to have MVO (table 2). Most patients with angio-IMR> 40 U (88.3%) were found to have MVO in CMR, whereas less than one-third of patients with angio-IMR ≤ 40 U (32.1%) showed MVO in CMR (table 2 and figure 3). The extent of MVO among those patients with angio-IMR ≤ 40 U and MVO was significantly less than that of patients with angio-IMR> 40 U and MVO (3.0% [2.1-5.1] vs 6.0% [2.5-13.2], respectively, P <.001) (). Figure 4 shows representative case examples of patients with and without MVO and their angio-IMR values.
 MVO (% of LV mass), (B) infarct size (% of LV mass), (C) area at risk (% of LV mass), and (D) myocardial salvage index, are demonstrated. Angio-IMR, functional angiography-derived IMR; CMR, cardiac magnetic resonance; IMR, index of microcirculatory resistance; LV, left ventricular; MVO, microvascular obstruction; PCI, percutaneous coronary intervention; STEMI, ST-segment elevation myocardial infarction.")
Correlation between angio-IMR and CMR parameters. The correlations between angio-IMR and CMR-derived parameters after primary PCI for STEMI, including (A) MVO (% of LV mass), (B) infarct size (% of LV mass), (C) area at risk (% of LV mass), and (D) myocardial salvage index, are demonstrated. Angio-IMR, functional angiography-derived IMR; CMR, cardiac magnetic resonance; IMR, index of microcirculatory resistance; LV, left ventricular; MVO, microvascular obstruction; PCI, percutaneous coronary intervention; STEMI, ST-segment elevation myocardial infarction.
CMR parameters according to angiography-derived IMR
| CMR parameters | Total(N=285) | Angio-IMR ≤ 40 U(n=131, 46.0%) | Angio-IMR> 40 U(n=154, 54.0%) | P |
|---|---|---|---|---|
| Time from PCI to CMR, d | 3.0 [3.0-5.0] | 4.0 [3.0-5.0] | 3.0 [3.0-4.0] | .516 |
| LVEDV, mL | 146.6±34.5 | 143.3±38.0 | 149.4±31.1 | .135 |
| LVESV, mL | 72.2±31.4 | 66.8±35.9 | 76.8±26.3 | .008 |
| LVEF, % | 52.1±10.6 | 55.1±11.2 | 49.5±9.3 | <.001 |
| Infarct size, mL | 21.5±12.8 | 15.1±9.7 | 27.0±12.6 | <.001 |
| Infarct size, % of LV mass | 20.5±11.2 | 15.3±9.9 | 24.9±10.4 | <.001 |
| Area at risk, % of LV mass | 35.5±16.3 | 28.3±15.8 | 41.6±14.1 | <.001 |
| Myocardial salvage index | 43.2±18.3 | 46.4±19.4 | 40.5±16.8 | .006 |
| MVO | 178 (62.5) | 42 (32.1) | 136 (88.3) | <.001 |
| MVO, % of LV mass | 2.0 [0.0-6.3] | 0.0 [0.0-1.8] | 5.2 [1.5-11.8] | <.001 |
| Intramyocardial hemorrhage | 136 (48.1) | 39 (30.2) | 97 (63.0) | <.001 |
CMR, cardiac magnetic resonance imaging; IMR, index of microcirculatory resistance; LV, left ventricle; LVEDV, left ventricular end-diastolic volume; LVESV, left ventricular end-systolic volume; LVEF, left ventricular ejection fraction; MVO, microvascular obstruction; PCI, percutaneous coronary intervention.
Values are expressed as No. (%), mean±standard deviation, or median [interquartile range].
 infarct size, (B) area at risk, (C) extent of MVO, and (D) proportion of MVO are compared according to the angio-IMR after primary PCI for ST-segment elevation myocardial infarction. Values are expressed as means±standard deviations or proportions (%). In box-and-whisker plots, the horizontal line indicates median value, box indicates the interquartile range, and whiskers indicate the minimum and maximum values excluding outliers. AAR, area at risk; angio-IMR, functional angiography-derived IMR; CMR, cardiac magnetic resonance; IMR, index of microcirculatory resistance; LV, left ventricular; MVO, microvascular obstruction.")
Comparison of CMR parameters according to angio-IMR. CMR-derived parameters including (A) infarct size, (B) area at risk, (C) extent of MVO, and (D) proportion of MVO are compared according to the angio-IMR after primary PCI for ST-segment elevation myocardial infarction. Values are expressed as means±standard deviations or proportions (%). In box-and-whisker plots, the horizontal line indicates median value, box indicates the interquartile range, and whiskers indicate the minimum and maximum values excluding outliers. AAR, area at risk; angio-IMR, functional angiography-derived IMR; CMR, cardiac magnetic resonance; IMR, index of microcirculatory resistance; LV, left ventricular; MVO, microvascular obstruction.
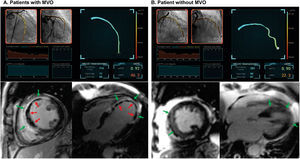
 during primary percutaneous coronary intervention are shown. A: the patient had an elevated angio-IMR value of 46.2, which was calculated from postpercutaneous coronary intervention angiographic images. Cardiac magnetic resonance imaging demonstrated an infarcted area (in green arrows) and evidence of MVO (in red arrows). B: the patient had an angio-IMR value of 22.3, which suggested relatively preserved microcirculatory function after ST-segment elevation myocardial infarction. Cardiac magnetic resonance imaging demonstrated an infarcted area (in green arrows) but there was no evidence of MVO. IMR, index of microcirculatory resistance; MVO, microvascular obstruction.")
Representative case examples. Two representative case examples of ST-segment elevation myocardial infarction patients who underwent successful revascularization of the epicardial culprit vessel (LAD) during primary percutaneous coronary intervention are shown. A: the patient had an elevated angio-IMR value of 46.2, which was calculated from postpercutaneous coronary intervention angiographic images. Cardiac magnetic resonance imaging demonstrated an infarcted area (in green arrows) and evidence of MVO (in red arrows). B: the patient had an angio-IMR value of 22.3, which suggested relatively preserved microcirculatory function after ST-segment elevation myocardial infarction. Cardiac magnetic resonance imaging demonstrated an infarcted area (in green arrows) but there was no evidence of MVO. IMR, index of microcirculatory resistance; MVO, microvascular obstruction.
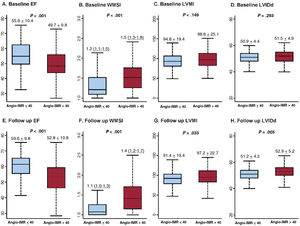
Table 3 and figure 5 show baseline and follow-up echocardiographic parameters according to angio-IMR. Compared with patients with angio-IMR ≤ 40 U, those with angio-IMR> 40 U had a lower LVEF (55.6±10.4% vs 49.7±9.8%, P <.001) and a higher wall motion score index (1.2 [1.1-1.5] vs 1.5 [1.3-1.8], P <.001) on baseline echocardiography. This difference persisted at the 6-month follow-up echocardiogram (LVEF: 59.6±9.8 vs 52.8±10.8; wall motion score index 1.1 [1.0-1.3] vs 1.4 [1.2-1.7], P <.001 for all). At baseline, there was no statistically significant difference in LV mass index or LV internal dimension in end diastole between the 2 groups. At the 6-month follow-up echocardiography, however, patients with angio-IMR> 40 U showed a larger LV internal dimension in end diastole and higher LV mass index than those with angio-IMR ≤ 40 U (table 3 and figure 5). shows changes in LVEF, E/e’, and wall motion score index during follow-up according to angio-IMR.
Echocardiographic parameters according to angiography-derived IMR
| Echocardiographic parameters | Total(N=285) | Angio-IMR ≤ 40 U(n=131, 46.0%) | Angio-IMR> 40 U(n=154, 54.0%) | P |
|---|---|---|---|---|
| Baseline echocardiogram | ||||
| Time to echocardiogram, d | 2.0 [1.0-3.0] | 3.0 [1.0-4.0] | 2.0 [1.0-3.0] | .342 |
| LVEF, % | 52.4±10.5 | 55.6±10.4 | 49.7±9.8 | <.001 |
| Wall motion score index | 1.4 [1.2-1.7] | 1.2 [1.1-1.5] | 1.5 [1.3-1.8] | <.001 |
| LVIDd, mm | 51.2±4.7 | 50.9±4.4 | 51.5±4.9 | .293 |
| LVIDs, mm | 33.8±6.2 | 32.5±6.0 | 34.8±6.1 | .002 |
| LV mass index | 96.9±22.7 | 94.8±19.4 | 98.8±25.1 | .149 |
| Mitral E/e’ | 10.8±4.4 | 10.7±5.0 | 10.9±3.8 | .722 |
| Follow-up echocardiogram | ||||
| Time to echocardiogram, d | 199.0 [179.0-259.0] | 199.0 [179.0-239.0] | 201.0 [178.0-282.0] | .470 |
| LVEF, % | 55.9±10.9 | 59.6±9.8 | 52.8±10.8 | <.001 |
| Wall motion score index | 1.2 [1.1-1.6] | 1.1 [1.0-1.3] | 1.4 [1.2-1.7] | <.001 |
| LVIDd, mm | 52.1±4.8 | 51.2±4.2 | 52.9±5.2 | .005 |
| LVIDs, mm | 33.6±6.2 | 32.0±5.5 | 34.8±6.4 | <.001 |
| LV mass index | 94.6±21.4 | 91.4±19.4 | 97.2±22.7 | .033 |
| Mitral E/e’ | 9.6±3.5 | 9.3±3.7 | 9.8±3.4 | .308 |
IMR, index of microcirculatory resistance; LV, left ventricle; LVEF, left ventricular ejection fraction; LVIDd, left ventricular internal dimension in end diastole; LVIDs, left ventricular internal dimension in end-systole.
Values are expressed as medians [interquartile ranges] or means±standard deviations.
 and follow-up echocardiographic parameters (E-H) according to angio-IMR are compared. Values are expressed as means±standard deviations or proportions (%). In box-and-whisker plots, the horizontal line indicates median value, box indicates the interquartile range, and whiskers indicate the minimum and maximum values excluding outliers. EF, ejection fraction; IMR, index of microcirculatory resistance; LVIDd, left ventricular internal dimension in end diastole; LVMI, left ventricular mass index; WMSI, wall motion score index.")
Baseline and follow-up echocardiographic parameters according to angio-IMR. Baseline (A-D) and follow-up echocardiographic parameters (E-H) according to angio-IMR are compared. Values are expressed as means±standard deviations or proportions (%). In box-and-whisker plots, the horizontal line indicates median value, box indicates the interquartile range, and whiskers indicate the minimum and maximum values excluding outliers. EF, ejection fraction; IMR, index of microcirculatory resistance; LVIDd, left ventricular internal dimension in end diastole; LVMI, left ventricular mass index; WMSI, wall motion score index.
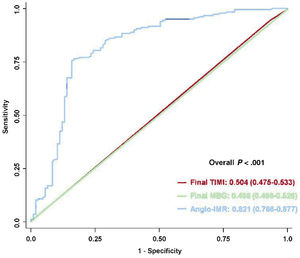
In the multivariable logistic regression analysis, elevated angio-IMR> 40 U was a strong independent predictor for the presence of MVO in CMR after primary PCI for STEMI (OR, 12.24; 95%CI, 6.310-23.75, P <.001) (table 4). Furthermore, angio-IMR in a continuous variable was independently associated with the presence of MVO (per 1 U increase of angio-IMR: OR, 1.102; 95%CI, 1.068-1.137, P <.001) (). When comparing the discriminatory ability of angio-IMR with that of conventional angiographic measures of myocardial reperfusion, angio-IMR showed a significantly higher discriminatory ability for the presence of MVO than TIMI flow grade or myocardial blush grade after primary PCI (AUC 0.821, 0.504, and 0.496, respectively, P <.001) (figure 6). This result persisted irrespective of the culprit vessel location (). Furthermore, angio-IMR also showed a significantly higher discriminatory ability for the presence of MVO than TIMI frame count (AUC 0.821 vs 0.502, respectively, P <.001) ().
Independent predictors for MVO determined by CMR
| Variable | Univariable analysis | Multivariable analysis* | ||
|---|---|---|---|---|
| OR (95%CI) | P | OR (95%CI) | P | |
| Angio-IMR> 40 U | 16.01 (8.670-29.57) | <.001 | 12.24 (6.310-23.75) | <.001 |
| Age | 0.991 (0.971-1.011) | .362 | ||
| Female sex | 1.795 (0.983-3.279) | .057 | 2.137 (0.958-4.765) | .064 |
| Diabetes mellitus | 1.556 (0.871-2.777) | .135 | ||
| Current smoker | 1.419 (0.876-2.299) | .156 | ||
| Door-to-balloon time, per 1min increase | 0.998 (0.996-1.000) | .083 | 0.998 (0.995-1.001) | .236 |
| Peak CK-MB, per 1 ng/mL increase | 1.008 (1.005-1.010) | <.001 | 1.003 (1.000-1.006) | .030 |
| Peak troponin I, per 1 ng/mL increase | 1.011 (1.007-1.015) | <.001 | 1.006 (1.001-1.010) | .011 |
| Initial TIMI flow of 0 | 1.837 (1.063-3.175) | .029 | 1.318 (0.622-2.792) | .471 |
| Post TIMI flow ≤ 2 | 0.850 (0.314-2.305) | .750 | ||
| Post MBG ≤ 2 | 1.126 (0.434-2.916) | .808 | ||
| No reflow | 1.475 (0.505-4.308) | .478 | ||
| TIMI frame count | 1.004 (0.951-1.059) | .896 | ||
| Use of glycoprotein IIb/IIIa inhibitor | 0.882 (0.472-1.647) | .693 | ||
95%CI, 95% confidence interval; CK-MB, creatine kinase-MB; CMR, cardiac magnetic resonance imaging; IMR, index of microcirculatory resistance; MBG, myocardial brush grade; MVO, microvascular obstruction; OR, odds ratios; TIMI, thrombolysis in myocardial infarction.
, final TIMI flow grade (in red), and final MBG (in green) to predict CMR-defined MVO are compared. Values are area under the curves and 95% confidence intervals. IMR, index of microcirculatory resistance; MBG, myocardial blush grade; MVO, microvascular obstruction; TIMI, Thrombolysis in Myocardial Infarction.")
Comparison of discriminatory ability to predict CMR-defined MVO. The receiver operating characteristic curves of post-PCI angio-IMR (in blue), final TIMI flow grade (in red), and final MBG (in green) to predict CMR-defined MVO are compared. Values are area under the curves and 95% confidence intervals. IMR, index of microcirculatory resistance; MBG, myocardial blush grade; MVO, microvascular obstruction; TIMI, Thrombolysis in Myocardial Infarction.
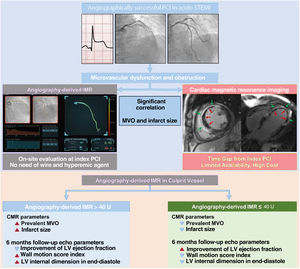
The current study evaluated the feasibility of pressure wire-free, functional angiography-derived IMR (angio-IMR) in the assessment of MVO after primary PCI in patients with STEMI. The study showed that angio-IMR was significantly associated with the extent of MVO in CMR, and an elevated angio-IMR> 40 U was an independent predictor for the presence of MVO with a significantly higher discriminatory ability than conventional angiographic measures of myocardial reperfusion (figure 7).

Central illustration. Functional coronary angiography-derived IMR and CMR for microvascular dysfunction after successful PCI in acute STEMI. CMR, cardiac magnetic resonance; IMR, index of microcirculatory resistance; LV, left ventricle; MVO, microvascular obstruction; PCI, percutaneous coronary intervention; STEMI, ST-segment elevation myocardial infarction.
Despite successful restoration of epicardial coronary blood flow, failure of myocardial reperfusion has been reported in up to two-thirds of STEMI patients with the occurrence of MVO.1–3 In line with previous studies, the current study also showed that 62.5% of STEMI patients had evidence of MVO in CMR. CMR is the most sensitive and specific technique that enables direct visualization and quantification of MVO.15 However, obtaining CMR in STEMI patients is limited in daily practice, and the time gap between primary PCI and CMR may limit the usefulness of CMR in the detection of MVO to guide adjunctive therapies early after revascularization. In contrast, coronary angiographic findings such as reduced antegrade blood flow (TIMI flow grade ≤ 2) or impaired penetration of contrast into the myocardium (myocardial blush grade <2) enable assessment of MVO at the time of primary PCI. However, these measures have limited reproducibility and accuracy.1,2 In fact, MVO was found in more than half of STEMI patients in whom TIMI flow grade 3 was achieved after primary PCI,1,2 and the incidence of MVO assessed by CMR was significantly higher than that assessed by conventional angiographic measures.3 The current study also demonstrated that the presence of MVO was not associated with no reflow, TIMI flow grade ≤ 2 or myocardial blush grade <2 after primary PCI. Furthermore, final TIMI flow grade or myocardial blush grade did not have discriminatory ability to predict the presence of MVO, with an AUC of 0.504 (95%CI, 0.475-0.533) and 0.496 (95%CI, 0.466-0.526), respectively. These results suggested a limited clinical role of an angiographic surrogate marker of MVO or myocardial reperfusion.
Microcirculatory index and evaluation of microvascular obstruction in ST-segment elevation myocardial infarctionIn this context, physiologic evaluation with IMR would be beneficial, which allows objective and more accurate assessment of coronary microcirculatory function at the time of primary PCI. Studies have demonstrated that an elevated IMR> 40 U after primary PCI is significantly associated with the presence of MVO in CMR and the development of adverse clinical events in STEMI patients.1,5–7 However, measuring IMR requires additional use of a pressure-temperature sensor wire, which prolongs procedure time and induction of hyperemia and which usually causes a hypotensive response. These requirements limit the adoption of IMR in daily practice, especially when dealing with acutely ill patients with STEMI. However, recent technical advances have enabled derivation of IMR from angiographic images (angio-IMR) without the need for pressure wire and hyperemic agent.8–10 Therefore, the introduction of angio-IMR could significantly expand the use of IMR in daily practice.
We recently published a validation study using the same software and methodology that were used in the current study to calculate angio-IMR, which showed a significant correlation between conventional IMR and angio-IMR in STEMI patients (R=0.782; P <.001).11 It also showed an excellent diagnostic accuracy of angio-IMR to predict conventional IMR> 40 U (sensitivity 75.0%, specificity 84.2%, accuracy 80.6%, and AUC 0.899 [95%CI, 0.786-0.949]), and patients with elevated angio-IMR> 40 U after primary PCI showed a significantly higher risk of adverse cardiovascular events.11 The current study first demonstrated the use of angio-IMR in the evaluation of MVO after primary PCI for STEMI. Importantly, an elevated angio-IMR> 40 U after primary PCI for STEMI was highly predictive of the presence of MVO with a significantly higher discriminatory ability than conventional angiographic measures of myocardial reperfusion.
Clinical implications and future directionsSince MVO could be a potential therapeutic target in patients with STEMI, timely on-site evaluation of MVO would be beneficial. Although the exact time required for the derivation of angio-IMR was not assessed in the current study, it can be calculated immediately after the derivation of angio-FFR, which only took a median of 5minutes [IQR 3.5-6.1] in the recent study.16 This further supports the applicability of angio-IMR in daily practice. In the current study, 88.3% of patients with an elevated angio-IMR> 40 U after primary PCI showed evidence of MVO in CMR with significantly higher extent of MVO, infarct size, and AAR compared with those with angio-IMR ≤ 40U. Nevertheless, it should be noted that 32.1% of patients with angio-IMR ≤ 40 U also showed MVO in CMR. However, the extent of MVO in those patients with angio-IMR ≤ 40 U and MVO was significantly less than that of the patients with angio-IMR> 40 U and MVO (3.0% [2.1-5.1] vs 6.0% [2.5-13.2], respectively, P <.001). In addition, a prior study showed that patients with MVO but relatively preserved microcirculatory function manifested by IMR ≤ 40 U experienced significant regression in infarct size over time without prespecified adjunctive treatments after primary PCI.7 Furthermore, angio-IMR showed a significant prognostic value after primary PCI in STEMI patients with a 3-fold increased risk of cardiac death and heart failure readmission among the patients with an elevated angio-IMR> 40U.11 Therefore, angio-IMR could play a role in identification of patients who would most benefit from potential adjunctive therapies to reduce MVO following primary PCI. Nevertheless, the results of the current study support an association between angio-IMR and MVO in CMR, but not the equivalence between the two.
There have been efforts to find effective adjunctive treatments, such as intracoronary administration of thrombolytic or vasodilatory agents, to reduce microcirculatory dysfunction or MVO and improve outcomes after primary PCI.17–19 Yet use of glycoprotein IIb/IIIa inhibitors is only proposed in the current guidelines if there is evidence of no reflow or a thrombotic complication. One important missing factor relates to the identification of patients at higher risk of developing MVO who would benefit from adjunctive treatments. Given the importance of coronary microcirculatory function and the common discrepancy between angiographic and physiologic parameters in evaluation of MVO, angio-IMR may allow better selection of patients benefitting from potential adjunctive therapies following primary PCI. In fact, a recent observational study showed the potential benefits of IMR-guided pressure-controlled intermittent coronary sinus occlusion during primary PCI in patients with STEMI.20 Therefore, further studies are needed to evaluate the feasibility and efficacy of angio-IMR-guided individualized treatment strategies following primary PCI to reduce MVO in patients with STEMI.
LimitationsSeveral limitations should be noted. First, since the current study did not collect clinical outcome data, the prognostic implications of angio-IMR and CMR parameters could not be assessed. Second, follow-up CMR was not performed, which limited detailed investigation on the dynamic changes of microvascular dysfunction after STEMI. Third, since angio-IMR is an angiography-based index, its accuracy depends on the quality of images and optimal projections. Fourth, the current study focused on microcirculatory dysfunction limited to the culprit vessel territory. Therefore, comparative prognosis according to the presence of underlying microcirculatory dysfunction in the nonculprit vessel territory was not evaluated. Fifth, the timing of CMR varied among patients, which could have affected the findings of CMR. However, most of the patients underwent CMR within 3 to 5 days of the primary PCI. Sixth, the accuracy of angio-IMR could not be examined in the current study since conventional pressure wire-based IMR was not available. However, angio-IMR after primary PCI has been validated in the recent studies by the current authors11 and others.9
CONCLUSIONSAngio-IMR was significantly associated with CMR-derived infarct size, extent of MVO, and AAR. An elevated angio-IMR> 40 U after primary PCI for STEMI was highly predictive of the presence of MVO in CMR. Therefore, angio-IMR, which does not require use of a pressure-temperature sensor wire or induction of hyperemia, may be a practical alternative to the conventional pressure wire-based physiologic index, which enables assessment of microvascular dysfunction and failed myocardial reperfusion after primary PCI for STEMI.
FUNDINGThis work was supported by Rainmed Ltd, Suzhou, China, which provided the software and console of angiography-derived FFR and IMR. The company played no role in the study design, conduct, data analysis or manuscript preparation.
AUTHORS’ CONTRIBUTIONSD. Shin and J. Kim contributed equally to this work. The authors confirm their contributions to the paper as follows: study conception and design: D. Shin, J. Kim, J.M. Lee; data collection: J. Kim, K.H. Choi, N. Dai, Y. Li, S.H. Lee, H.S. Joh, H.K. Kim, S-M. Kim, S.J. Ha, M.J. Jang, T.K. Park, J.H. Yang, Y.B. Song, J-Y. Hahn, S-H. Choi, Y.H. Choe, H-C. Gwon, J.M. Lee; analysis and interpretation of the results: D. Shin, J. Kim, J.M. Lee; draft manuscript preparation: D. Shin, J. Kim, J.M. Lee; critically revising it for important intellectual contents: D. Shin, J. Kim, K.H. Choi, N. Dai, Y. Li, S.H. Lee, S.J. Ha, H.K. Kim, S-M. Kim, S.J. Ha, M.J. Jang, T.K. Park, J.H. Yang, Y.B. Song, J-Y. Hahn, S-H. Choi, Y.H. Choe, H-C. Gwon, J.M. Lee. All authors reviewed the results and approved the final version of the manuscript.
CONFLICTS OF INTERESTDr J.M. Lee received an Institutional Research Grant from St Jude Medical (Abbott Vascular) and Philips Volcano. Dr J.-Y. Hahn received an Institutional Research Grant from St Jude Medical (Abbott Vascular) and Medtronic Inc. All other authors declare that there is no conflict of interest relevant to the submitted work.
- -
MVO in CMR is an adverse prognostic indicator in STEMI patients after successful primary PCI.
- -
The IMR is a pressure wire-based physiologic index that allows quantitative assessment of the microcirculatory function in a target vessel territory.
- -
IMR measured after primary PCI for STEMI is associated with the occurrence of MVO and adverse clinical events.
- -
The current study evaluated the feasibility of pressure wire-free, functional angio-IMR in the evaluation of MVO after primary PCI in patients with STEMI.
- -
Patients with angio-IMR> 40 U had a significantly larger CMR-derived infarct size and extent of MVO (P <.001 for all) compared with patients with angio-IMR ≤ 40 U.
- -
Elevated angio-IMR> 40 U was a strong independent predictor for the presence of CMR-derived MVO after primary PCI for STEMI (odds ratio 12.24, P <.001).
- -
Angio-IMR is a practical alternative to the conventional pressure wire-based physiologic index, which enables assessment of microvascular dysfunction and failed myocardial reperfusion after primary PCI for STEMI.
Supplementary data associated with this article can be found in the online version available at https://doi.org/10.1016/j.rec.2022.01.004