Chronic heart failure is associated with high mortality and utilization of health care and social resources. The objective of this study was to quantify the use of health care and nonhealth care resources and identify variables that help to explain variability in their costs in Spain.
MethodsThis prospective, multicenter, observational study with a 12-month follow-up period included 374 patients with symptomatic heart failure recruited from specialized cardiology clinics. Information was collected on the socioeconomic characteristics of patients and caregivers, health status, health care resources, and professional and nonprofessional caregiving. The monetary cost of the resources used in caring for the health of these patients was evaluated, differentiating among functional classes.
ResultsThe estimated total cost for the 1-year follow-up ranged from € 12 995 to € 18 220, depending on the scenario chosen (base year, 2010). The largest cost item was informal caregiving (59.1%-69.8% of the total cost), followed by health care costs (26.7%- 37.4%), and professional care (3.5%). Of the total health care costs, the largest item corresponded to hospital costs, followed by medication. Total costs differed significantly between patients in functional class II and those in classes III or IV.
ConclusionsHeart failure is a disease that requires the mobilization of a considerable amount of resources. The largest item corresponds to informal care. Both health care and nonhealth care costs are higher in the population with more advanced disease.
Keywords
Chronic heart failure (CHF) is a clinical syndrome produced by an anatomical or functional abnormality of the heart. It is the final outcome of changes in heart function1 in cardiology patients, especially those with hypertension and/or ischemic heart disease.2
According to data from the Spanish National Institute of Statistics, CHF is the fourth leading cause of death in Spain (2010), although there has been a downward trend since 2008.3 This high mortality rate is due to the poor prognosis associated with exacerbation of CHF.4 Despite therapeutic advances, survival in these patients 5 years after diagnosis is around 50%,5–9 lower than that in diseases such as human immunodeficiency virus infection and certain types of cancer. In addition, quality of life is poorer in individuals with CHF than in the general population.10
The prevalence of CHF has increased due to population aging and higher survival rates after myocardial infarction.2,7,8,11–15 Given the population pyramid, CHF will increase demand for health care. Cost analyses are designed to estimate the economic impact of diseases and also evaluate the social burden associated with comorbidities.
A recent review of cost analyses in CHF16 reported that health care costs could represent 1.5% to 2.0% of the total Spanish health care budget, the largest percentage being concentrated in the hospital setting and involving a small percentage of patients with severe heart failure. This review also underlined important limitations in published reports, partly due to methodology and partly due to the paucity of data. Moreover, there are no recent studies on the cost of heart failure in Spain.17–19
The main objective of this study was to evaluate the utilization of health care and nonhealth care resources (family care—informal—and professional care—formal) associated with symptomatic CHF from a social point of view, identifying variables that help to explain variability in cost per patient.
METHODSThis study of the costs occasioned by symptomatic CHF (INOESCARO) was a prospective, observational, multicenter trial, with a scheduled 12-month follow-up and was approved by the ethics committee of Hospital 12 de Octubre in Madrid, Spain.
The inclusion criteria consisted of patients older than 18 years of age who attended specialized cardiology clinics cardiology outpatient clinics with symptomatic CHF (stages C and D and New York Heart Association [NYHA] functional class II, III, or IV), and with a diagnosis of CHF at least 6 months previously. Consecutive patients were enrolled in each center until the assigned number was reached. All of the patients and, when appropriate, the caregiver agreed to participate and provided their informed consent. Patients with severe cognitive impairment or life expectancy < 1 year were excluded, as were those who did not sign the informed consent form.
The patients were recruited in the specialized cardiology clinics of 7 Spanish hospitals (Hospital Central de Asturias, Oviedo; Hospital Marqués de Valdecilla, Santander; Hospital del Mar, Barcelona; Hospital 12 de Octubre, Madrid; Hospital Nuestra Señora de Candelaria, Santa Cruz de Tenerife; Hospital Virgen de la Arrixaca, Murcia; Hospital Infanta Cristina, Badajoz), all of which specialize in heart failure and 4 of which had heart transplantation programs. A procedure for competitive recruitment was established until the target enrollment of 465 patients was reached. Of the 374 patients in the valid sample, the highest number of recruits from a single center was 77 and the lowest was 8.
The investigators collected sociodemographic information on both patients and caregivers, as well as clinical data, functional status, and health-related quality of life in the patients (EuroQol-5D, Minnesota Living With Heart Failure [Questionnaire), caregiver burden (Zarit Burden Interview), hours of professional care (social services) and of nonprofessional (informal) care, and the use of health care services (primary care, specialized care, medication, emergencies managed in primary care and in hospitals, medical transport, and hospital admissions).
Assessment of Health Care and Nonhealth Care ResourcesThe analysis comprised the health care resources utilized by the patients who completed the scheduled follow-up period (12 months) and by those who, despite failing to keep their final appointment at 12 months, had provided sufficient information for the cost estimate. To calculate the use of health care resources such as medication, specialist visits, primary care visits, and medical transport, the investigators used the information recorded on the data collection forms.
All the resources were assessed using 2010 as the base year. The prices provided in the Catalogue of the Spanish Board of Pharmaceutical Associations were used to calculate the cost of drug therapy. To calculate the cost of primary care and specialized care visits, emergency room visits (hospital-based and primary care), and medical transport, we based the unit cost of the visits on information in eSalud, the Spanish health care cost database, from 2010 or from previous years (with the cost updated to 2010 values in line with the Consumer Price Index). To calculate the cost of hospital stays, when the relationship between the cause for admission and a diagnosis-related group was clear, we decided to use the cost corresponding to the identified diagnosis-related group, by using the mean costs published by the Spanish Ministry of Health, Social Services and Equality for 2010. When there was no clear evidence of a diagnosis-related group, we decided that days of hospital stay be evaluated by using the Spanish eSalud health care cost database, which had been updated to 2010 values, based on the Consumer Price Index.
Once informed consent had been signed, the investigators collected information on health care resource utilization throughout the year of follow-up, obtained from the medical records. When a patient had been lost to follow-up because of hospitalization, death, or any other event, the possible cause and resource use associated with any medical activity required were determined. If the center did not indicate the reason for failure to collect information on the patient, he or she was excluded from the analysis.
Informal caregiving was considered to be that provided by individuals who were not professional social or health care workers. Once the caregiver was identified, the hours of caregiving provided by the primary caregiver and by other possible (secondary) caregivers were recorded. Daily activities were distinguished from those performed only occasionally. The recorded data were reviewed and, as a prudence criterion to establish estimates, the maximum number of caregiving hours per person was limited to 112 (16 hours per day for 7 days of caregiving weekly).
The approach employed for the monetary evaluation of informal caregiving was the proxy good method,20 which consists of evaluating the time devoted to caregiving using the market price of a close substitute service. In the first scenario (conservative), the investigators used the mean cost of an hour of home care or home help service in the 3 Spanish autonomous communities with the lowest reported cost (Informe 2008. Las personas mayores en España [2008 report on elderly persons in Spain], IMSERSO21). In the second scenario, we used the mean cost reported by all the autonomous communities of Spain.
Formal caregiving was considered to be that provided by professionals. The resources identified included home care, alarm systems or telehealth, day care centers, and nursing homes. The unit costs of the services were obtained from the 2008 report on elderly persons.21 For professional home care services, the hours of formal caregiving were assessed in the 2 scenarios, as described above for informal caregiving.
Statistical AnalysisDescriptive statistics were used to analyze health care and nonhealth care costs, which are expressed as the mean (standard deviation) and median [interquartile range].
Given the skewness of the distribution of the variables, different statistical approaches were used to analyze costs. For health care costs and total costs, a multivariate analysis was carried out using the symmetrically trimmed least squares method proposed by Powell.22,23 This technique is used in linear regression models in which the dependent variable cannot have a negative value and there is a marked skew that distances it from a normal distribution. For formal care, the investigators used a probit model in which the variable was dichotomized, having a value of 1 when the cost was > 0 and a value of 0 when no social services were received. Finally, informal care was analyzed using an ordered probit model in which the dependent variable had a value of 0 when no care was provided, of 1 when care was provided for ≤ 6h a day, and of 2 when care was provided for > 6h/day.24 The control variables in all 3 models were age, sex, and treatment center, and the main explanatory variable was NYHA functional class at the beginning of the study.
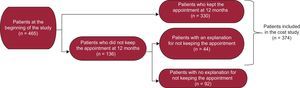
RESULTSAfter 12 months of follow-up, information was available on a sample of 374 patients (including those reported by their centers to be lost to follow-up). Thus, 80.4% of the patients who began the study completed the follow-up. Of the 374 patients with available information, 44 (11.8%) failed to keep the scheduled final appointment. Of these 44 individuals, information was not obtained on 6 because they were hospitalized; another 31 had died and, in 7 patients, there were other circumstances (mainly failure to keep their scheduled appointments) (Figure).

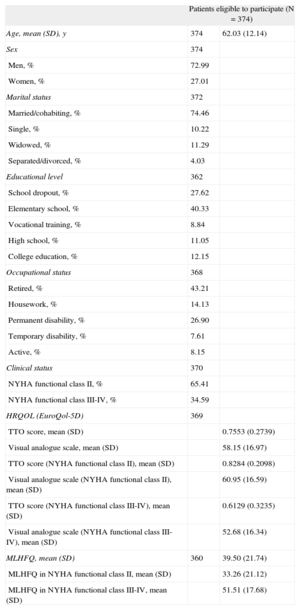
The mean age was 62 years, 73% were men, and 65% were in NYHA functional class II. Table 1 shows the main characteristics of the patients in terms of type of heart disease, marital status, educational level, and health-related quality of life.
Description of the Baseline Characteristics of the Patients
| Patients eligible to participate (N = 374) | ||
| Age, mean (SD), y | 374 | 62.03 (12.14) |
| Sex | 374 | |
| Men, % | 72.99 | |
| Women, % | 27.01 | |
| Marital status | 372 | |
| Married/cohabiting, % | 74.46 | |
| Single, % | 10.22 | |
| Widowed, % | 11.29 | |
| Separated/divorced, % | 4.03 | |
| Educational level | 362 | |
| School dropout, % | 27.62 | |
| Elementary school, % | 40.33 | |
| Vocational training, % | 8.84 | |
| High school, % | 11.05 | |
| College education, % | 12.15 | |
| Occupational status | 368 | |
| Retired, % | 43.21 | |
| Housework, % | 14.13 | |
| Permanent disability, % | 26.90 | |
| Temporary disability, % | 7.61 | |
| Active, % | 8.15 | |
| Clinical status | 370 | |
| NYHA functional class II, % | 65.41 | |
| NYHA functional class III-IV, % | 34.59 | |
| HRQOL (EuroQol-5D) | 369 | |
| TTO score, mean (SD) | 0.7553 (0.2739) | |
| Visual analogue scale, mean (SD) | 58.15 (16.97) | |
| TTO score (NYHA functional class II), mean (SD) | 0.8284 (0.2098) | |
| Visual analogue scale (NYHA functional class II), mean (SD) | 60.95 (16.59) | |
| TTO score (NYHA functional class III-IV), mean (SD) | 0.6129 (0.3235) | |
| Visual analogue scale (NYHA functional class III-IV), mean (SD) | 52.68 (16.34) | |
| MLHFQ, mean (SD) | 360 | 39.50 (21.74) |
| MLHFQ in NYHA functional class II, mean (SD) | 33.26 (21.12) | |
| MLHFQ in NYHA functional class III-IV, mean (SD) | 51.51 (17.68) | |
HRQOL, health-related quality of life; MLHFQ, Minnesota Living With Heart Failure Questionnaire; NYHA, New York heart Association; SD, standard deviation; TTO, time trade-off.
Data are expressed as no., % or mean (standard deviation).
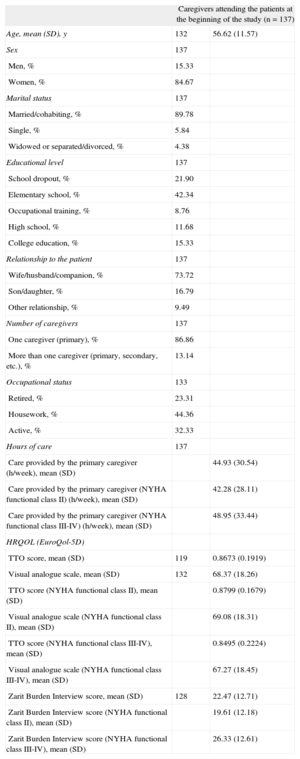
The investigators also identified 137 persons who reported spending time on nonprofessional (informal) caregiving. The mean age of the caregivers was 56.6 years and 85% were women (additional caregiver characteristics are shown in Table 2).
Description of Caregiver Baseline Characteristics
| Caregivers attending the patients at the beginning of the study (n = 137) | ||
| Age, mean (SD), y | 132 | 56.62 (11.57) |
| Sex | 137 | |
| Men, % | 15.33 | |
| Women, % | 84.67 | |
| Marital status | 137 | |
| Married/cohabiting, % | 89.78 | |
| Single, % | 5.84 | |
| Widowed or separated/divorced, % | 4.38 | |
| Educational level | 137 | |
| School dropout, % | 21.90 | |
| Elementary school, % | 42.34 | |
| Occupational training, % | 8.76 | |
| High school, % | 11.68 | |
| College education, % | 15.33 | |
| Relationship to the patient | 137 | |
| Wife/husband/companion, % | 73.72 | |
| Son/daughter, % | 16.79 | |
| Other relationship, % | 9.49 | |
| Number of caregivers | 137 | |
| One caregiver (primary), % | 86.86 | |
| More than one caregiver (primary, secondary, etc.), % | 13.14 | |
| Occupational status | 133 | |
| Retired, % | 23.31 | |
| Housework, % | 44.36 | |
| Active, % | 32.33 | |
| Hours of care | 137 | |
| Care provided by the primary caregiver (h/week), mean (SD) | 44.93 (30.54) | |
| Care provided by the primary caregiver (NYHA functional class II) (h/week), mean (SD) | 42.28 (28.11) | |
| Care provided by the primary caregiver (NYHA functional class III-IV) (h/week), mean (SD) | 48.95 (33.44) | |
| HRQOL (EuroQol-5D) | ||
| TTO score, mean (SD) | 119 | 0.8673 (0.1919) |
| Visual analogue scale, mean (SD) | 132 | 68.37 (18.26) |
| TTO score (NYHA functional class II), mean (SD) | 0.8799 (0.1679) | |
| Visual analogue scale (NYHA functional class II), mean (SD) | 69.08 (18.31) | |
| TTO score (NYHA functional class III-IV), mean (SD) | 0.8495 (0.2224) | |
| Visual analogue scale (NYHA functional class III-IV), mean (SD) | 67.27 (18.45) | |
| Zarit Burden Interview score, mean (SD) | 128 | 22.47 (12.71) |
| Zarit Burden Interview score (NYHA functional class II), mean (SD) | 19.61 (12.18) | |
| Zarit Burden Interview score (NYHA functional class III-IV), mean (SD) | 26.33 (12.61) | |
HRQOL, health-related quality of life; MLHFQ, Minnesota Living With Heart Failure Questionnaire; NYHA, New York heart Association; SD, standard deviation; TTO, time trade-off.
Data are expressed as no., % or mean (standard deviation).
The health-related quality of life variables (EuroQol-5D and the Minnesota Living With Heart Failure questionnaire) revealed important differences in NYHA functional classes (higher score on the EuroQol-5D scale, better health-related quality of life; higher Minnesota Living With Heart Failure Questionnaire score, poorer quality of life). After adjustment for age, the scores on the EuroQol-5D scale in patients in NYHA class II did not differ from those in the general population.
While the Zarit Burden Interview defines mild burden as a score of 46 or more, the physical and mental demands of caregiving did not produce severe burden among study participants, even though they devoted considerable time to this activity.
Analysis of health care resource utilization showed that the 374 patients made an average of 6.4 primary care visits and 4.2 specialist visits. The mean number of hospital admissions per patient was 0.411. In all, 75.4% did not require hospitalization during the entire 12-month follow-up, 13.6% were admitted once, 7.0% twice, and 4.0% 3 or more times. During this period, emergency care was provided at least once to 18.8% of the patients in primary care emergency services and to 32.3% in hospital emergency departments, and 21.93% required medical transport. With regard to formal care, 20 patients received home care, 6 attended day centers, 20 had alarms or telehealth systems installed in their homes, and 4 entered nursing homes.
Informal care was required by 36.6% of the patients. Of these, 86.9% had a single caregiver and the remaining 13.1% had more than one. Among the patients who received care, the average time provided per week was 44.9h; caregiving time was higher in the caregivers of patients in NYHA class III-IV than in those caring for patients in NYHA class II (48.9h vs 42.3h, respectively).
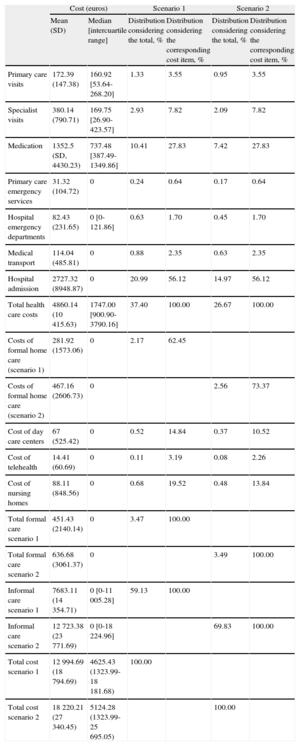
The conversion of health care resource utilization into monetary units is shown in Table 3. Depending on the scenario chosen to assess formal and informal care, the estimated mean total cost ranged from € 12 995 to € 18 220 (the median ranged from € 4625.43 to € 5124.28), and the mean health care cost was estimated to be € 4823 (median, € 1747); the mean costs of formal care ranged from € 451 to € 637 (median, € 0), and the mean costs of care provided by nonprofessionals (informal), from € 7772 to € 12 870 (median, € 0). As can be seen, the mean and median values differed largely due to the skew in cost distribution (< 10% of the patients received formal care and only 36.6% received informal care). Likewise, in the case of health care costs, three fourths of the estimated costs corresponded to one fourth of the patients.
Costs Per Patient With Chronic Heart Failure*
| Cost (euros) | Scenario 1 | Scenario 2 | ||||
| Mean (SD) | Median [intercuartile range] | Distribution considering the total, % | Distribution considering the corresponding cost item, % | Distribution considering the total, % | Distribution considering the corresponding cost item, % | |
| Primary care visits | 172.39 (147.38) | 160.92 [53.64-268.20] | 1.33 | 3.55 | 0.95 | 3.55 |
| Specialist visits | 380.14 (790.71) | 169.75 [26.90-423.57] | 2.93 | 7.82 | 2.09 | 7.82 |
| Medication | 1352.5 (SD, 4430.23) | 737.48 [387.49-1349.86] | 10.41 | 27.83 | 7.42 | 27.83 |
| Primary care emergency services | 31.32 (104.72) | 0 | 0.24 | 0.64 | 0.17 | 0.64 |
| Hospital emergency departments | 82.43 (231.65) | 0 [0-121.86] | 0.63 | 1.70 | 0.45 | 1.70 |
| Medical transport | 114.04 (485.81) | 0 | 0.88 | 2.35 | 0.63 | 2.35 |
| Hospital admission | 2727.32 (8948.87) | 0 | 20.99 | 56.12 | 14.97 | 56.12 |
| Total health care costs | 4860.14 (10 415.63) | 1747.00 [900.90-3790.16] | 37.40 | 100.00 | 26.67 | 100.00 |
| Costs of formal home care (scenario 1) | 281.92 (1573.06) | 0 | 2.17 | 62.45 | ||
| Costs of formal home care (scenario 2) | 467.16 (2606.73) | 0 | 2.56 | 73.37 | ||
| Cost of day care centers | 67 (525.42) | 0 | 0.52 | 14.84 | 0.37 | 10.52 |
| Cost of telehealth | 14.41 (60.69) | 0 | 0.11 | 3.19 | 0.08 | 2.26 |
| Cost of nursing homes | 88.11 (848.56) | 0 | 0.68 | 19.52 | 0.48 | 13.84 |
| Total formal care scenario 1 | 451.43 (2140.14) | 0 | 3.47 | 100.00 | ||
| Total formal care scenario 2 | 636.68 (3061.37) | 0 | 3.49 | 100.00 | ||
| Informal care scenario 1 | 7683.11 (14 354.71) | 0 [0-11 005.28] | 59.13 | 100.00 | ||
| Informal care scenario 2 | 12 723.38 (23 771.69) | 0 [0-18 224.96] | 69.83 | 100.00 | ||
| Total cost scenario 1 | 12 994.69 (18 794.69) | 4625.43 (1323.99-18 181.68) | 100.00 | |||
| Total cost scenario 2 | 18 220.21 (27 340.45) | 5124.28 (1323.99-25 695.05) | 100.00 | |||
SD, standard deviation.
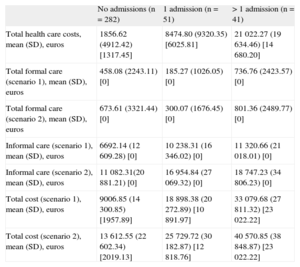
In addition to costs per patient, the funds allocated to the big-budget items were studied, differentiating among patients who were not hospitalized (n = 282), those who were hospitalized once (n = 51), and those admitted more than once (n = 41). As expected, there were large differences, especially in health care costs and total costs (Table 4).
Health Care Costs per Patient With Chronic Heart Failure According to the Number of Hospital Admissions
| No admissions (n = 282) | 1 admission (n = 51) | > 1 admission (n = 41) | |
| Total health care costs, mean (SD), euros | 1856.62 (4912.42) [1317.45] | 8474.80 (9320.35) [6025.81] | 21 022.27 (19 634.46) [14 680.20] |
| Total formal care (scenario 1), mean (SD), euros | 458.08 (2243.11) [0] | 185.27 (1026.05) [0] | 736.76 (2423.57) [0] |
| Total formal care (scenario 2), mean (SD), euros | 673.61 (3321.44) [0] | 300.07 (1676.45) [0] | 801.36 (2489.77) [0] |
| Informal care (scenario 1), mean (SD), euros | 6692.14 (12 609.28) [0] | 10 238.31 (16 346.02) [0] | 11 320.66 (21 018.01) [0] |
| Informal care (scenario 2), mean (SD), euros | 11 082.31(20 881.21) [0] | 16 954.84 (27 069.32) [0] | 18 747.23 (34 806.23) [0] |
| Total cost (scenario 1), mean (SD), euros | 9006.85 (14 300.85) [1957.89] | 18 898.38 (20 272.89) [10 891.97] | 33 079.68 (27 811.32) [23 022.22] |
| Total cost (scenario 2), mean (SD), euros | 13 612.55 (22 602.34) [2019.13] | 25 729.72 (30 182.87) [12 818.76] | 40 570.85 (38 848.87) [23 022.22] |
SD, standard deviation.
Data are expressed as mean (standard deviation) and [median].
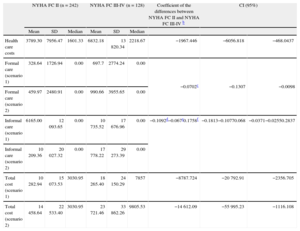
Likewise, when the estimated total cost per patient in NYHA class II at the beginning of the study was compared with the cost per patient in class III-IV, the annual expenditure for the former was lower than that for the latter (Table 5). In regression analysis, after adjustment for the control variables (age and sex), the differences were as high as € 8788 (estimate for scenario 1) and € 14 612 (estimate for scenario 2). The differences in health care costs were also significant (differences of € 1967). In the case of formal care, the probability of using social services was 7.02 percentage points lower in patients in NYHA class II at the beginning of the study than in those in class III-IV. Finally, the probability of using social services and of receiving ≥ 6h a day of informal care was 10.92 percentage points and 6.67 percentage points lower, respectively, in patients who began the study in NYHA class II than in those in class III-IV.
Health Care Costs Per Patient With Chronic Heart Failure According to Clinical Statusa
| NYHA FC II (n = 242) | NYHA FC III-IV (n = 128) | Coefficient of the differences between NYHA FC II and NYHA FC III-IV b | CI (95%) | ||||||
| Mean | SD | Median | Mean | SD | Median | ||||
| Health care costs | 3789.30 | 7956.47 | 1601.33 | 6832.18 | 13 820.34 | 2218.67 | −1967.446 | −6056.818 | −468.0437 |
| Formal care (scenario 1) | 328.64 | 1726.94 | 0.00 | 697.7 | 2774.24 | 0.00 | −0.0702c | −0.1307 | −0.0098 |
| Formal care (scenario 2) | 459.97 | 2480.91 | 0.00 | 990.66 | 3955.65 | 0.00 | |||
| Informal care (scenario 1) | 6165.00 | 12 093.65 | 0.00 | 10 735.52 | 17 676.96 | 0.00 | −0.1092d−0.067e0.1758f | −0.1813−0.10770.068 | −0.0371−0.02550.2837 |
| Informal care (scenario 2) | 10 209.36 | 20 027.32 | 0.00 | 17 778.22 | 29 273.39 | 0.00 | |||
| Total cost (scenario 1) | 10 282.94 | 15 073.53 | 3030.95 | 18 265.40 | 24 150.29 | 7857 | −8787.724 | −20 792.91 | −2356.705 |
| Total cost (scenario 2) | 14 458.64 | 22 533.40 | 3030.95 | 23 721.46 | 33 862.26 | 9805.53 | −14 612.09 | −55 995.23 | −1116.108 |
95%CI, 95% confidence interval; FC, functional class; NYHA, New York Heart Association; SD, standard deviation.
In all the models, the explanatory variable is the clinical status, and patient age and sex and treatment center are used as control variables.
The complete results of the statistical analyses presented here are available on request addressed to the authors.
The estimated mean total cost per patient ranged from € 12 995 to € 18 220, depending on the scenario chosen. The largest cost item was nonprofessional (informal) care, representing 59.1% to 69.8% of the total cost, followed by health care costs (26.7% to 37.4%) and professional care (3.5%). Among health care costs, hospitals represented the largest cost item, followed by medication. Significant differences in costs were also found between patients in NYHA class II and class III-IV.
To the best of our knowledge, this is the first study to assess the costs of CHF from a social perspective, since all previous studies have focused on health care resources. Only 1 previous study, by a Swedish group,25 analyzed the costs of this disease from a social point of view, but the study sample was too small to allow conclusions to be drawn that would be applicable to health policies. This contrasts with other diseases such as stroke, mental illness, human immunodeficiency virus infection, and degenerative diseases,26–32 in which cost studies designed from the social perspective are more common.
There are 2 important factors that should be mentioned. The first is that the annual costs per CHF patient are as high as those for other chronic diseases that have been evaluated in Spain from a social perspective, such as human immunodeficiency virus infection (between € 10 350 and € 15 750 per year), depending on the disease stage; base year, 2003),30 stroke (between € 12 900 and € 17 600 per year; base year, 2004),31 and Alzheimer disease (€ 17 112/year; base year, 2006).32
The second factor is the marked difference in social and health care costs of patients with less advanced disease (NYHA class II) compared with more severe and symptomatic forms (classes III and IV), highlighting the importance of taking action early in the course of heart disease to prevent its progression to more advanced and highly symptomatic forms.
The results of this study clearly indicate that an integrated approach to the care of CHF patients should include attention to the primary caregivers and recognition of their role.33 In addition, public and private decision makers should be aware that burden experienced by caregivers produces a series of problems involving their health, professional pursuits, leisure, and family life.
Despite their limitations, cost analyses are promoted by the governments of numerous countries. The reason is that public decision makers consider that information on the economic impact of these diseases may be useful for the planning and evaluation of their policies.34 This information does not replace—but rather complements—epidemiological and health care information. However, “such cost-of-illness calculations merely describe what is, not what we should do about it… [with] their limited resources”.35 Thus, the usefulness of a cost analysis consists of measuring the economic impact of a given disease, revealing costs that had previously been hidden or whose amount had not been previously known.
Good disease control and the use of all the medical resources that help delay its progression to advanced stages will result in improved health status, greater patient independence, and substantial savings in health care resources. Along this line, a number of Spanish health care authorities have recently demonstrated an interest in incorporating cost analyses on diseases to support their decision-making process.36 The Spanish Ministry of Health, Social Services and Equality has also included cost estimates for different diseases in recent integrated plans for the approach, prevention, and clinical management of diabetes mellitus, ischemic heart disease, tumors, and stroke.37–40 This interest indicates that, once the limitations have been taken into account, disclosure of information on the social impact of different diseases may be a useful aid in making decisions on the allocation of resources for health care strategies, that is, for the construction of evidence-based policies.
LimitationsThis report has some limitations. One is the loss of 20% of the sample due to unspecified causes. Another is the duration of the study, with a 12-month follow-up. In an ideal design, the patients would be followed up from the time of diagnosis of CHF and, thus, would provide a complete view of the course of the disease. The use of administrative databases and public-private collaboration in the funding of studies with designs of this type will, undoubtedly, strengthen these research lines.
In addition, our patients were younger than those described in epidemiological studies and, thus, the representative nature of this sample could be questioned. However, we consider that this sample is representative of the patients attending heart failure clinics within cardiology departments, especially since more than half of the consultations were related to heart transplantation programs.
One last limitation concerns the evaluation of comorbidities. A cost analysis related to comorbidity would have been interesting. However, as the study population was composed of young individuals whose disease was essentially cardiac, the use of a specific scoring system was not considered in the initial design.
CONCLUSIONSChronic heart failure is a disease that requires the mobilization of a considerable number of resources and, from a social perspective, the largest cost item in expenditure corresponds to informal care, which exceeded even health care costs. Moreover, the use of these resources has been shown to be significantly greater for patients with more advanced disease and those requiring a higher number of hospital admissions. Good disease control to delay its progression to more advanced stages would help to reduce readmissions and would favor patient autonomy, thus resulting in a more positive perception of health status and resource savings.
CONFLICTS OF INTERESTThe authors declare that this study was performed with the support of an unconditional grant from Medtronic Ibérica. Juan Oliva declares that he received fees for the study design and for analyzing the results.
The authors thank Medtronic Ibérica for its help in carrying out the study.