High-interval intensity training (HIT) has been suggested to improve peak VO2 in cardiac rehabilitation programs. However, the optimal HIT protocol is unknown. The objective of this study was to identify the most effective doses of HIT to optimize peak VO2 in coronary artery disease (CAD) and heart failure (HF) patients.
MethodsA search was conducted in 6 databases (MEDLINE, Web of Science, LILACS, CINAHL, Academic Search Complete, and SportDiscus). Studies using a HIT protocol in CAD or HF patients and measuring peak VO2 were included. The PEDro Scale and Cochrane Collaboration tools were used.
ResultsAnalyses reported significant improvements in peak VO2 after HIT in both diseases (P = .000001), with a higher increase in HF patients (P = .03). Nevertheless, in HF patients, there were no improvements when the intensity recovery was ≤ 40% of peak VO2 (P = .19) and the frequency of training was ≤ 2 d/wk (P = .07). There were significant differences regarding duration in CAD patients, with greater improvements in peak VO2 when the duration was < 12 weeks (P = .05). In HF, programs lasting < 12 weeks did not significantly improve peak VO2 (P = .1).
ConclusionsThe HIT is an effective method for improving peak VO2 in HF and CAD, with a significantly greater increase in HF patients. The recovery intervals should be active and be between 40% and 60% of peak VO2 in HF patients. Training frequency should be ≥ 2 d/wk for CAD patients and ≥ 3 d/wk for HF patients.
Keywords
Coronary artery disease (CAD) is one of the most common causes of death worldwide, affecting 17.5 million people each year.1 Ischemic disease and chronic heart failure (HF) are lethal, causing 8.76 million deaths worldwide,2 resulting in higher health care system spending.3 These CAD reduce either exercise tolerance or peak oxygen uptake (peak VO2), culminating in heart, respiratory, and endothelial dysfunction.4 In addition, HF is the final condition of all cardiovascular diseases, as it affects both cardiac function and cardiovascular circulation.5 For this reason, they are defined as an incapacity syndrome, which creates morbidity and whose symptoms are linked to fatigue, dyspnea, and exercise intolerance.4
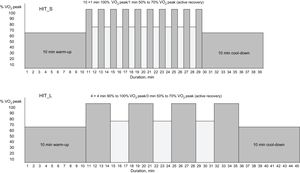
Currently, it has been widely proven that one of the benefits of aerobic exercise is an increase in peak VO2,6–9 which is one of the most important survival indicators for people with CAD5,10–13 and HF.5 Continuous aerobic training has been studied for cardiac rehabilitation programs. It consists of performing exercise for a long period of time under moderate intensity and nonvariable aerobic activity (60%-80% of peak VO25,9,11,12,14). However, at present, high-intensity interval training (HIT) protocols are generating better results in peak VO2 in less time.9,13–16 They consist of intermittent short high-intensity work periods (85%-100% of peak VO2) and relative rest periods.10,15 A typical HIT session consists of a 10-minute warm-up at 50% to 70% of peak VO2 followed by a set of four 3- to 4-minute bouts5,10–13,15–23 (HIT protocol with long work interval) or a set of ten 30- to 60-second bouts6–9,24 (HIY protocol with short work interval) at 85% to 95% of peak VO2 interspersed by active pauses at 50% to 70% of peak VO2. It terminates with a cool-down period at 50% to 70% of peak VO225 (Figure 1). However, although HIT is known to produce the greatest effects on peak VO2 in CAD and HF patients,5,13,15,16,21 there have been many differences in the exercise protocols proposed in this topic affecting the frequency (2-5 d/wk),8,11,14,24 volume (30-60min/sessions),15,24,26 intensity of recovery (0%-70% peak VO2),6,9,17,21 number of sessions (> 100 sessions),13 duration of training (4-50 weeks),8,13,16,18 and even in the characteristics of the patients.11,17,21 Recognizing the influence of these variables regarding peak VO2 could help to optimize cardiac rehabilitation programs for HF and CAD patients.

Moreover, other studies have focused on identifying which kind of HIT intervention is more effective for improving the functional capacity of HF and CAD patients, as the rehabilitation process and the disabilities produced by the 2 diseases differ.10,27 However, which HIT protocol training is better for one disease or the other, or the best dosage of this type of exercise to improve the cardiac rehabilitation program of each disease is currently not known.
Therefore, the aim of the present study was to conduct a meta-analysis to a) identify the best doses of HIT to optimize HIT training for HF and CAD patients, and b) determine how the HIT protocol affects HF and CAD patients in terms of their peak VO2.
METHODSStudy DesignThe systematic review and meta-analysis were undertaken in accordance with the PRISMA (Preferred Reporting Items for Systematic Reviews and Meta-Analyses) statement.28 The search was carried out by 2 of the authors (I. Ballesta García and J.A. Rubio Arias), and all the authors reached an agreement regarding methods, article inclusion, and statistical analysis. The articles were organized in order to delete duplicates. Full-text articles were retrieved and evaluated based on the proposed selection criteria. Variables related to the training method such as frequency, total duration of the session, exercise duration, and recovery intervals, number of total sessions, percentage of intensity of each interval, as well as the age, body mass index, sex and number of patients in each study were extracted to an excel workbook.
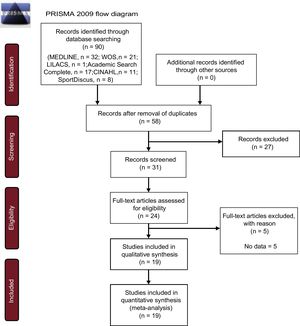
Search StrategyElectronic database searches were performed using MEDLINE, Web of Science, LILACS, CINAHL, Academic Search Complete and SportDiscus. The search terms chosen were: (“Heart disease” OR “Heart Failure” OR “Coronary Artery Disease” OR CAD) AND (“High-intensity” OR “High intensity” OR HIT OR “Interval training”). The search results and final study selection are shown in Figure 2.
Inclusion Criteria
Inclusion criteria were determined by the authors. We included randomized controlled trials, written in English or Spanish, published from January 2004 to March 2017, using a HIT protocol in patients with CAD or HF, measuring peak VO2. We excluded studies based on aquatic HIT programs, combining HIT with strength training, home-based HIT, not considering CAD and HF results of peak VO2 independently, using people with transplants, grafts or with valve disease, and testing with food supplements, nutritional or pharmacological aids.
Statistical AnalysisThe meta-analysis and statistical analysis were developed using Review Manager software (RevMan 5.2; Cochrane Collaboration, Oxford, United Kingdom)29 and Comprehensive Meta-analysis software (Version 2; Biostat, Englewood, New Jersey, United States). A random effects meta-analysis was conducted to determine which disease most benefited from HIT and if there were differences between HIT protocols for each condition. The work-rest ratio, the work interval duration and intensity, and the protocol frequency variables were taken into account to determine changes in each variable.
Due to the heterogeneity of the protocol (Table 1), mean differences were used, dividing the mean values between 2 different groups. The differences in means were grouped using the random effects model. Heterogeneity between studies was analyzed using I2 statistics. The dichotomous and continuous variables of the studies were compared with extracted potential peak VO2 moderator factors. The medians of continuous variables were used to group the studies. Afterwards, HIT differences between pre- and post-values were expressed and analyzed as potential moderator variable changes. The publication bias for the different conditions analyzed (pre-vs-post) was assessed by examining the asymmetry of a funnel plot using Egger's test, and P ≤ .05 was considered to be statistically significant. We assessed the methodological quality of the studies by using the PEDro Scale. The risk of bias was assessed using the modified Cochrane Collaboration tools. Bias was assessed as a judgment (high, low, or unclear) for individual elements from 5 domains: selection, performance, attrition, reporting and any other bias (criteria inclusion of patients in the studies and the country in which the study was conducted).
General Characteristics of the Studies Included in the Meta-analysis
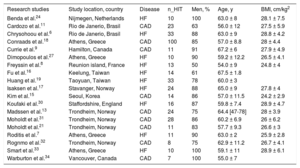
| Research studies | Study location, country | Disease | n_HIT | Men, % | Age, y | BMI, cm/kg2 |
|---|---|---|---|---|---|---|
| Benda et al.24 | Nijmegen, Netherlands | HF | 10 | 100 | 63.0 ± 8 | 28.1 ± 7.5 |
| Cardozo et al.11 | Rio de Janerio, Brasil | CAD | 23 | 63 | 56.0 ± 12 | 27.5 ± 5.9 |
| Chrysohoou et al.6 | Rio de Janerio, Brasil | HF | 33 | 88 | 63.0 ± 9 | 28.8 ± 4.2 |
| Conraads et al.18 | Athens, Greece | CAD | 100 | 85 | 57.0 ± 8.8 | 28 ± 4.4 |
| Currie et al.9 | Hamilton, Canada | CAD | 11 | 91 | 67.2 ± 6 | 27.9 ± 4.9 |
| Dimopoulos et al.27 | Athens, Greece | HF | 10 | 90 | 59.2 ± 12.2 | 26.5 ± 4.1 |
| Freyssin et al.8 | Reunion island, France | HF | 13 | 50 | 54.0 ± 9 | 24.8 ± 4 |
| Fu et al.16 | Keelung, Taiwan | HF | 14 | 61 | 67.5 ± 1.8 | |
| Huang et al.19 | Taoyuan, Taiwan | HF | 33 | 78 | 60.0 ± 3 | |
| Isaksen et al.17 | Stavanger, Norway | HF | 24 | 88 | 65.0 ± 9 | 27.8 ± 4 |
| Kim et al.15 | Seoul, Korea | CAD | 14 | 86 | 57.0 ± 11.5 | 24.2 ± 2.9 |
| Koufaki et al.30 | Staffordshire, England | HF | 16 | 87 | 59.8 ± 7.4 | 28.9 ± 4.7 |
| Madssen et al.13 | Trondheim, Norway | CAD | 24 | 75 | 64.4 [47-78] | 28 ± 3.9 |
| Moholdt et al.31 | Trondheim, Norway | CAD | 28 | 86 | 60.2 ± 6.9 | 26 ± 6.2 |
| Moholdt et al.21 | Trondheim, Norway | CAD | 11 | 83 | 57.7 ± 9.3 | 26.6 ± 3 |
| Roditis et al.7 | Athens, Greece | HF | 11 | 90 | 63.0 ± 2 | 25.9 ± 2.8 |
| Rognmo et al.32 | Trondheim, Norway | CAD | 8 | 75 | 62.9 ± 11.2 | 26.7 ± 4.1 |
| Smart et al.33 | Athens, Greece | HF | 10 | 100 | 59.1 ± 11 | 28.9 ± 6.1 |
| Warburton et al.34 | Vancouver, Canada | CAD | 7 | 100 | 55.0 ± 7 |
BMI, body mass index; CAD, coronary artery disease; HF, heart failure; n_HIT number of participants in high-intensity interval training groups.
Data are presented as the mean, mean ± standard deviation, range or No.
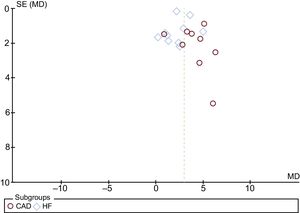
According to our inclusion criteria, 19 studies were included in this meta-analysis, 10 in HF and 9 in CAD. The Egger test provided statistical evidence of funnel plot symmetry (Figure 3), suggesting the absence of a significant publication bias.

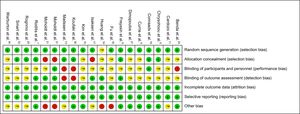
Risk-of-bias assessment is shown in Figure 4. It was high in almost all studies due to lack of blinding of participants and personnel. However, this issue could not be omitted due to the peculiarity of the intervention (exercise vs no exercise) and should be considered in perspective.

The main characteristics of the studies and of training interventions are described in Table 1 and Table 2, respectively.
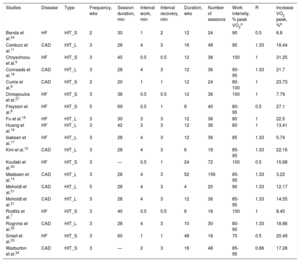
Characteristics of Aerobic Training Interventions in the Studies Included in the Meta-analysis
| Studies | Disease | Type | Frequency, wks | Session duration, min | Interval work, min | Interval recovery, min | Duration, wks | Number of sessions | Work intensity, % peak VO2a | R | Increase VO2 peak, %b |
|---|---|---|---|---|---|---|---|---|---|---|---|
| Benda et al.24 | HF | HIT_S | 2 | 30 | 1 | 2 | 12 | 24 | 90 | 0.5 | 6.8 |
| Cardozo et al.11 | CAD | HIT_L | 3 | 28 | 4 | 3 | 16 | 48 | 90 | 1.33 | 18.44 |
| Chrysohoou et al.6 | HF | HIT_S | 3 | 45 | 0.5 | 0.5 | 12 | 36 | 100 | 1 | 31.25 |
| Conraads et al.18 | CAD | HIT_L | 3 | 28 | 4 | 3 | 12 | 36 | 90-95 | 1.33 | 21.7 |
| Currie et al.9 | CAD | HIT_S | 2 | 20 | 1 | 1 | 12 | 24 | 80-100 | 1 | 23.73 |
| Dimopoulos et al.27 | HF | HIT_S | 3 | 36 | 0.5 | 0.5 | 12 | 36 | 100 | 1 | 7.79 |
| Freyssin et al.8 | HF | HIT_S | 5 | 69 | 0.5 | 1 | 8 | 40 | 80-95 | 0.5 | 27.1 |
| Fu et al.16 | HF | HIT_L | 3 | 30 | 3 | 3 | 12 | 36 | 80 | 1 | 22.5 |
| Huang et al.19 | HF | HIT_L | 3 | 42 | 3 | 3 | 12 | 36 | 80 | 1 | 13.41 |
| Isaksen et al.17 | HF | HIT_L | 3 | 28 | 4 | 3 | 12 | 36 | 85 | 1.33 | 5.74 |
| Kim et al.15 | CAD | HIT_L | 3 | 28 | 4 | 3 | 6 | 18 | 85-95 | 1.33 | 22.16 |
| Koufaki et al.30 | HF | HIT_S | 3 | — | 0.5 | 1 | 24 | 72 | 100 | 0.5 | 15.68 |
| Madssen et al.13 | CAD | HIT_L | 3 | 28 | 4 | 3 | 52 | 156 | 85-95 | 1.33 | 3.22 |
| Moholdt et al.31 | CAD | HIT_L | 5 | 28 | 4 | 3 | 4 | 20 | 90 | 1.33 | 12.17 |
| Moholdt et al.21 | CAD | HIT_L | 3 | 28 | 4 | 3 | 12 | 36 | 85-95 | 1.33 | 14.55 |
| Roditis et al.7 | HF | HIT_S | 3 | 40 | 0.5 | 0.5 | 6 | 18 | 100 | 1 | 8.45 |
| Rognmo et al.32 | CAD | HIT_L | 3 | 28 | 4 | 3 | 10 | 30 | 80-90 | 1.33 | 18.86 |
| Smart et al.33 | HF | HIT_S | 3 | 60 | 1 | 1 | 48 | 16 | 70 | 0.5 | 20.49 |
| Warburton et al.34 | CAD | HIT_S | 3 | — | 2 | 3 | 16 | 48 | 85-95 | 0.66 | 17.28 |
CAD, coronary artery disease; HF, heart failure; HIT, high-intensity interval training groups; HIT_L, protocol of HIT with long work interval; HIT_S, protocol of HIT with short work interval; peak VO2, peak oxygen uptake; R: work/recovery ratio.
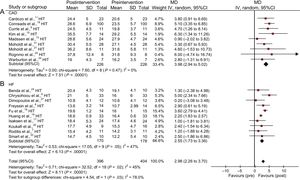
The meta-analyzed effects of HIT found in both diseases were beneficial (P < .000001) for peak VO2 (3.98; 95%CI, 2.94-5.02mL/kg/min for CAD patients and 2.55; 95%CI, 1.73-3.36mL/kg/min for HF patients) (Figure 5). However, there were significant differences in peak VO2 between the 2 diseases in favor of HF patients (P = .03) (Figure 5).
 for patients with CAD. B: MD between post- and pre-HIT intervention peak VO2 (mL/kg/min) for patients with HF. Squares represent the MD for each trial. The diamond represents the pooled MD across trials. Weight determines how much each individual study contributes to the pooled estimate.35 Total is the number of participants in HIT groups. 95%CI, confidence interval; CAD, coronary artery disease; HF, heart failure; HIT, high-intensity interval training groups; MD, mean difference; SD: standard deviation; IV: inverse variance.")
A: MD between post- and pre-HIT intervention peak VO2 (mL/kg/min) for patients with CAD. B: MD between post- and pre-HIT intervention peak VO2 (mL/kg/min) for patients with HF. Squares represent the MD for each trial. The diamond represents the pooled MD across trials. Weight determines how much each individual study contributes to the pooled estimate.35 Total is the number of participants in HIT groups. 95%CI, confidence interval; CAD, coronary artery disease; HF, heart failure; HIT, high-intensity interval training groups; MD, mean difference; SD: standard deviation; IV: inverse variance.
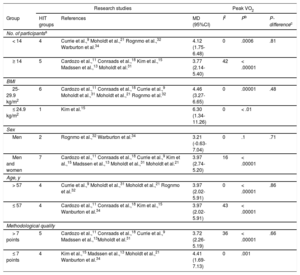
Following the moderating variables, the results showed statistical improvements in peak VO2 in each subgroup analyzed for both diseases (P < .05) (Table 3 and Table 4). There were no statistically significant differences between subgroups according to population characteristics in CAD or HF (Table 3 and Table 4).
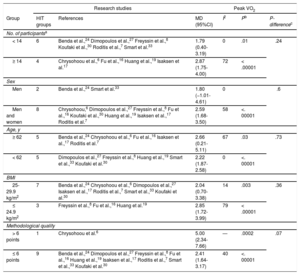
Subgroup Analyses Assessing Potential Moderating Factors for VO2 Peak Increase in Studies on CAD Disease Included in the Meta-analysis by Population Characteristics
| Research studies | Peak VO2 | |||||
|---|---|---|---|---|---|---|
| Group | HIT groups | References | MD (95%CI) | I2 | Pb | P-differencec |
| No. of participantsa | ||||||
| < 14 | 4 | Currie et al.,9 Moholdt et al.,21 Rognmo et al.,32 Warburton et al.34 | 4.12 (1.75-6.48) | 0 | .0006 | .81 |
| ≥ 14 | 5 | Cardozo et al.,11 Conraads et al.,18 Kim et al.,15 Madssen et al.,13 Moholdt et al.31 | 3.77 (2.14-5.40) | 42 | < .00001 | |
| BMI | ||||||
| 25-29.9 kg/m2 | 6 | Cardozo et al.,11 Conraads et al.,18 Currie et al.,9 Moholdt et al.,31 Moholdt et al.,21 Rognmo et al.32 | 4.46 (3.27-6.65) | 0 | .00001 | .48 |
| ≤ 24.9 kg/m2 | 1 | Kim et al.15 | 6.30 (1.34-11.26) | 0 | < .01 | |
| Sex | ||||||
| Men | 2 | Rognmo et al.,32 Warburton et al.34 | 3.21 (-0.63-7.04) | 0 | .1 | .71 |
| Men and women | 7 | Cardozo et al.,11 Conraads et al.,18 Currie et al.,9 Kim et al.,15 Madssen et al.,13 Moholdt et al.,31 Moholdt et al.21 | 3.97 (2.74-5.20) | 16 | < .00001 | |
| Age, y | ||||||
| > 57 | 4 | Currie et al.,9 Moholdt et al.,31 Moholdt et al.,21 Rognmo et al.32 | 3.97 (2.02-5.91) | 0 | < .00001 | .86 |
| ≤ 57 | 4 | Cardozo et al.,11 Conraads et al.,18 Kim et al.,15 Wanburton et al.34 | 3.97 (2.02-5.91) | 43 | < .00001 | |
| Methodological quality | ||||||
| > 7 points | 5 | Cardozo et al.,11 Conraads et al.,18 Currie et al.,9 Madssen et al.,13Moholdt et al.31 | 3.72 (2.26-5.19) | 36 | < .00001 | .66 |
| ≤ 7 points | 4 | Kim et al.,15 Madssen et al.,13 Moholdt et al.,21 Wanburton et al.34 | 4.41 (1.69-7.13) | 0 | .001 | |
95%CI, 95% confidence interval; BMI, body mass index; HIT, high-intensity interval training groups; I2, heterogeneity; MD, mean difference; peak VO2, peak oxygen uptake.
Certain studies were not included because they did not report the value used for subgroup analysis.
Subgroup Analyses Assessing Potential Moderating Factors for VO2 Peak Increase in Studies on HF Disease Included in the Meta-analysis by Population Characteristics
| Research studies | Peak VO2 | |||||
|---|---|---|---|---|---|---|
| Group | HIT groups | References | MD (95%CI) | I2 | Pb | P-differencec |
| No. of participantsa | ||||||
| < 14 | 6 | Benda et al.,24 Dimopoulos et al.,27 Freyssin et al.,8 Koufaki et al.,30 Roditis et al.,7 Smart et al.33 | 1.79 (0.40-3.19) | 0 | .01 | .24 |
| ≥ 14 | 4 | Chrysohoou et al.,6 Fu et al.,16 Huang et al.,19 Isaksen et al.17 | 2.87 (1.75-4.00) | 72 | < .00001 | |
| Sex | ||||||
| Men | 2 | Benda et al.,24 Smart et al.33 | 1.80 (−1.01-4.61) | 0 | .6 | |
| Men and women | 8 | Chrysohoou,6 Dimopoulos et al.,27 Freyssin et al.,8 Fu et al.,16 Koufaki et al.,30 Huang et al.,19 Isaksen et al.,17 Roditis et al.7 | 2.59 (1.68-3.50) | 58 | <. 00001 | |
| Age, y | ||||||
| ≥ 62 | 5 | Benda et al.,24 Chrysohoou et al.,6 Fu et al.,16 Isaksen et al.,17 Roditis et al.7 | 2.66 (0.21-5.11) | 67 | .03 | .73 |
| < 62 | 5 | Dimopoulos et al.,27 Freyssin et al.,8 Huang et al.,19 Smart et al.,33 Koufaki et al.30 | 2.22 (1.87-2.58) | 0 | <. 00001 | |
| BMI | ||||||
| 25-29.9 kg/m2 | 7 | Benda et al.,24 Chrysohoou et al.,6 Dimopoulos et al.,27 Isaksen et al.,17 Roditis et al.,7 Smart et al.,33 Koufaki et al.30 | 2.04 (0.70-3.38) | 14 | .003 | .36 |
| ≤ 24.9 kg/m2 | 3 | Freyssin et al.,8 Fu et al.,16 Huang et al.19 | 2.85 (1.72-3.99) | 79 | < .00001 | |
| Methodological quality | ||||||
| > 6 points | 1 | Chrysohoou et al.6 | 5.00 (2.34-7.66) | — | .0002 | .07 |
| ≤ 6 points | 9 | Benda et al.,24 Dimopoulos et al.,27 Freyssin et al.,8 Fu et al.,16 Huang et al.,19 Isaksen et al.,17 Roditis et al.,7 Smart et al.,33 Koufaki et al.30 | 2.41 (1.64-3.17) | 40 | <. 00001 | |
95%CI, 95% confidence interval; BMI, body mass index; HIT, high-intensity interval training groups; I2, heterogeneity; MD, mean difference; peak VO2, peak oxygen uptake.
Certain enrolled studies were not included because the value used for subgroup analysis was not reported in them.
Regarding exercise characteristics, there were statistically significant improvements in peak VO2 in each CAD patient subgroup analyzed (P < .05). Nevertheless, in HF patients, there were no improvements in peak VO2 when the intensity of recovery was ≤ 40% peak VO2 (P = .19), when the type of recovery was passive (P = .09), and in the ≤ 2 d/wk protocols (P = .07)9,24 (Table 5).
Subgroup Analyses Assessing Potential Moderating Factors for VO2 Peak Increase in Studies on HF Disease Included in the Meta-analysis by Exercise Characteristics
| Peak VO2 | ||||||
|---|---|---|---|---|---|---|
| Group | HIT groups | References | MD (95%CI) | I2 | Pa | P-differenceb |
| Number of sessions | ||||||
| ≥ 36 sessions | 8 | Chrysohoou et al.,6 Dimopoulos et al.,27 Freyssin et al.,8 Fu,16 Huang et al.,19 Isaksen et al.,17 Koufaki et al.,30 Smart et al.33 | 2.69 (1.78-3.60) | 56 | <. 00001 | .26 |
| < 36 sessions | 2 | Benda et al.,24 Roditis et al.7 | 1.24 (–1.12-3.61) | 0 | <. 00001 | |
| Duration | ||||||
| > 12 wks | 2 | Koufaki et al.,30 Smart et al.33 | 2.45 (–0.48-5.37) | 0 | .1 | .96 |
| ≤ 12 wks | 8 | Benda et al.,24 Chrysohoou et al.,6 Dimopoulos et al.,27 Freyssin,8 Fu et al.,16 Huang et al.,19 Isaksen et al.,17 Roditis et al.7 | 2.53 (1.62-3.44) | 59 | <. 00001 | |
| HIT frequency | ||||||
| ≥ 5 d/wk | 1 | Freyssin8 | 2.90 (0.61-5.19) | — | .01 | .77 |
| 3 or 4 d/wk | 8 | Chrysohoou et al.,6 Dimopoulos et al.,27 Fu et al.,16 Huang et al.,19 Isaksen et al.,17 Koufaki et al.,30 Roditis et al.,7 Smart et al.33 | 2.55 (1.59-3.50) | 58 | <. 00001 | |
| ≤ 2 d/wk | 1 | Benda et al.24 | 1.30 (–2.38-4.98) | — | .49 | |
| Session duration | ||||||
| > 42 min | 4 | Chrysohoou et al.,6 Freyssin et al.,8 Koufaki et al.,30 Smart et al.33 | 3.44 (1.95-4.94) | 0 | <. 00001 | .19 |
| ≤ 42 min | 5 | Benda et al.,24 Fu et al.,16 Huang et al.,19 Isaksen et al.,17 Roditis et al.7 | 2.23 (1.23-3.23) | 62 | <. 00001 | |
| Interval work | ||||||
| > 45 sec | 5 | Benda et al.,24 Fu et al.,16 Huang et al.,19 Isaksen et al.,17 Smart et al.33 | 2.53 (1.50-3.55) | 34 | .002 | 1.00 |
| ≤ 45 sec | 5 | Chrysohoou et al.,6 Dimopoulos et al.,27 Freyssin et al.,8 Koufaki et al.,30 Roditis et al.7 | 2.52 (0.89-4.15) | 63 | <. 00001 | |
| Interval recovery | ||||||
| > 1 min | 4 | Benda et al.,24 Fu et al.,16 Huang,19 Isaksen et al.17 | 2.46 (1.35-3.58) | 73 | <. 00001 | .84 |
| ≤ 1 min | 6 | Chrysohoou et al.,6 Dimopoulos et al.,27 Freyssin et al.,8 Koufaki et al.,30 Roditis et al.,7 Smart et al.33 | 2.65 (1.27-4.03) | 12 | .0002 | |
| HIT protocol | ||||||
| HIT_L | 4 | Fu et al.,16 Huang et al.,19 Isaksen et al.,17 Roditis et al.7 | 2.45 (1.22-3.69) | 7 | <. 00001 | .87 |
| HIT_S | 6 | Benda et al.,24 Chrysohoou et al.,6 Dimopoulos et al.,27 Freyssin et al.,8 Koufaki et al.,30 Smart et al.33 | 2.60 (1.37-3.82) | 81 | <. 00001 | |
| Type of recovery | ||||||
| Active (≥ 20%) | 7 | Benda et al.,24 Freyssin et al.,8 Fu et al.,16 Huang et al.,19 Isaksen et al.,17 Koufaki et al.,30 Roditis et al.7 | 2.51 (1.68-3.33) | 49 | <.00001 | .91 |
| Passive (< 20%) | 3 | Chrysohoou et al.,6 Dimopoulos et al.,27 Smart et al.33 | 2.70 (–0.38-5.78) | 60 | .09 | |
| Active recovery intensity | ||||||
| ≥ 40% | 5 | Freyssin et al.,8 Fu et al.,16 Huang et al.,19 Isaksen et al.,17 Roditis et al.7 | 2.60 (1.68-3.51) | 58 | <. 00001 | .59 |
| < 40% | 2 | Benda et al.,24 Koufaki et al.30 | 1.81 (–0.88-4.50) | 0 | .19 | |
| R (W/R) | ||||||
| ≥ 1 | 6 | Chrysohoou et al.,6 Dimopoulos et al.,27 Fu et al.,16 Huang et al.,19 Isaksen et al.,17 Roditis et al.7 | 2.53 (1.45-3.62) | 70 | <. 00001 | .94 |
| < 1 | 4 | Benda et al.,24 Freyssin et al.,8 Koufaki et al.,30 Smart et al.33 | 2.45 (0.83-4.07) | 0 | <. 00001 | |
HF, heart failure; HIT, high-intensity interval training groups; HIT_L, protocol of HIT with long work interval; HIT_S, protocol of HIT with short work interval; I2, heterogeneity; MD, mean difference; peak VO2, peak oxygen uptake; R (W/R), work-recovery ratio.
Certain studies were not included because they did not report the value used for subgroup analysis.
With regards to protocol duration, there were significant differences in CAD patients, who showed higher peak VO2 improvements when the program was performed for < 12 weeks (P = .05) (Table 6). By contrast, there were no significant differences in HF patients when comparing a program ≥ 12 weeks and a program ≤ 12 weeks (P = .96). However, a program lasting ≥ 12 weeks did not produce significant improvements in peak VO2 in HF patients (P = .1; I2 = 0) (Table 5).
Subgroup Analyses Assessing Potential Moderating Factors for VO2 Peak Increase in Studies on CAD Disease Included in the Meta-analysis by Exercise Characteristics
| Peak VO2 | ||||||
|---|---|---|---|---|---|---|
| Group | HIT groups | References | MD (95%CI) | I2 | Pa | P-differenceb |
| Number of sessions | ||||||
| ≥ 36 sessions | 5 | Cardozo et al.,11 Conraads et al.,18 Madssen et al.,13 Moholdt et al.,21 Warburton et al.34 | 3.57 (1.86-5.28) | 0 | <. 00001 | .6 |
| < 36 sessions | 4 | Currie et al.,9 Kim et al.,15 Moholdt et al.,31 Rognmo et al.32 | 4.25 (2.35-6.14) | 35 | <. 00001 | |
| Duration | ||||||
| > 12 ws | 3 | Cardozo et al.,11 Madssen et al.,13 Warburton et al.34 | 2.45 (0.62-4.29) | 0 | .009 | .05 |
| ≤ 12 ws | 6 | Conraads et al.,18 Currie et al.,9 Kim, et al.,15 Moholdt et al.,31 Moholdt et al.,21 Rognmo et al.32 | 4.70 (3.44-5.96) | 0 | <. 00001 | |
| HIT frequency | ||||||
| ≥ 5 d/wk | 1 | Moholdt et al.31 | 3.30 (0.67-5.93) | – | .01 | .82 |
| 3 or 4 d/wk | 7 | Cardozo et al.,11 Conraads et al.,18 Rognmo et al.,32 Warburton et al.,34 Kim et al.,15 Madssen et al.,13 Moholdt et al.21 | 3.91 (2.48-5.33) | 16 | <. 00001 | |
| ≤ 2 d/wk | 1 | Currie et al.9 | 4.70 (1.26-8.14) | — | .007 | |
| Session duration | ||||||
| ≥ 28 min | 7 | Cardozo et al.,11 Conraads et al.,18 Kim et al.,15 Madssen et al.,13 Moholdt et al.,31 Moholdt et al.,21 Rognmo et al.32 | 3.87 (2.71-5.02) | 6 | <. 00001 | .65 |
| < 28 min | 1 | Currie et al.9 | 4.70 (1.26-8.14) | — | .007 | |
| Interval work | ||||||
| ≥ 4 min | 7 | Cardozo et al.,11 Conraads et al.,18 Kim et al.,15 Madssen et al.,13 Moholdt et al.,31 Moholdt et al.,21 Rognmo et al.32 | 3.90 (2.59-5.22) | 16 | <.00001 | .99 |
| < 4 min | 2 | Currie et al.,9 Warburton et al.34 | 3.92 (1.28-6.55) | 0 | .004 | |
| Interval recovery | ||||||
| ≥ 3 min | 8 | Cardozo et al.,11 Conraads et al.,18 Kim et al.,15 Madssen et al.,13 Moholdt et al.,31 Moholdt et al.,21 Rognmo et al.,32 Warburton et al.34 | 3.87 (2.71-5.02) | 6 | <. 00001 | .65 |
| < 3 min | 1 | Currie et al.9 | 4.70 (1.26-8.14) | — | .007 | |
| HIT Protocol | ||||||
| HIT-L | 7 | Cardozo et al.,11 Conraads et al.,18 Kim et al.,15 Madssen et al.,13 Moholdt et al.,31 Moholdt et al.,21 Rognmo et al.32 | 3.90 (2.59-5.22) | 16 | <. 00001 | .99 |
| HIT-S | 2 | Currie et al.,9 Warburton et al.34 | 3.92 (1.28-6.55) | 0 | .004 | |
| Type of recovery | ||||||
| Active (≥20%) | 8 | Cardozo et al.,11 Conraads et al.,18 Rognmo et al.,32 Warburton et al.,34 Kim et al.,15 Moholdt et al.,31 Madssen et al.,13 Moholdt et al.21 | 3.87 (2.71-5.02) | 6 | <. 00001 | .65 |
| Passive (<20%) | 1 | Currie et al.9 | 4.70 (1.26-8.14) | — | .007 | |
| Active recovery intensity | ||||||
| ≥ 65% | 4 | Cardozo et al.,11 Conraads et al.,18 Moholdt et al.,31 Moholdt et al.21 | 4.44 (3.24-5.63) | <. 00001 | .27 | |
| < 65% | 4 | Kim et al.,15 Madssen et al.,13 Rognmo et al.,32 Warburton et al.34 | 2.86 (0.32-5.41) | |||
| R (W/R) | ||||||
| ≥ 1.33 | 7 | Cardozo et al.,11 Conraads et al.,18 Kim et al.,15 Madssen et al.,13 Moholdt et al.,31 Moholdt et al.,21 Rognmo et al.32 | 3.87 (2.71-5.02) | 6 | <. 00001 | .65 |
| < 1.33 | 2 | Currie et al.,9 Warburton et al.34 | 4.70 (1.26-8.14) | — | .007 | |
CAD, coronary artery disease; HIT, high-intensity interval training groups; HIT_L, protocol of HIT with long work interval; HIT_S, protocol of HIT with short work interval; I2, heterogeneity; MD, mean difference; peak VO2: peak oxygen uptake; R (W/R), work-recovery ratio.
Certain studies were not included because they did not report the value used for subgroup analysis.
Likewise, there were no significant differences between HIT protocols with short exercise intervals and protocols with long exercise intervals in either of the 2 diseases (P = .87), although both of them showed significant improvements in peak VO2 (P = < .000001). In contrast, there were significant differences in peak VO2 between the 2 diseases in favor of HF patients (P = .03) (Figure 5).
DISCUSSIONThis meta-analysis determined how different HIT protocols modify the peak VO2 of HF and CAD patients, describing the most effective doses of HIT to optimize their training. The main finding was that HIT was more effective for improving the peak VO2 of patients with HF than that of those with CAD. However, the maximum benefits in peak VO2 were obtained between weeks 6 and 12 for both diseases. In addition, HF patients did not obtain significant peak VO2 improvements when the HIT protocol was > 12 weeks. This result may be due to the fact that only 2 studies30,33 followed a protocol > 12 weeks while 8 studies6–8,16,17,19,24,27 followed protocols of ≤ 12 weeks. In fact, no significant differences were found between the 2 subgroups (P = .96). Likewise, CAD patients achieved greater improvements in peak VO2 when the duration of the protocol was < 12 weeks, with the differences being significant between the 2 subgroups (P = .05).
Regarding age, there were no statistically significant differences between subgroups (≥ 57 years and < 57 years, CAD patients [56-65 years old], and ≥ 62 years and < 62 years [54-68 years], HF patients). This result indicated that age does not influence improvements in peak VO2, although some research asserts that age is a determining factor for the occurrence of HF and CAD due to diseases associated with age.35,36 According to Amundsen et al.,12 these results suggest that HIT induces changes in cardiac contractility and increases filling of the left ventricle. Thus, we found peak VO2 improvements derived from improvements in left ventricular ejection fraction, regardless of age.
In relation to the HIT protocol, the studies suggested conducting a work ratio (work/recovery) ≤ 1.33 (0.66-1.33) for patients with CAD, as it provides the same benefits as ratios > 1.33. Moreover, it would be better to use work ratios < 1 (0.5-1.33) for patients with HF. These results support some researchers’ arguments that patients prefer shorter or less-intense protocols,10 favoring adherence to the long-term protocol due to greater patient comfort.10,37
Concerning work and recovery periods, there were no statistically significant differences regarding work interval duration (from 30seconds to 4minutes) in HF patients. Nevertheless, there were statistically significant differences in recovery intensity, as recoveries ≤ 40% peak VO2 and passive recovery did not produce adaptations in peak VO2. The reason may be that an active recovery at greater intensity allows for the optimization of phosphocreatine resynthesis, greater lactate oxidation, and optimization of lactate neoglucogenesis.38 However, although some authors have recommended passive recoveries,10 these were not as effective as active recoveries.26 For patients with CAD, there were no statistically significant differences in the work and recovery interval duration, the type of recovery, or active recovery intensity. Thus, patients with CAD had faster recoveries than HF patients. This finding could be due to CAD patients being less affected at the cardiovascular level than patients with HF, therefore having a faster recovery within the parameters mentioned.39 Consequently, to improve the cardiac rehabilitation process, the design of the HIT protocol for HF patients should include active recoveries ≥ 40% peak VO2.
Regarding HIT frequency, there were no statistically significant improvements in the peak VO2 of patients with HF when with protocols ≤ 2 d/wk (P = .07),24 although an improvement was found in the 3 and 4 d/wk protocols (P < .00001),6,7,16,17,19,27,30,33 and ≥ 5 d/wk protocols (P < .01).8 Nevertheless, these results were not found in patients with CAD, whose peak VO2 improved regardless of frequency (2-5 d/wk). Therefore, to obtain HIT-related peak VO2 improvements, training frequency should be at least 3 sessions/wk for patients with HF and at least 2 sessions/wk for patients with CAD. The differences between diseases may be related to the cardiac muscle injury of HF patients, requiring a greater training frequency to obtain similar improvements compared with patients with CAD who did not have problems with the cardiac muscle.37
Our systematic review and meta-analysis results indicate that peak VO2 significantly increased (P < .00001) after HIT in patients with CAD regardless of the duration of the program. Nevertheless, there were significant differences between the protocol durations of > 12 and ≤ 12 weeks (P = .05). However, for patients with HF, even though the programs > 12 weeks did not produce significant improvements in peak VO2 (P = .1), there were improvements with protocols ≤ 12 weeks (P = .00001), although there were no significant differences between them (P = .96). This finding suggests that, in both diseases, the exponential improvements in peak VO2 were produced in the first 12 weeks, when the HIT protocol was more effective. These results were probably due to the nonincremental workload included in the design of their training session, which failed to adhere to the principle of progression.40 This is explained by the fact that when a series of effective stimuli is applied, the organism generates adaptations, such as an increase in the muscle cross-sectional area, adaptations of energy reserves, or increased synchronization of motor units. The unchanging variability of these stimuli were therefore no longer sufficient to generate heterostasis. Thus, a coherent and progressive increase of workloads is required.41
Likewise, there were no statistical differences between patients with CAD or HF in the number of sessions (≥ 36 sessions6,8,11,13,16–19,21,27,30,33,34 and < 36 sessions7,9,15,24,31,32 [18-156 sessions for CAD patients and 18-72 sessions for HF patients]) and session duration (≥ 28minutes11,13,15,18,21,31,32 and < 28minutes9 for patients with CAD [20-28minutes] and > 42minutes6,8,30,33 and ≤ 42minutes7,16,17,19,24 for patients with HF [28-69minutes]). These results implied that HIT interventions should not necessarily be composed of a high number of sessions or long session durations to achieve an improvement in peak VO2 of patients with CAD or HF. The minimum frequency of training needed to produce significant adaptations in peak VO2 was 6 weeks for both CAD18 and HF6,16,19 patients. These results, together with those obtained in this meta-analysis, suggest that the maximum benefits in peak VO2 would be obtained between weeks 6 and 12. There is therefore a need to accomplish an adequate training period to perceive the effects produced in peak VO2 by long-term training protocols. For this reason, it is important to optimize training through adherence to the general principles of training.
In relation to the HIT protocol, this meta-analysis confirms the results that both HIT protocols with short work intervals and protocol of HIT with long work intervals produce significant improvements in peak VO2 in patients with CAD9,14,18 and in patients with HF.6,8,16,19 Likewise, no significant differences were found between performing an HIT protocol with short work interval or long work interval in either disease. These results may be due to the improvements in peak VO2 of cardiovascular diseases being more closely related to the intensity rather than to the duration of the HIT protocol.5 This is because intensity is the parameter that produces greater adaptations in the cardiovascular system such as an increase in muscle cross-sectional area, adaptations of energy reserves, or increased synchronization of motor units.33,34 Therefore, the type of protocol is not as important in the peak VO2 improvement as the training intensity and frequency, for CAD and HF patients.
According to our meta-analysis, HIT improved peak VO2 in patients with CAD or HF, although there were statistically significant differences between these diseases with a greater improvement in patients with HF (P = .03). These results may be due to the initial differences in peak VO2 (16.2-31.8mL/kg/min-1 in CAD patients and 10.7-19.1mL/kg/min-1 in HF patients), derived from the fact that HF patients have impaired cardiac function and the cardiac muscle was not able to pump enough blood to supply the tissues.32 However, CAD patients saw a lesser impact on their peak VO2, as they probably had better myocardial contractility, particularly if they had undergone coronary intervention.42
As has been previously suggested, this should allow the possibility of a higher increase in cardiac output because of a higher systolic volume, resulting in a greater increase in left ventricular ejection fraction in HF patients due to their having a lower threshold of adaptation to the stimulus.7 Similarly, this improvement could be caused by a larger relative increase in exercise-induced vasodilation, hemoglobin, the skeletal muscle oxidative capacity,5,8,18 or by the sum of all these factors.
Although it was not an objective of this study, there are studies that compare the effects on peak VO2 between HIT and continuous training. Although most studies have suggested that HIT is superior to continuous exercise,15,16,21,23,43 some studies have reported that HIT was not superior to continuous exercise programs in relation to peak VO2 in the 2 diseases.5,7,9,17–20,44,45
The present study makes an important contribution to the understanding of the effectiveness of HIT training programs in heart diseases. Thus, this study provides evidence for the potential applicability of HIT training programs as part of the treatments used for CAD and HF.
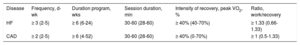
Practical ApplicationThe results of this study indicate that HIT positively affects peak VO2 in people with HF or CAD, providing greater advantages in HF patients. These findings could be used by physicians, physical conditioning trainers and heart rehabilitation teams to develop specific training programs in order to optimize the functioning of the patient's heart. However, other variables have to be taken into account, such as age, training frequency, the duration of program, and the type of recovery. The HIT program should therefore be adapted to the individual characteristics of each patient. The recommended dosage for each disease is shown in Table 7.
Recommendations on HIT Protocol for HF and CAD Patients
| Disease | Frequency, d-wk | Duration program, wks | Session duration, min | Intensity of recovery, peak VO2, % | Ratio, work/recovery |
|---|---|---|---|---|---|
| HF | ≥ 3 (2-5) | ≥ 6 (6-24) | 30-60 (28-60) | ≥ 40% (40-70%) | ≥ 1.33 (0.66-1.33) |
| CAD | ≥ 2 (2-5) | ≥ 6 (4-52) | 30-60 (28-60) | ≥ 40% (0-70%) | ≥ 1 (0.5-1.33) |
CAD, coronary artery disease; HF, heart failure; HIT, high-intensity interval training groups; peak VO2: peak oxygen uptake.
The main limitations of this study are as follow: a) the randomized controlled trials did not use the same methods to control the intensity of the training sessions; b) the protocols and the age of the participants were widely heterogeneous; c) most of the included studies had a sample with few patients; and d) in HIT protocols, one aspect is the design and another the intensity that patients are capable of achieving. Therefore, the possibility that a patient has not been able to accomplish the planned intensities should be considered.
CONCLUSIONSThe results of this study show that HIT is an effective method for the treatment of HF and CAD by improving peak VO2, with the increase being significantly higher in HF patients. To optimize these benefits, recovery intervals should be active at intensities between 40% to 60% of peak VO2 for HF patients, and the frequency should be ≥ 2 d/wk for CAD patients and ≥ 3 d/wk for HF patients. This study opens a new line of research that could be used to optimize high-quality exercise training protocols in an effort to develop the most effective and efficient method for the treatment of heart disease and other diseases.
CONFLICTS OF INTERESTNone declared.
- –
The HIT produces positive cardiovascular adaptations in HF and CAD patients.
- –
The HIT improves peak VO2 in HF and CAD patients.
- –
The HIT is more effective in improving peak VO2 in HF patients than in CAD patients.
- –
To obtain improvements in peak VO2 through HIT, ≥ 3 sessions per week for at least 6 weeks are needed for HF patients, and ≥ 2 sessions per week for at least 6 weeks for CAD patients.
- –
Active recovery at intensities between 40% to 60% of peak VO2 should be used to improve peak VO2 in HF patients.
.
We thank all authors of the original works cited in the present study, who readily assisted us by either sharing their manuscripts or providing additional data required for this meta-analysis.