Intrapatient blood level variability (IPV) of calcineurin inhibitors has been associated with poor outcomes in solid-organ transplant, but data for heart transplant are scarce. Our purpose was to ascertain the clinical impact of IPV in a multi-institutional cohort of heart transplant recipients.
MethodsWe retrospectively studied patients aged ≥18 years, with a first heart transplant performed between 2000 and 2014 and surviving≥ 1 year. IPV was assessed by the coefficient of variation of trough levels from posttransplant months 4 to 12. A composite of rejection or mortality/graft loss or rejection and all-cause mortality/graft loss between years 1 to 5 posttransplant were analyzed by Cox regression analysis.
ResultsThe study group consisted of 1581 recipients (median age, 56 years; women, 21%). Cyclosporine immediate-release tacrolimus and prolonged-release tacrolimus were used in 790, 527 and 264 patients, respectively. On multivariable analysis, coefficient of variation> 27.8% showed a nonsignificant trend to association with 5-year rejection-free survival (HR, 1.298; 95%CI, 0.993-1.695; P=.056) and with 5-year mortality (HR, 1.387; 95%CI, 0.979-1.963; P=.065). Association with rejection became significant on analysis of only those patients without rejection episodes during the first year posttransplant (HR, 1.609; 95%CI, 1.129-2.295; P=.011). The tacrolimus-based formulation had less IPV than cyclosporine and better results with less influence of IPV.
ConclusionsIPV of calcineurin inhibitors is only marginally associated with mid-term outcomes after heart transplant, particularly with the tacrolimus-based immunosuppression, although it could play a role in the most stable recipients.
Keywords
Since the introduction of cyclosporin in the early 1980s, calcineurin inhibitors (CNIs) have constituted the mainstay of immunosuppression in heart transplant (HT). Both cyclosporin and tacrolimus share a narrow therapeutical index, which mandates close monitoring of blood levels to ensure efficacy while avoiding toxicity. Intrapatient variability in CNI blood levels (IPV) is related to multiple factors,1 with nonadherence to medication being the foremost and also preventable.2 IPV has been extensively documented in renal,3–14 liver15–19 and lung20 transplant. Overall, several parameters indicating such variability have been shown to be related to poor allograft outcomes. Some studies have even reported an association with patient survival.6,8 More recently, the consequences of IPV have been assessed in some small, single-center studies in HT.21,22 Those studies have found a significant relationship between IPV and allograft rejection, although evidence of an independent impact on patient survival is lacking.21
The present multi-institutional, retrospective study aimed to assess the clinical impact (allograft rejection, patient survival) of intrapatient variability in calcineurin inhibitor (CNI) blood levels in a large series of HT patients.
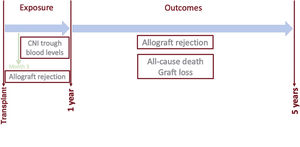
METHODSData sourceThe Spanish Heart Transplant Registry is a prospective database promoted by the Spanish Society of Cardiology that contains detailed clinical information about all HT procedures performed in Spain since 1984 to the present. The registry is updated yearly with data supplied by all transplant centers in the country. This database has been described elsewhere.23 For the purpose of this study, data regarding baseline recipient characteristics, donor, surgical procedure and survival were obtained from the Spanish Heart Transplant Registry database. Vital status as of December 31, 2017 was known for all participants. Additionally, a specific review of clinical records was carried out to obtain detailed information about the CNI blood level measurements within the first posttransplant year, concomitant immunosuppression, and incidence and featuring of the rejection episodes between 2 to 5 years after transplant (figure 1).
Study population trough blood levels were drawn 4 to 12 months posttransplant. The outcomes were a composite of rejection or all-cause death/graft loss (primary) and all-cause mortality/graft loss (secondary) between 1 and 5 years posttransplant.")
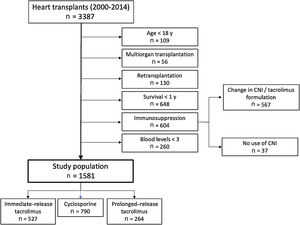
This was a retrospective analysis involving recipients from 13 participating centers who fulfilled the inclusion criteria: a) recipient of a first single-organ HT between 2000 and 2014; b) age at transplant≥18 years; c) recipient survival for at least 1 year after transplant; and d) immunosuppressive therapy based on tacrolimus (immediate-release [IRT, twice daily] and prolonged-release [PRT, once daily] tacrolimus) or cyclosporine microemulsion, maintained throughout the first year posttransplant with at least 3 samples available for calculating IPV. The reasons for exclusion are summarized in figure 2.
Exposure assessment
Recipients were treated with IRT (Prograf, Astellas Pharma Ltd, United Kingdom), PRT (Advagraf, Astellas Pharma Europe BV, Netherlands) or cyclosporin (Sandimmun Neoral, Novatis Farmacéutica SA, España). Whole-blood concentration was measured by 5 different immunoassays ().
All the trough blood level measurements carried out from months 4 to 12 post-HT were used to calculate the mean and standard deviation. IPV was analyzed by the coefficient of variation (CV), which was calculated as (standard deviation/mean) x 100. Mean blood levels were categorized according to median values.
Outcome assessmentAs there was no common rejection surveillance protocol beyond the first year post-HT across the participating centers, rejection was defined as any clinical event leading to temporary augmentation of immunosuppression consisting at least of a short course of intravenous high-dose steroids.24
Assessment of other variablesRenal function was assessed by estimation of glomerular filtration rate (GFR) according to the Chronic Kidney Disease Epidemiology Collaboration (CKD-EPI) equation.25 Left ventricular ejection fraction (LVEF) was estimated by echocardiography.
The study was conducted according to the guidelines of the Declaration of Helsinki and was approved by the Ethics Committees of all participating centers.
Statistical analysisData are presented as median and interquartile range or frequency and percentage, as appropriate. Between-group differences were analyzed by the Fisher exact test or chi-square test for categorical variables, and the Mann-Whitney U test and Kruskal-Wallis test for continuous variables.
The primary outcome was a composite of 5-year rejection or all-cause mortality/graft loss, analyzed as the time to first event. The secondary outcome was 5-year all-cause mortality/graft loss. The population was subgrouped according to the median CV for analysis. Hazard ratios (HR) with 95% confidence intervals (95%CI) were calculated by Cox regression, which was also used to fit multivariable models. Proportional hazards assumption was graphically assessed (log minus log plot). Multivariable analysis included all the variables with a P value ≤.10 in the univariable analysis, aside from CNI type. Mean blood levels were also included to consider the possibility of protopathic bias, and transplant era because of the recognized era-dependent improvement in the results in our registry.23 Quantitative variables were categorized according to their median values in all analyses. For sensitivity analyses, we first assessed the changes in the strength of the association between IPV and outcomes after excluding CNI from the original multivariable model. To further evaluate the influence of CNI type on results, we compared the survival curves generated by the interaction between CNI type (cyclosporin vs tacrolimus) and CV group (low vs high). Second, the same single and multivariable analyses performed in the entire study population were repeated for patients without a history of first-year rejection.
Missing data () were handled by multiple imputations using the fully conditional specification method, generating 10 imputed datasets using all applicable adjustment variables and the outcome variable as predictors. The average of the 10 imputed data sets was used for analysis. For imputation, categorical and continuous variables were modelled using logistic regression and linear regression, respectively.
Two-sided P <.05 was considered statistically significant. The statistical analysis was performed using the SPSS 25.0 package (SPSS Inc, Chicago, United States).
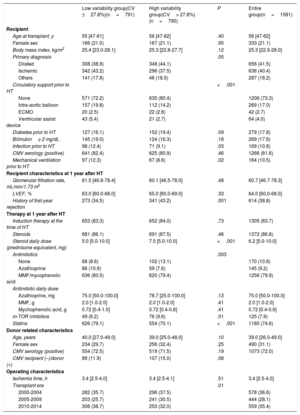
RESULTSThe main baseline characteristics are outlined in table 1. The study group comprised 1581 patients (median age, 56 years; women, 21.1%). Most patients (69.5%) were on triple therapy at 1 year after HT with concomitant steroids and mycophenolate (). A total of 614 patients (38.8%) had experienced at least 1 treated acute rejection episode throughout the first year posttransplant (335 patients, 1 episode; 135 patients, 2 episodes, 144 patients, 3 or more episodes). Histological findings consistent with acute cellular rejection were observed in 94.7% of these episodes. The median follow-up duration was 4.0 years, with no significant differences between the high CV group and the low CV group (P=.06). The CNI used were cyclosporin (50%), IRT (33.3%) and PRT (16.7%) (figure 2). As of December 31, 2017, a complete 5-year follow-up had been achieved in 94.7%, 82.2% and 47.4% of cyclosporin, IRT and PRT recipients, respectively. Population characteristics according to the type of immunoassay are depicted in .
Population characteristics according to within-patient variability of calcineurin inhibitor blood levels in heart transplant
| Low variability group(CV ≤27.8%)(n=791) | High variability group(CV> 27.8%)(n=790) | P | Entire group(n=1581) | |
|---|---|---|---|---|
| Recipient | ||||
| Age at transplant, y | 55 [47-61] | 56 [47-62] | .40 | 56 [47-62] |
| Female sex | 166 (21.0) | 167 (21.1) | .95 | 333 (21.1) |
| Body mass index, kg/m2 | 25.4 [23.0-28.1] | 25.3 [22.8-27.7] | .12 | 25.3 [22.9-28.0] |
| Primary diagnosis | .05 | |||
| Dilated | 308 (38.9) | 348 (44.1) | 656 (41.5) | |
| Ischemic | 342 (43.2) | 296 (37.5) | 638 (40.4) | |
| Others | 141 (17.8) | 46 (18.5) | 287 (18.2) | |
| Circulatory support prior to HT | <.001 | |||
| None | 571 (72.2) | 635 (80.4) | 1206 (73.3) | |
| Intra-aortic balloon | 157 (19.8) | 112 (14.2) | 269 (17.0) | |
| ECMO | 20 (2.5) | 22 (2.8) | 42 (2.7) | |
| Ventricular assist device | 43 (5.4) | 21 (2.7) | 64 (4.0) | |
| Diabetes prior to HT | 127 (16.1) | 152 (19.4) | .09 | 279 (17.8) |
| Bilirrubin≥ 2 mg/dL | 145 (19.0) | 124 (16.3) | .18 | 269 (17.6) |
| Infection prior to HT | 98 (12.4) | 71 (9.1) | .03 | 169 (10.8) |
| CMV serology (positive) | 641 (82.4) | 625 (80.9) | .46 | 1266 (81.6) |
| Mechanical ventilation prior to HT | 97 (12.3) | 67 (8.6) | .02 | 164 (10.5) |
| Recipient characteristics at 1 year after HT | ||||
| Glomerular filtration rate, mL/min/1.73 m2 | 61.5 [46.8-78.4] | 60.1 [46.5-78.0] | .48 | 60.7 [46.7-78.3] |
| LVEF, % | 63.0 [60.0-68.0] | 65.0 [60.0-69.0] | .33 | 64.0 [60.0-68.0] |
| History of first-year rejection | 273 (34.5) | 341 (43.2) | .001 | 614 (38.8) |
| Therapy at 1 year after HT | ||||
| Induction therapy at the time of HT | 653 (83.3) | 652 (84.0) | .73 | 1305 (83.7) |
| Steroids | 681 (86.1) | 691 (87.5) | .46 | 1372 (86.8) |
| Steroid daily dose (prednisone equivalent, mg) | 5.0 [5.0-10.0] | 7.5 [5.0-10.0] | <.001 | 6.2 [5.0-10.0] |
| Antimitotics | .003 | |||
| None | 68 (8.6) | 102 (13.1) | 170 (10.8) | |
| Azathioprine | 86 (10.9) | 59 (7.6) | 145 (9.2) | |
| MMF/mycophenolic acid | 636 (80.5) | 620 (79.4) | 1256 (79.9) | |
| Antimitotic daily dose | ||||
| Azathioprine, mg | 75.0 [50.0-100.0] | 78.7 [25.0-100.0] | .13 | 75.0 [50.0-100.0] |
| MMF, g | 2.0 [1.0-2.0] | 2.0 [1.0-2.0] | .41 | 2.0 [1.0-2.0] |
| Mychophenolic acid, g | 0.72 [0.4-1.0] | 0.72 [0.4-0.8] | .41 | 0.72 [0.4-0.9] |
| m-TOR inhibitors | 49 (6.2) | 76 (9.6) | .01 | 125 (7.9) |
| Statins | 626 (79.1) | 554 (70.1) | <.001 | 1180 (74.6) |
| Donor related characteristics | ||||
| Age, years | 40.0 [27.0-49.0] | 39.0 [25.0-48.0] | .10 | 39.0 [26.0-49.0] |
| Female sex | 234 (29.7) | 256 (32.4) | .25 | 490 (31.1) |
| CMV serology (positive) | 554 (72.5) | 519 (71.5) | .19 | 1073 (72.0) |
| CMV recipient (–)/donor (+) | 89 (11.9) | 107 (15.0) | .08 | |
| Operating characteristics | ||||
| Ischemia time, h | 3.4 [2.5-4.0] | 3.4 [2.5-4.1] | .51 | 3.4 [2.5-4.0] |
| Transplant era | .01 | |||
| 2000-2004 | 282 (35.7) | 296 (37.5) | 578 (36.6) | |
| 2005-2009 | 203 (25.7) | 241 (30.5) | 444 (28.1) | |
| 2010-2014 | 306 (38.7) | 253 (32.0) | 559 (35.4) | |
CMV, cytomegalovirus; CV, coefficient of variation; ECMO, extracorporeal membrane oxygenation; HT, heart transplant; LVEF, left ventricular ejection fraction; MMF, mycophenolate mofetil.
Quantitative variables are presented as median [interquartile range] and categorical variables as No. (%).
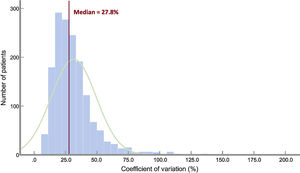
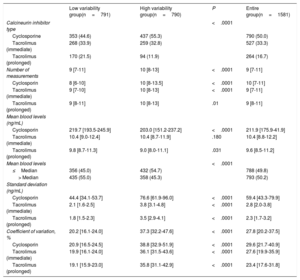
Data regarding IPV are summarized in table 2. The distribution of CV is depicted in figure 3. The median CV was 27.8% [IQR, 20.2-37.5%]. There were highly significant between-group differences for CNI type (P<.001 for all pairwise comparisons), with PRT showing the lowest variability. A significantly higher proportion of patients with mean blood levels below the median value was observed in the high variability group. CV was higher in patients with at least 1 rejection episode over the first posttransplant year (30.0%; IQR, 21.2-41.2%) than in patients with no rejection (26.8%; IQR, 19.8-35.8%; P<.0001). Significant differences were also seen for the number of blood level measurements. We found no association between CV and recipient age and sex (table 1).
Calcineurin inhibitor within-patient variability parameters
| Low variability group(n=791) | High variability group(n=790) | P | Entire group(n=1581) | |
|---|---|---|---|---|
| Calcineurin inhibitor type | <.0001 | |||
| Cyclosporine | 353 (44.6) | 437 (55.3) | 790 (50.0) | |
| Tacrolimus (immediate) | 268 (33.9) | 259 (32.8) | 527 (33.3) | |
| Tacrolimus (prolonged) | 170 (21.5) | 94 (11.9) | 264 (16.7) | |
| Number of measurements | 9 [7-11] | 10 [8-13] | <.0001 | 9 [7-11] |
| Cyclosporin | 8 [6-10] | 10 [8-13.5] | <.0001 | 10 [7-11] |
| Tacrolimus (immediate) | 9 [7-10] | 10 [8-13] | <.0001 | 9 [7-11] |
| Tacrolimus (prolonged) | 9 [8-11] | 10 [8-13] | .01 | 9 [8-11] |
| Mean blood levels (ng/mL) | ||||
| Cyclosporin | 219.7 [193.5-245.9] | 203.0 [151.2-237.2] | <.0001 | 211.9 [175.9-41.9] |
| Tacrolimus (immediate) | 10.4 [9.0-12.4] | 10.4 [8.7-11.9] | .180 | 10.4 [8.8-12.2] |
| Tacrolimus (prolonged) | 9.8 [8.7-11.3] | 9.0 [8.0-11.1] | .031 | 9.6 [8.5-11.2] |
| Mean blood levels | <.0001 | |||
| ≤Median | 356 (45.0) | 432 (54.7) | 788 (49.8) | |
| > Median | 435 (55.0) | 358 (45.3) | 793 (50.2) | |
| Standard deviation (ng/mL) | ||||
| Cyclosporin | 44.4 [34.1-53.7] | 76.6 [61.9-96.0] | <.0001 | 59.4 [43.3-79.9] |
| Tacrolimus (immediate) | 2.1 [1.6-2.5] | 3.8 [3.1-4.8] | <.0001 | 2.8 [2.0-3.8] |
| Tacrolimus (prolonged) | 1.8 [1.5-2.3] | 3.5 [2.9-4.1] | <.0001 | 2.3 [1.7-3.2] |
| Coefficient of variation, % | 20.2 [16.1-24.0] | 37.3 [32.2-47.6] | <.0001 | 27.8 [20.2-37.5] |
| Cyclosporin | 20.9 [16.5-24.5] | 38.8 [32.9-51.9] | <.0001 | 29.6 [21.7-40.9] |
| Tacrolimus (immediate) | 19.9 [16.1-24.0] | 36.1 [31.5-43.6] | <.0001 | 27.6 [19.9-35.9] |
| Tacrolimus (prolonged) | 19.1 [15.9-23.0] | 35.8 [31.1-42.9] | <.0001 | 23.4 [17.6-31.8] |
Quantitative variables are expressed as median [interquartile range] and categorical variables as No. (%).

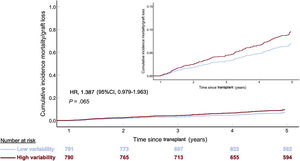
From years 1 to 5 after transplant, there were 142 (9.0%) deaths/graft loss (138 deaths and 4 retransplants). Death/graft loss was significantly more frequent in the high CV group (84 patients, 10.6%) than in the low CV group (58 patients, 7.3%, P=.02). Over the follow-up period, there were 143 episodes of rejection in 120 patients (112 patients, 1 episode; 8 patients, 2 or more episodes). Histological findings consistent with acute cellular rejection were observed in 132 (92.3%) of these episodes. The primary outcome occurred in 92 patients (11.6%) with CV ≤27.8% and in 131 patients (16.6%) with CV≤ 27.8% (P=.005)
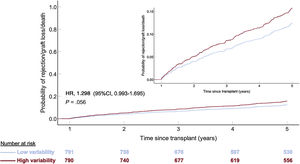
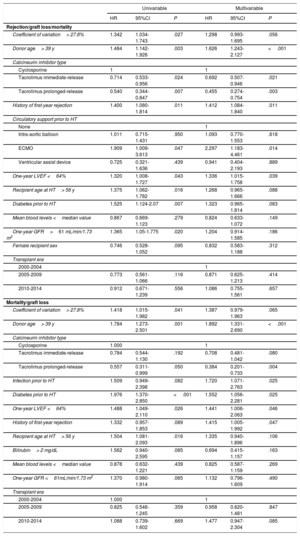
Univariable associations with the primary outcome are outlined in . A CV> 27.8% was significantly associated with higher 5-year rejection/mortality (HR, 1.342; 95%CI, 1.034-1.743; P=.027). The association was not statistically significant after multivariable adjustment (HR, 1.298; 95%CI, 0.993-1.695; P=.056) (table 3 and figure 4). Independent predictors of 5-year rejection or mortality/graft loss were donor age> 39 years, CNI type (both PRT and IRT compared with cyclosporin), type of pretransplant circulatory support, 1-year LVEF and history of first-year rejection (table 3). As a continuous variable, there was not a significant correlation between CV and the primary outcome (HR,1.37; 95%CI=0.71-2.62; P=.35).
Predictors for 5-year outcomes in 1581 heart transplant recipients
| Univariable | Multivariable | |||||
|---|---|---|---|---|---|---|
| HR | 95%CI | P | HR | 95%CI | P | |
| Rejection/graft loss/mortality | ||||||
| Coefficient of variation> 27.8% | 1.342 | 1.034-1.743 | .027 | 1.298 | 0.993-1.695 | .056 |
| Donor age> 39 y | 1.484 | 1.142-1.926 | .003 | 1.626 | 1.243-2.127 | <.001 |
| Calcineurin inhibitor type | ||||||
| Cyclosporine | 1 | 1 | ||||
| Tacrolimus immediate-release | 0.714 | 0.533-0.956 | .024 | 0.692 | 0.507-0.946 | .021 |
| Tacrolimus prolonged-release | 0.540 | 0.344-0.847 | .007 | 0.455 | 0.274-0.754 | .003 |
| History of first-year rejection | 1.400 | 1.080-1.814 | .011 | 1.412 | 1.084-1.840 | .011 |
| Circulatory support prior to HT | ||||||
| None | 1 | |||||
| Intra-aortic balloon | 1.011 | 0.715-1.431 | .950 | 1.093 | 0.770-1.553 | .618 |
| ECMO | 1.909 | 1.009-3.613 | .047 | 2.297 | 1.183-4.461 | .014 |
| Ventricular assist device | 0.725 | 0.321-1.636 | .439 | 0.941 | 0.404-2.193 | .889 |
| One-year LVEF <64% | 1.320 | 1.008-1.727 | .043 | 1.336 | 1.015-1.758 | .039 |
| Recipient age at HT> 56 y | 1.375 | 1.062-1.782 | .016 | 1.268 | 0.965-1.666 | .088 |
| Diabetes prior to HT | 1.525 | 1.124-2.07 | .007 | 1.323 | 0.965-1.814 | .083 |
| Mean blood levels <median value | 0.867 | 0.669-1.123 | .279 | 0.824 | 0.633-1.072 | .149 |
| One-year GFR>61 mL/min/1.73 m2 | 1.365 | 1.05-1.775 | .020 | 1.204 | 0.914-1.585 | .186 |
| Female recipient sex | 0.746 | 0.528-1.052 | .095 | 0.832 | 0.583-1.188 | .312 |
| Transplant era | ||||||
| 2000-2004 | 1 | |||||
| 2005-2009 | 0.773 | 0.561-1.066 | .116 | 0.871 | 0.625-1.213 | .414 |
| 2010-2014 | 0.912 | 0.671-1.239 | .556 | 1.086 | 0.755-1.561 | .657 |
| Mortality/graft loss | ||||||
| Coefficient of variation> 27.8% | 1.418 | 1.015-1.982 | .041 | 1.387 | 0.979-1.963 | .065 |
| Donor age> 39 y | 1.784 | 1.273-2.501 | .001 | 1.892 | 1.331-2.690 | <.001 |
| Calcineurin inhibitor type | ||||||
| Cyclosporine | 1.000 | 1 | ||||
| Tacrolimus immediate-release | 0.784 | 0.544-1.130 | .192 | 0.708 | 0.481-1.042 | .080 |
| Tacrolimus prolonged-release | 0.557 | 0.311-0.999 | .050 | 0.384 | 0.201-0.733 | .004 |
| Infection prior to HT | 1.509 | 0.949-2.398 | .082 | 1.720 | 1.071-2.763 | .025 |
| Diabetes prior to HT | 1.976 | 1.370-2.850 | <.001 | 1.552 | 1.056-2.281 | .025 |
| One-year LVEF <64% | 1.488 | 1.049-2.110 | .026 | 1.441 | 1.006-2.063 | .046 |
| History of first-year rejection | 1.332 | 0.957-1.853 | .089 | 1.415 | 1.005-1.992 | .047 |
| Recipient age at HT> 56 y | 1.504 | 1.081-2.093 | .016 | 1.335 | 0.940-1.896 | .106 |
| Bilirubin> 2 mg/dL | 1.562 | 0.940-2.595 | .085 | 0.694 | 0.415-1.157 | .163 |
| Mean blood levels <median value | 0.878 | 0.632-1.221 | .439 | 0.825 | 0.587-1.159 | .269 |
| One-year GFR <61mL/min/1.73 m2 | 1.370 | 0.980-1.914 | .065 | 1.132 | 0.796-1.609 | .490 |
| Transplant era | ||||||
| 2000-2004 | 1.000 | 1 | ||||
| 2005-2009 | 0.825 | 0.546-1.245 | .359 | 0.958 | 0.620-1.481 | .847 |
| 2010-2014 | 1.088 | 0.739-1.602 | .669 | 1.477 | 0.947-2.304 | .085 |
95%CI, 95% confidence interval; ECMO, extracorporeal membrane oxygenation; GFR, glomerular filtration rate; HR, hazard ratio; HT, heart transplant; LVEF, left ventricular ejection fraction.
. 95%CI, 95% confidence interval.")
Univariable associations with 5-year all-cause mortality/graft loss are presented in . A CV> 27.8% was significantly associated with higher 5-year mortality (HR,1.418; 95%CI, 1.015-1.982; P=.041). As a continuous variable, there was a significant correlation between CV and 5-year mortality, as well (HR, 2.22; 95%CI=1.09-4.57; P=.03). After multivariable adjustment, a CV> 27.8% did not maintain statistical significance (HR,1.387; 95%CI, 0.979-1.963; P=.065) (table 3, figure 5). Independent predictors of 5-year mortality/graft loss were CNI type (PRT and IRT compared with cyclosporin), donor age, pretransplant diabetes, pretransplant infection, 1-year LVEF and history of first-year rejection (table 3).
Sensitivity analysis.")
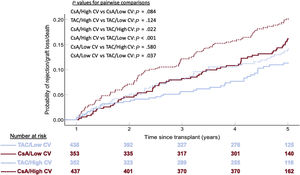
After exclusion of CNI type from the multivariable model, a high CV was significantly associated with both higher 5-year rejection or graft loss/mortality (HR, 1.358; 95%CI, 1.041-1.772; P=.024) and higher 5-year mortality/graft loss (HR, 1.489; 95%CI, 1.054-2.105; P=.024) (). We further analyzed the interaction between CNI type and CV group (figure 6). Within the same CNI type group, high CV tended to be associated with poorer outcomes, although without statistical significance. Likewise, within the same CV group, tacrolimus showed significantly better outcomes than cyclosporin.
 (Kaplan-Meier method). Blue lines indicate tacrolimus (TAC); red lines indicate cyclosporin; solid lines indicate low coefficient of variation; cashed lines indicate high coefficient of variation.")
Interaction between calcineurin inhibitor type and coefficient of variation group (CV) (Kaplan-Meier method). Blue lines indicate tacrolimus (TAC); red lines indicate cyclosporin; solid lines indicate low coefficient of variation; cashed lines indicate high coefficient of variation.
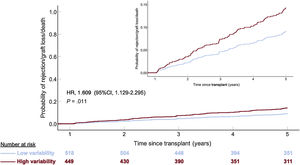
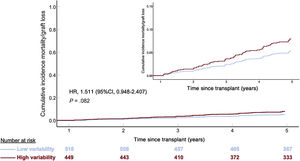
The results observed in patients without a previous history of rejection during the first posttransplant year are outlined in . In these patients, the high CV group showed an independent and highly significant association with 5-year rejection/graft loss/mortality (HR, 1.609; 95%CI, 1.129-2.295; P=.011) (figure 7). No significant association was observed with 5-year all-cause mortality/graft loss (HR, 1.511; 95%CI, 0.948-2.407; P=.082) (figure 8).
.")
Adjusted 5-year rejection or all-cause death/graft loss according to intrapatient calcineurin inhibitor blood level variability group in 967 heart transplant recipients with no history of rejection during the first post-transplant year. 95%CI, 95% confidence interval; HR, hazard ratio (Cox regression).
.")
Adjusted 5-year mortality/graft loss incidence according to intrapatient calcineurin inhibitor blood level variability group in 967 heart transplant recipients with no history of rejection during the first posttransplant year. 95%CI, 95% confidence interval; HR, hazard ratio (Cox regression).
Finally, when the type of immunoassay was added to the multivariable adjustment, the association between IPV and the primary composite outcome became significant, whereas the association with mortality/graft loss remained nonsignificant ().
DISCUSSIONThe results of the present study show that high IPV of CNIs blood levels during the first posttransplant year was not independently associated with lower mid-term rejection-free survival or higher mid-term mortality, although in both cases, a trend to such an association was detected overall. These findings could be attributable to a lack of statistical power, considering the relatively small number of events, as could be expected from our study design, focused on events occurring beyond the first postoperative year in a privileged population of 1-year survivors. Alternatively, our results could also reflect the interaction among multiple factors related to posttransplant mid-term outcomes, among which IPV could be a relevant factor only in some population subsets.
An important issue concerning the design of our study is the risk of protopathic bias, which stems from the fact that IPV is also associated with conditions that equally predispose to the late incidence of rejection or mortality. In this regard, we observed a significant association between CV during the first year posttransplant and both the incidence of rejection and low levels of CNI during the same period. Both factors may well be related to the incidence of rejection just beyond the first postoperative year. We tried to circumvent this drawback with a 2-pronged approach. First, we adjusted all the multivariable analyses by mean blood levels. Second, we carried out a sensitivity analysis restricted to a subset of patients featured by the absence of rejection episodes during the first postoperative year. In this population, it is less probable that variation of blood levels could be related to frequent dose adjustment aimed at the treatment and prevention of rejection. Remarkably, we found that the association between IPV and late rejection was even stronger in this more stable population than in the whole population, although the association with mortality was not statistically significant.
Although our study was not intended to evaluate differences among CNI types or formulations, we found an independent effect of CNI type on 5-year outcomes. The fact that the strength of the associations with outcomes were higher after excluding CNI type from de models suggests that the effect size observed in our study could be, at least in part, attributable to the CNI type. A more detailed assessment revealed that IPV is lower for tacrolimus-based formulations than for cyclosporin. These findings suggest that IPV is not such an important issue with tacrolimus-based immunosuppression as with cyclosporine-based immunosuppression, and that this characteristic could underlie the better clinical results obtained with tacrolimus. This is an important finding, as most contemporary immunosuppression is based on the use of tacrolimus. Of note, PRT had a lower IPV than both IRT and ciclosporin, as has already been noted in kidney transplant 27. It has been suggested that these findings could be explained by higher treatment adherence.28 Indeed, IPV has been proposed as a simple, quantitative and reliable marker of adherence.2,10 Our study design prevented us from conducting a detailed evaluation of treatment adherence.
Recently, Gueta et al.21 have reported the association between IPV 3 to 12 months post-HT of IRT and outcomes beyond the first postoperative year in a cohort of 72 HT recipients from a single center. They found an 8-fold increased risk for any rejection in patients with a CV above 28.8%. However, they could not observe any association with mortality. Differences in the strength of the associations compared with our study can be explained by methodological reasons. They considered any rejection in the observation period, which encompassed many episodes with only pathological expression (eg, 1R grade rejections), while we considered only those episodes requiring an augmentation in immunosuppression. Additionally, unlike in our study, they found no relationship between CV and mean blood levels or the incidence of rejection during the first posttransplant year. Inclusion of cyclosporin in our study could also account for some differences between studies. Regarding mortality, the lack of association with IPV is not surprising, as they carried out multivariable adjustment by severe cardiovascular complications (stroke, heart failure, myocardial infarction), and these complications are frequently the cause of death. Furthermore, a small number of deaths (8 in total) diminished their statistical power. Another recent work by Shuker et al.22 examined 86 heart transplant recipients treated with IRT. The authors could not establish any association between IPV and the development of cardiac allograft vasculopathy.
The relationship between IPV and biopsy-proven allograft rejection has been established in kidney,3,5,7–9,12,13 liver15–19 and heart21 transplant, in both cyclosporin3 and tacrolimus5,7–9,12,13,15–19,21,22 treated patients, and in both pediatric7,15–18 and adult populations.3,5,8,9,12,13,19,21 However, Godal et al.4 failed to demonstrate such an association after multivariable adjustment; the only remaining independent predictors of rejection were the development of donor-specific antibodies, low tacrolimus blood levels and a high clinic nonattendance rate. In contrast, as in the study by Gueta et al. and our own, the relationship between IPV and death remains elusive in renal14 or liver transplant due to limited study populations, low mortality rates, and the nonfatal consequences of allograft dysfunction in those contexts. Of note, in adult lung transplant, a clinical setting with a strong relationship between allograft dysfunction and death, Gallagher et al.20 observed a highly significant association between tacrolimus IPV and mortality.
The mechanisms explaining the association between IPV and rejection remain mostly unknown. According to our findings and those of Gueta et al.,21 the incidence of rejection does not seem to be related to lower blood trough levels in the high IPV group. In kidney transplant, Rodrigo et al.10 have shown a close relationship between IPV and death-censored graft loss mediated by the development of donor-specific antibodies. Likewise, Shen et al.12 have suggested an association between IPV and allograft rejection mediated by BK virus infection.
We used CV, which is a dimensionless parameter that allows the joint analysis of cyclosporine and tacrolimus. In line with previous investigations,4,5,10,11,13,14 for calculations we used measurements from months 3 to 12 posttransplant, in an attempt to avoid the influence of dose adjudgments, drug and diet interactions and absorption disturbances typical of the more unstable conditions usually observed during the early posttransplant period.
To date, this is the largest study dealing with the clinical consequences of erratic exposure to CNI and extends the knowledge on this topic gained from other solid-organ transplants. Its main strengths are the large sample size and its multi-institutional nature. However, some limitations deserve comments: a) The retrospective design, which is very sensitive to occult biases. Although covariate adjustment is the standard analytic approach, the effect of such biases cannot be completely circumvented. On the contrary, our study could be considered as a “real-life” study. b) The absence of uniform immunosuppression and rejection surveillance protocols, particularly for late rejection, among the participating institutions. c) We used a pragmatic definition of allograft rejection based mostly on the clinical judgment leading to specific therapy. This approach has been used in previous reports24 and seems to be particularly useful in multi-institutional studies, where a single protocol for rejection surveillance across the participating centers is lacking. Additionally, in the context of the later stages of HT, the clinical impact of the biopsy findings, when taken in isolation, remains controversial.26 However, it must be recognized that the use of this definition may include episodes that are in fact not acute rejection. d) The use of different assays for the measurement of tacrolimus blood levels, which may have produced significant differences in read-outs. e) The use of level measurements obtained during hospital admissions. Clinical conditions requiring hospitalization during the first posttransplant year (frequently rejection or infection) and their corresponding therapies can alter tacrolimus bioavailability, and subsequently, increase variability. However, in lung transplant, Gallagher et al.20 found no difference in the IPV of inpatient vs outpatient tacrolimus levels. Moreover, the number of measurements of tacrolimus levels at 4 to 12 months post-HT in our study were quite similar to those reported by Gueta et al.,21 where special care was taken to obtain steady state (at least 48hours on a fixed-dose regimen) trough levels at 3 to 12 months post-HT. e) Lack of information on the development of donor-specific antibodies and incidence of antibody-mediated rejection, which could have helped to explain some findings such as the cases of biopsy-negative rejection. f) The differences among CNIs should be carefully interpreted, as the follow-up durations were not the same for each of them.
CONCLUSIONSThe results of the present study show that IPV of CNI blood levels has a limited influence on mid-term outcomes in heart transplant. However, high IPV may predispose to rejection in initially stable patients.
- –
Blood level variability of calcineurin inhibitors has been related to poor outcomes (rejection, mortality) in solid-organ transplant recipients.
- –
Data are scarce in heart transplant. Only 1 study has shown a relationship between variability levels and rejection, but not with mortality. In another study, variability showed no relationship with the development of cardiac allograft vasculopathy.
- –
Information has been obtained from a large multicenter registry.
- –
The influence of variability levels is limited overall, and is mainly observed on the incidence of allograft rejection, but not on all-cause mortality or graft loss.
- –
Our results suggest that the influence of variability levels could be independent of that derived from the variations secondary to the treatment of episodes of early rejection.
- –
Both variability and its influence on outcomes seem to be less relevant in the contemporary era of tacrolimus-based therapy.
This work was supported by grants from Astellas Pharma (Spain) and the Heart Failure Association of the Spanish Society of Cardiology.
AUTHORS’ CONTRIBUTIONSF. González-Vílchez: study design, statistical analysis, draft writing, final manuscript approval; M.G. Crespo-Leiro, J. Delgado-Jiménez, F. Pérez-Villa, J. Segovia-Cubero, B. Díaz-Molina, S. Mirabet-Pérez, J.M. Arizón del Prado, T. Blasco-Peiró, M. Martínez-Sellés, L. Almenar-Bonet, I. Garrido-Bravo, and G. Rábago: discussion of results, final manuscript approval, data collection; J.A. Vázquez de Prada: study design, draft writing, final manuscript approval.
CONFLICTS OF INTERESTNo author declares any conflicts of interest.
Supplementary data associated with this article can be found in the online version available at https://doi.org/10.1016/j.rec.2021.02.001