Despite the prevalence of heart failure with preserved ejection fraction (HFpEF), there is currently no evidence-based effective therapy for this disease. This study sought to evaluate whether inspiratory muscle training (IMT), functional electrical stimulation (FES), or a combination of both (IMT + FES) improves 12- and 24-week exercise capacity as well as left ventricular diastolic function, biomarker profile, and quality of life in HFpEF.
MethodsA total of 61 stable symptomatic patients (New York Heart Association II-III) with HFpEF were randomized (1:1:1:1) to receive a 12-week program of IMT, FES, or IMT + FES vs usual care. The primary endpoint of the study was to evaluate change in peak exercise oxygen uptake at 12 and 24 weeks. Secondary endpoints were changes in quality of life, echocardiogram parameters, and prognostic biomarkers. We used a mixed-effects model for repeated-measures to compare endpoints changes.
ResultsMean age and peak exercise oxygen uptake were 74 ± 9 years and 9.9 ± 2.5mL/min/kg, respectively. The proportion of women was 58%. At 12 weeks, the mean increase in peak exercise oxygen uptake (mL/kg/min) compared with usual care was 2.98, 2.93, and 2.47 for IMT, FES, and IMT + FES, respectively (P < .001) and this beneficial effect persisted after 6 months (1.95, 2.08, and 1.56; P < .001). Significant increases in quality of life scores were found at 12 weeks (P < .001). No other changes were found.
ConclusionsIn HFpEF patients with low aerobic capacity, IMT and FES were associated with a significant improvement in exercise capacity and quality of life.
This trial was registered at ClinicalTrials.gov (Identifier: NCT02638961)..
Keywords
Heart failure with preserved left ventricular ejection fraction (HFpEF) constitutes the most prevalent form of HF in the aging population, particularly in women.1,2 To date, the most representative drug trials in HFpEF participants have failed to demonstrate a substantial prognostic benefit,3–7 which may explain why the associated morbidity and mortality of this syndrome remains excessively high.8–10 The hallmark clinical feature of HFpEF is a severe reduction in functional capacity,11 which limits patients’ activities of daily living and is an important determinant of the poor prognosis and quality of life (QoL).8
Physical aerobic exercise has consistently been shown to improve effort capacity and QoL in patients with heart failure with reduced ejection fraction12–14 however, it is unclear how it affects patients with the current definition of HFpEF.15 Other physical therapies such as inspiratory muscle training (IMT) and functional electrical stimulation (FES) also improve exercise capacity and QoL in heart failure with reduced ejection fraction patients13,14; however, there is little evidence supporting their feasibility and clinical usefulness in HFpEF.16,17
Accordingly, this randomized controlled study, the Inspiratory Muscle Training and Functional Electrical Stimulation for Treatment of HFpEF (TRAINING-HF) Trial, evaluated the effect of IMT, FES, and their combination on the functional capacity of patients with moderate-to-severe HFpEF. The secondary endpoints examined were QoL, echocardiography parameters, and cardiac biomarkers.
METHODSStudy DesignThis study was an investigator-initiated, open-label, randomized controlled study conducted at an academic medical center from September 2015 to December 2016. The study included patients with HFpEF and New York Heart Association functional class II-III/IV. The study design has been previously published.18 The diagnosis of HFpEF was made according to the criteria of the 2012 European Society of Cardiology Guidelines.19 All patients provided informed consent and the protocol was approved by the research ethics committee in accordance with the principles of the Declaration of Helsinki and national regulations. All analyses were performed by an independent company (MedStat Consulting, Reading, Pennsylvania, United States).
Study PopulationThe eligibility of candidate patients was based on the following inclusion criteria: a) New York Heart Association functional class ≥ II); b) left ventricular ejection fraction > 50% by Simpson method and end-diastolic diameter < 60mm; c) structural heart disease (left ventricle hypertrophy/left atrial enlargement) and/or diastolic dysfunction estimated by 2-dimensional echocardiography according to the 2012 European Society of Cardiology Guidelines19; and d) clinical stability measured by no hospital admissions in the past 3 months. Exclusion criteria were: a) inability to perform a valid baseline exercise test; b) significant primary moderate-to-severe valve disease; c) unstable angina, myocardial infarction, or cardiac surgery within the previous 3 months; d) uncontrolled arrhythmias or uncontrolled blood pressure during cardiopulmonary exercise testing; e) significant primary pulmonary disease, including history of pulmonary arterial hypertension, chronic thromboembolic pulmonary disease or chronic obstructive pulmonary disease; and f) any other comorbidity with a life expectancy < 1 year.
InterventionEligibility Assessment, Randomization, and Initial VisitPatients who met the inclusion/exclusion criteria and signed the written informed consent form were randomized (1:1:1:1) to 4 groups:18a) usual care (UC) alone; b) a home-based 12-week IMT program; c) a 12-week FES program of the lower limb muscles; or d) a 12-week combination of IMT and FES (IMT + FES). Follow-up was extended to 24 weeks with the aim of exploring the sustainability of the 12-week results. The first visit included a comprehensive medical history, physical examination, anthropometry measurements, and examination tests that were performed by 2 cardiologists blinded to the patient's allocation group. The examination tests included: electrocardiogram, echocardiography, cardiopulmonary exercise testing, 6-minute walk test, inspiratory muscle function test, QoL assessed by the Minnesota Living with Heart Failure Questionnaire, and cardiac biomarkers.
Training InterventionUsual Care Group. Patients allocated to this arm did not receive any physical therapy. They were checked weekly by a physiotherapist who measured their maximal inspiratory mouth pressure at each prespecified visit.
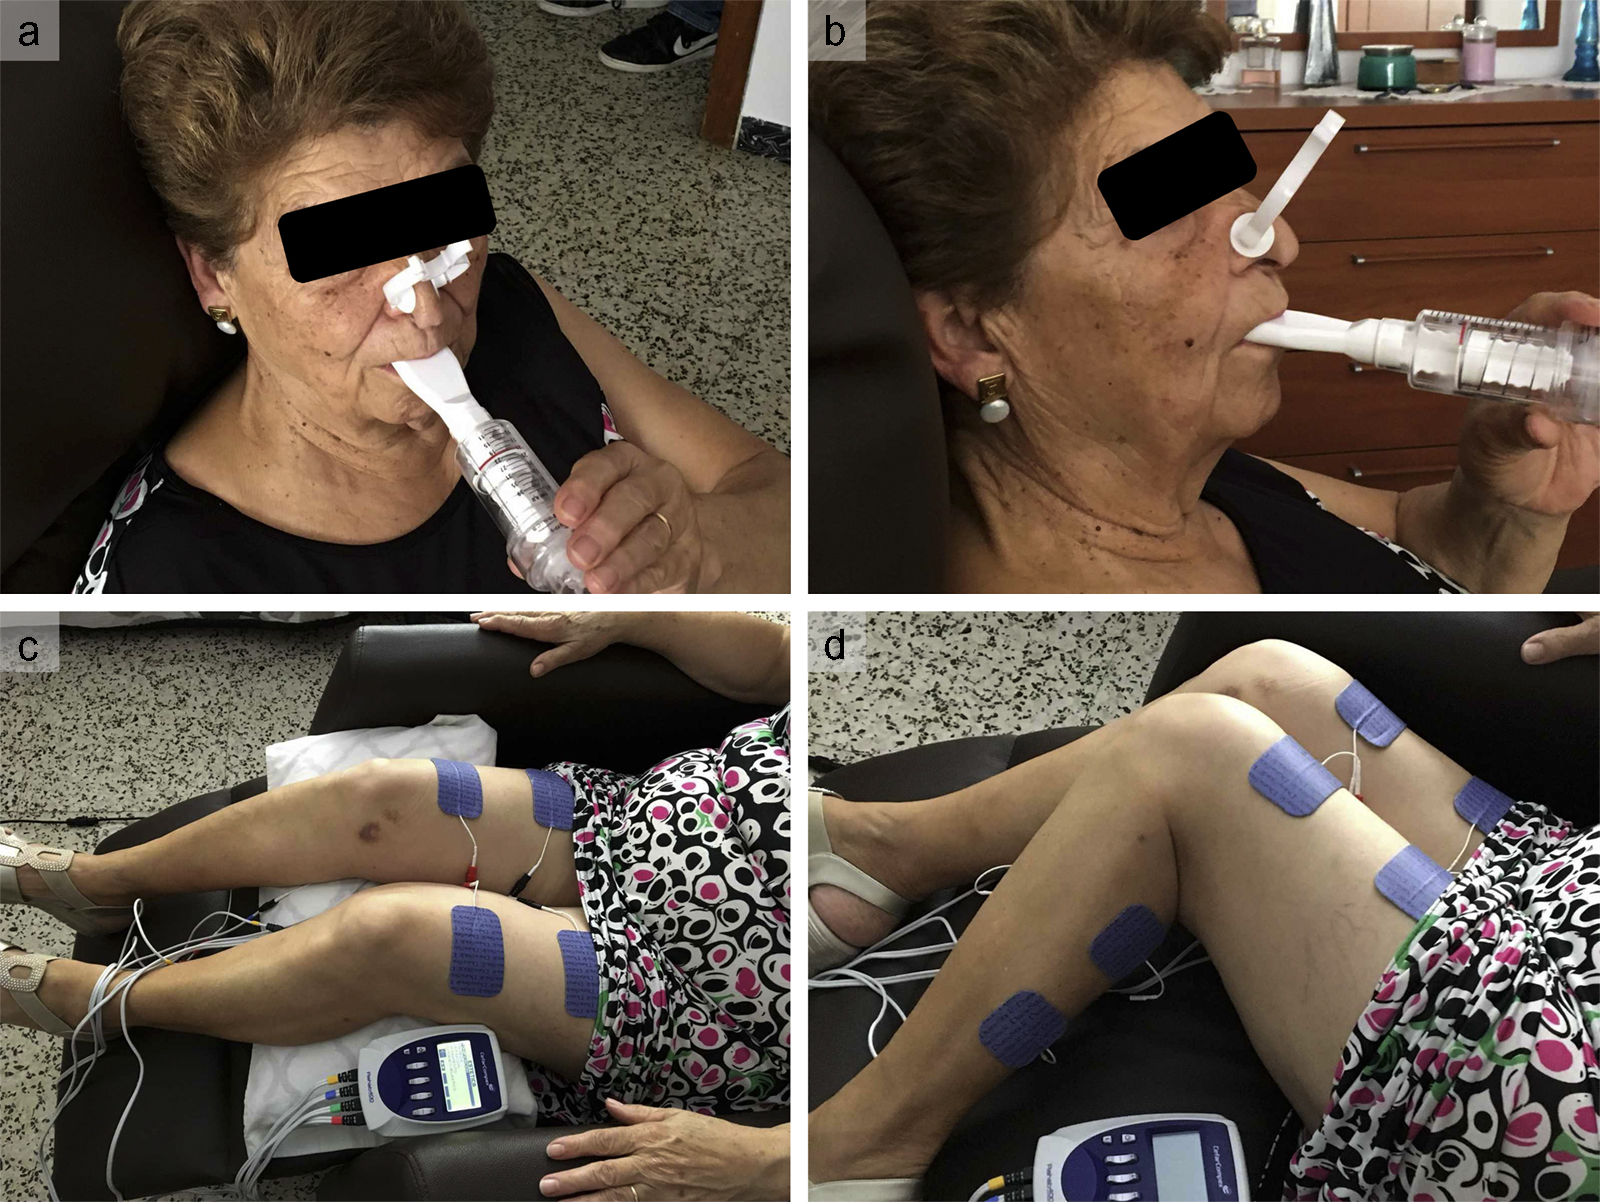
Inspiratory Muscle Training Group. These patients were instructed to train at home twice daily (20minutes each session) for 12 weeks using a threshold inspiratory muscle trainer (Threshold IMT, Respironics Inc) (). They were instructed by a respiratory therapist to maintain diaphragmatic breathing during the training period. Participants started breathing at a resistance equal to 25% to 30% of their maximal inspiratory pressure for 1 week. The respiratory therapist examined the patients weekly by checking the diary card and measuring their maximal inspiratory pressure. The resistance was modified each session to 25% to 30% of their measured maximal inspiratory pressure.
Functional Electrical Stimulation Group. These patients were trained in a FES program for both legs by a physiotherapist for 45minutes a day, 2 days per week for a total of 12 weeks. Eight adhesive electrodes were positioned on the skin over the quadriceps (5cm below the inguinal fold and 3cm above the upper patella border) and gastrocnemius muscles (2cm below the knee joint and just over the proximal end of the Achilles tendon) of both legs (). The stimulator (Rehab 400 Cefar Compex) was configured to deliver a biphasic current of low frequency (10 to 50Hz) for 5 s followed by rest for 5 s. The intensity of the stimulation was adjusted to achieve a visible muscle contraction without discomfort.
Inspiratory Muscle Training+Functional Electrical Stimulation Group. Patients allocated to the IMT + FES group received IMT and FES training at the same time for 12 weeks.
Physicians’ Follow-up VisitsAll patients were evaluated by a trained cardiologist from the heart failure unit at randomization and at the 12- and 24-week visits. Additional visits were permitted, based on the patient's clinical status. Prespecified protocol visits included the assessment of medical history, physical examination, anthropometry, electrocardiogram, cardiopulmonary exercise testing, 6-minute walk test, inspiratory muscle function test, Minnesota Living with Heart Failure Questionnaire, and blood tests. The cardiopulmonary exercise testing, 6-minute walk test, inspiratory muscle strength test, echocardiography, health-related QoL, and serum biomarkers are described in detail in the supplementary material.
EndpointsThe primary endpoint of the study was the comparison of peak oxygen uptake (peak VO2) changes from baseline (Δ-peak VO2) for each active treatment group vs UC at 12 and 24 weeks. Secondary endpoints included: a) 12- and 24-week changes from baseline (vs UC) in QoL (Δ-Minnesota Living with Heart Failure Questionnaire), b) 12- and 24-week changes from baseline (vs UC) in the E/E′ ratio (Δ-E/E′ ratio) and Δ-left atrial volume index, and c) 12- and 24-week changes from baseline (vs UC) in Δ-N-terminal pro-B-type natriuretic peptide and CA125 (Δ-CA125). As exploratory endpoints, the changes from baseline in ventilatory efficiency (Δ-VE/VCO2) and in the Δ-6-minute walk test of each active treatment group was compared with UC at 12 and 24 weeks. Evaluation of safety endpoints included the comparison of mortality and/or acute decompensated heart failure hospitalization rates for each active treatment group vs UC at the 24-week visit. The personnel involved in data collection/management were masked to the group assignment.
Statistical AnalysisAll statistical comparisons were made under a modified intention-to-treat principle.
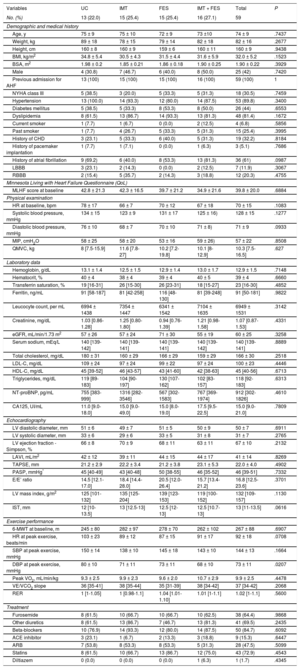
Descriptive AnalysisContinuous and categorical variables are presented as the mean ± standard deviation, median [interquartile range], or percentages, as appropriate (Table 1). Continuous variables were compared among groups with 1-way ANOVA or Kruskal-Wallis test for normal and nonnormal asymmetric variable distributions, respectively. Discrete variables were compared using the chi-square test.
Baseline Characteristics of the Study Population
| Variables | UC | IMT | FES | IMT + FES | Total | P |
|---|---|---|---|---|---|---|
| No. (%) | 13 (22.0) | 15 (25.4) | 15 (25.4) | 16 (27.1) | 59 | |
| Demographic and medical history | ||||||
| Age, y | 75 ± 9 | 75 ± 10 | 72 ± 9 | 73 ±10 | 74 ± 9 | .7437 |
| Weight, kg | 89 ± 18 | 78 ± 15 | 79 ± 14 | 82 ± 18 | 82 ± 16 | .2677 |
| Height, cm | 160 ± 8 | 160 ± 9 | 159 ± 6 | 160 ± 11 | 160 ± 9 | .9438 |
| BMI, kg/m2 | 34.8 ± 5.4 | 30.5 ± 4.3 | 31.5 ± 4.4 | 31.6 ± 5.9 | 32.0 ± 5.2 | .1523 |
| BSA, m2 | 1.98 ± 0.2 | 1.85 ± 0.21 | 1.86 ± 0.18 | 1.90 ± 0.25 | 1.90 ± 0.22 | .3929 |
| Male | 4 (30.8) | 7 (46.7) | 6 (40.0) | 8 (50.0) | 25 (42) | .7420 |
| Previous admission for AHF | 13 (100) | 15 (100) | 15 (100) | 16 (100) | 59 (100) | 1 |
| NYHA class III | 5 (38.5) | 3 (20.0) | 5 (33.3) | 5 (31.3) | 18 (30.5) | .7459 |
| Hypertension | 13 (100.0) | 14 (93.3) | 12 (80.0) | 14 (87.5) | 53 (89.8) | .3400 |
| Diabetes mellitus | 5 (38.5) | 5 (33.3) | 8 (53.3) | 8 (50.0) | 26 (44) | .6553 |
| Dyslipidemia | 8 (61.5) | 13 (86.7) | 14 (93.3) | 13 (81.3) | 48 (81.4) | .1672 |
| Current smoker | 1 (7.7) | 1 (6.7) | 0 (0.0) | 2 (12.5) | 4 (6.8) | .5856 |
| Past smoker | 1 (7.7) | 4 (26.7) | 5 (33.3) | 5 (31.3) | 15 (25.4) | .3995 |
| History of CHD | 3 (23.1) | 5 (33.3) | 6 (40.0) | 5 (31.3) | 19 (32.2) | .8184 |
| History of pacemaker implantation | 1 (7.7) | 1 (7.1) | 0 (0.0) | 1 (6.3) | 3 (5.1) | .7686 |
| History of atrial fibrillation | 9 (69.2) | 6 (40.0) | 8 (53.3) | 13 (81.3) | 36 (61) | .0987 |
| LBBB | 3 (23.1) | 2 (14.3) | 0 (0.0) | 2 (12.5) | 7 (11.9) | .3067 |
| RBBB | 2 (15.4) | 5 (35.7) | 2 (14.3) | 3 (18.8) | 12 (20.3) | .4755 |
| Minnesota Living with Heart Failure Questionnaire (QoL) | ||||||
| MLHF score at baseline | 42.8 ± 21.3 | 42.3 ± 16.5 | 39.7 ± 21.2 | 34.9 ± 21.6 | 39.8 ± 20.0 | .6884 |
| Physical examination | ||||||
| HR at baseline, bpm | 78 ± 17 | 66 ± 7 | 70 ± 12 | 67 ± 18 | 70 ± 15 | .1083 |
| Systolic blood pressure, mmHg | 134 ± 15 | 123 ± 9 | 131 ± 17 | 125 ± 16) | 128 ± 15 | .1277 |
| Diastolic blood pressure, mmHg | 76 ± 10 | 68 ± 7 | 70 ± 10 | 71 ± 8) | 71 ± 9 | .0933 |
| MIP, cmH2O | 58 ± 25 | 58 ± 20 | 53 ± 16 | 59 ± 26) | 57 ± 22 | .8508 |
| QMVC, kg | 8 [7.5-15.9] | 11.6 [7.8-27] | 10.2 [7.2-19.8] | 10.1 [8-12.9] | 10.3 [7.5-16.5] | .627 |
| Laboratory data | ||||||
| Hemoglobin, g/dL | 13.1 ± 1.4 | 12.5 ± 1.5 | 12.9 ± 1.4 | 13.0 ± 1.7 | 12.9 ± 1.5 | .7148 |
| Hematocrit, % | 40 ± 4 | 38 ± 4 | 39 ± 4 | 40 ± 5 | 39 ± 4 | .6660 |
| Transferrin saturation, % | 19 [16-31] | 26 [15-30] | 26 [23-31] | 18 [15-27] | 23 [16-30] | .4852 |
| Ferritin, ng/mL | 91 [58-187] | 81 [42-258] | 116 [48-130] | 81 [39-248] | 91 [50-181] | .9822 |
| Leucocyte count, per mL | 6994 ± 1438 | 7354 ± 1447 | 6341 ± 1542 | 7104 ± 1635 | 6949 ± 1531 | .3142 |
| Creatinine, mg/dL | 1.03 [0.86-1.28] | 1.25 [0.80-1.80] | 0.94 [0.76-1.39] | 1.21 [0.98-1.58] | 1.07 [0.87-1.53] | .4331 |
| eGFR, mL/min/1.73 m2 | 57 ± 26 | 57 ± 24 | 71 ± 30 | 55 ± 19 | 60 ± 25 | .3258 |
| Serum sodium, mEq/L | 140 [139-142] | 140 [139-141] | 140 [139-141] | 140 [139-142] | 140 [139-141] | .8889 |
| Total cholesterol, mg/dL | 180 ± 31 | 160 ± 29 | 166 ± 29 | 159 ± 29 | 166 ± 30 | .2518 |
| LDL-C, mg/dL | 109 ± 24 | 97 ± 24 | 99 ± 22 | 97 ± 24 | 100 ± 23 | .4446 |
| HDL-C, mg/dL | 45 [39-52] | 46 [43-57] | 43 [41-60] | 42 [38-63] | 45 [40-56] | .6713 |
| Triglycerides, mg/dL | 119 [89-183] | 104 [90-197] | 130 [107-162] | 102 [83-157] | 118 [92-183] | .6313 |
| NT-proBNP, pg/mL | 755 [383-999] | 1316 [282-3546] | 567 [302-1583] | 767 [369-1974] | 912 [302-1826] | .4610 |
| CA125, UI/mL | 11.0 [9.0-18.0] | 15.0 [9.0-49.0] | 15.0 [8.0-19.0] | 17.5 [9.5-22.5] | 15.0 [9.0-21.0] | .7809 |
| Echocardiography | ||||||
| LV diastolic diameter, mm | 51 ± 6 | 49 ± 7 | 51 ± 5 | 50 ± 9 | 50 ± 7 | .6911 |
| LV systolic diameter, mm | 33 ± 6 | 29 ± 6 | 33 ± 5 | 31 ± 8 | 31 ± 7 | .2765 |
| LV ejection fraction - Simpson, % | 66 ± 8 | 70 ± 9 | 68 ± 11 | 63 ± 11 | 67 ± 10 | .2132 |
| LAVI, mL/m2 | 42 ± 12 | 39 ± 11 | 44 ± 15 | 44 ± 17 | 41 ± 14 | .8269 |
| TAPSE, mm | 21.2 ± 2.9 | 22.2 ± 3.4 | 21.2 ± 3.8 | 23.1 ± 5.3 | 22.0 ± 4.0 | .4902 |
| PASP, mmHg* | 45 [40-49] | 43 [40-48] | 50 [38-55] | 46 [35-52] | 46 [39-51] | .7332 |
| E/E’ ratio | 14.5 [12.1-17.0] | 18.4 [14.4-28.0] | 20.5 [12.0-26.4] | 15.7 [13.4-21.2] | 16.8 [12.5-23.6] | .3701 |
| LV mass index, g/m2 | 125 [101-132] | 135 [125-204] | 139 [123-153] | 119 [100-152] | 132 [109-157] | .1130 |
| IST, mm | 12 [10-13.5] | 13 [12.5-13] | 12.5 [12-13] | 12.5 [10.7-13] | 13 [11-13.5] | .0616 |
| Exercise performance | ||||||
| 6-MWT at baseline, m | 245 ± 80 | 282 ± 97 | 278 ± 70 | 262 ± 102 | 267 ± 88 | .6907 |
| HR at peak exercise, beats/min | 103 ± 23 | 89 ± 12 | 87 ± 15 | 91 ± 17 | 92 ± 18 | .0708 |
| SBP at peak exercise, mmHg | 150 ± 14 | 138 ± 10 | 145 ± 18 | 143 ± 10 | 144 ± 13 | .1664 |
| DBP at peak exercise, mmHg | 80 ± 10 | 71 ± 11 | 73 ± 11 | 68 ± 10 | 73 ± 11 | .0207 |
| Peak VO2, mL/min/kg | 9.3 ± 2.5 | 9.9 ± 2.3 | 9.6 ± 2.0 | 10.7 ± 2.9 | 9.9 ± 2.5 | .4478 |
| VE/VCO2 slope | 36 [35-41] | 38 [35-44] | 35 [31-39] | 38 [34-42] | 37 [34-42] | .2068 |
| RER | 1 [1-1.05] | 1 [0.98-1.1] | 1.04 [1.01-1.10] | 1.01 [1-1.1] | 1.02 [1-1.1] | .5600 |
| Treatment | ||||||
| Furosemide | 8 (61.5) | 10 (66.7) | 10 (66.7) | 10 (62.5) | 38 (64.4) | .9868 |
| Other diuretics | 8 (61.5) | 13 (86.7) | 7 (46.7) | 13 (81.3) | 41 (69.5) | .2435 |
| Beta-blockers | 10 (76.9) | 14 (93.3) | 12 (80.0) | 14 (87.5) | 50 (84.7) | .6092 |
| ACE inhibitor | 3 (23.1) | 1 (6.7) | 2 (13.3) | 3 (18.8) | 9 (15.3) | .6447 |
| ARB | 7 (53.8) | 8 (53.3) | 8 (53.3) | 5 (31.3) | 28 (47.5) | .5099 |
| Statins | 8 (61.5) | 10 (66.7) | 13 (86.7) | 12 (75.0) | 43 (72.9) | .4543 |
| Diltiazem | 0 (0.0) | 0 (0.0) | 0 (0.0) | 1 (6.3) | 1 (1.7) | .4345 |
Data are expressed as No. (%), mean ± standard deviation or median [interquartile range].
6-MWT, 6-minute walk test; ACE inhibitor, angiotensin-converting enzyme inhibitor; AHF, acute heart failure; ARB, angiotensin II receptor antagonist; BMI, body mass index; bpm, beats per minute; BSA, body surface area; CA125, carbohydrate antigen-125; CHD, coronary heart disease; DBP, diastolic blood pressure; eGFR, estimated glomerular filtration rate using the Modification of Diet in Renal Disease formula; E/E’ ratio, ratio of transmitral Doppler early filling velocity to tissue Doppler early diastolic mitral annular velocity; HDL-C, high-density lipoprotein cholesterol; HR, heart rate; IST, interventricular septal thickness; LAVI, left atrial volume index; LBBB, left bundle branch block; LDL-C, low-density lipoprotein cholesterol; LV, left ventricular; MIP, maximal inspiratory pressure; MLHF, Minnesota Living with Heart Failure Questionnaire; NT-proBNP, N-terminal pro-B-type natriuretic peptide; NYHA, New York Heart Association functional class; PASP, pulmonary artery systolic pressure; peak VO2, peak oxygen consumption; QMVC, quadriceps maximal volitional contraction; QoL, quality of life; RBBB, right bundle branch block; RER, respiratory exchange ratio; SBP, systolic blood pressure; TAPSE, tricuspid annular plane systolic excursion; VE/VCO2 slope, relationship between minute ventilation and the rate of CO2 elimination.
The null hypothesis of the study was that, among the 4 intervention arms, the mean peak VO2 absolute differences from baseline were similar at 3 and 6 months. Sample size determination for this study assumed 2-sided testing at the .05 significance α level. The effect size in peak VO2 associated with IMT was based on a pilot study conducted by our group16; in that study, IMT was associated with a significant increase of mean of peak VO2 of 3mL/kg/min (from 9 ± 2.5mL/kg/min to 12 ± 2.5mL/kg/min) at 12 weeks. With these data in mind, we assumed a mean change of 3.0mL/kg/min and a common standard deviation of 3.0. The effect size in FES was based on a recent study of heart failure with reduced ejection fraction,20 where FES was associated with a significant increase of mean of peak VO2 of 2mL/kg/min (from 9.6 ± 3.5mL/kg/min to 11.6 ± 2.8mL/kg/min) at 10 weeks. Due to the lack of any source on the effect of FES in HFpEF, we speculated a similar increase in peak VO2 for patients with HFpEF. Therefore, we assumed a mean change of 2.0mL/kg/min and a common standard deviation of 3.0. For patients allocated to both interventions (IMT + FES), and assuming a synergistic effect of both therapies, we postulated an effect size for both interventions of about 4.0mL/kg/min ± 3.0). Assuming an allocation ratio of 1:1:1:1, a total of 48 patients (12 patients per group) would provide 80% power at an α significance level < .05. In the end, 15 patients per arm (60 patients in total) were estimated, assuming 20% withdrawals or losses to follow-up. The software used for the sample size calculation was GLIMMPSE.
Inferential AnalysesAll efficacy endpoints (primary and secondary) were analyzed using a mixed-effects model for repeated measures to compare their Δ (absolute difference from baseline) among the different treatment modalities (between-effect) and over time (within-effect). Contrast among groups was adjusted for multiple comparisons using the Sidak method. The model included treatment, month, and a treatment × month interaction as fixed effects, and the baseline value of the endpoint as covariate. The decision to include the time variable as a random effect (random slope) in any mixed-effects model for repeated-measures was based on a likelihood test statistic. An unstructured covariance metric was always used. However, in Table 2 we have depicted the least square means of the endpoints (and not their Δ); in addition, no adjustment was made by including the baseline value of the endpoint as covariate. All analyses were based using all data available with no imputation of missing values. A 2-sided P value < .05 was considered statistically significant for all analyses. All analyses were performed with Stata 14.2
Primary and Secondary Endpoints With Observed Values Stratified by Treatment Group and Planned Visits
| Endpoints | Usual care | IMT | ||||||
|---|---|---|---|---|---|---|---|---|
| Baseline | 12-week | 24-week | P value* 12-week 24-week | Baseline | 12-week | 24-week | P value* 12-week 24-week | |
| No. | 13 | 13 | 13 | 15 | 13 | 13 | ||
| Peak VO2, mL/min/kg | 9.3 ± 2.5 | 8.8 ± 2.6 | 8.9 ± 2.5 | .111 .204 | 9.9 ± 2.3 | 12.6 ± 3.4 | 11.7 ± 3.1 | < .001 < .001 |
| MLHF | 42.8 ± 21.3 | 42.6 ± 21.8 | 40.4 ± 22.4 | 1.000 .997 | 42.3 ± 16.5 | 27.8 ± 14.8 | 27.2 ± 14.5 | < .001 < .001 |
| NT-proBNP, pg/mL | 755 (383-999) | 983 (246-1193) | 721 (311-866) | .928 1.000 | 1316 (282-3546) | 910 (183-2301) | 909 (199-1941) | .068 .034 |
| CA125, UI/mL | 11.0 (9.0-18.0) | 16.0 (8-21) | 17.0 (8.0-22.0) | .305 .168 | 15.0 (9.0-49.0) | 13.0 (8.0-19.0) | 15.0 (9.0-19.0) | .993 .994 |
| E/E’ ratio | 14.5 (12.1-17) | 14.3 (13.4-19.0) | 15.8 (12.7-21.5) | 1.000 .939 | 18.4 (14.4-28.0) | 17.2 (12.4-23.1) | 17.6 (12.8-23.3) | .015 .207 |
| LAVI, mL/m2 | 42 ± 12 | 44 ± 20 | 44 ± 19 | .898 .787 | 39 ± 11 | 36 ± 9 | 31 ± 11 | .719 .008 |
| VE-VCO2 slope | 37.9 ± 6.3 | 37 ± 5.9 | 37.4 ± 5.4 | .813 .981 | 38.5 ± 5.7 | 35.3 ± 5.8 | 34.4 ± 4.7 | .011 .001 |
| Endpoints | FES | IMT + FES | ||||||
|---|---|---|---|---|---|---|---|---|
| Baseline | 12-week | 24-week | P value* 12-week 24-week | Baseline | 12-week | 24-week | P value* 12-week 24-week | |
| n | 15 | 13 | 13 | 16 | 13 | 13 | ||
| Peak VO2, mL/min/kg | 9.6 ± 2.0 | 11.8 ± 2.6 | 11.0 ± 3.3 | < .001 < .001 | 10.7 ± 2.9 | 12.9 ± 3.7 | 12.1 ± 3.7 | < .001 .002 |
| MLHF | 39.7 ± 21.2 | 27.1 ± 16.7 | 31.1 ± 20.5 | .014 .275 | 34.9 ± 21.6 | 19.8 ± 14.6 | 25.3 ± 14.1 | < .001 .029 |
| NT-proBNP, pg/mL | 567 (302-1583) | 667 (247-1310) | 672 (210-1918) | .750 .978 | 767 (369-1974) | 615 (344-1242) | 1007 (306-2106) | .845 .809 |
| CA125, UI/mL | 15.0 (8.0-19.0) | 14.0 (10-16) | 14.0 (10-17) | .926 .987 | 17.5 (9.5-22.5) | 17.0 (10.0-21.0) | 21.0 (15.0-27.0) | .960 .109 |
| E/E’ ratio | 20.5 (12-26.4) | 15.7 (11.8-21.8) | 17.2 (12.6-23.5) | .001 .092 | 15.7 (13.4-21) | 14.5 (11.4-19.9) | 14.5 (10.1-16.6) | .632 .011 |
| LAVI, mL/m2 | 44 ± 15 | 41 ± 14 | 43 ± 16 | .093 .495 | 40 ± 17 | 33 ± 12 | 35 ± 12 | .928 .997 |
| VE-VCO2 slope | 35.1 ± 4.5 | 34.5 ± 6.3 | 35 ± 5.8 | .959 .996 | 38.4 ± 4.5 | 35.4 ± 4.5 | 36.4 ± 5 | .009 .120 |
Data are expressed as No. (%), mean ± standard deviation or median [interquartile range].
CA125, carbohydrate antigen-125; E/E’ ratio, ratio of transmitral Doppler early filling velocity to tissue Doppler early diastolic mitral annular velocity; FES, functional electrical stimulation; IMT, inspiratory muscle training; LAVI, left atrial volume index; MLHF, Minnesota Living with Heart Failure Questionnaire; NT-proBNP, N-terminal pro-B-type natriuretic peptide; peak VO2, peak oxygen consumption; VE/VCO2 slope, relationship between minute ventilation and the rate of CO2 elimination
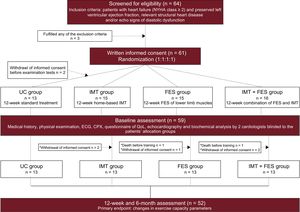
A total of 64 patients were screened for eligibility and 61 were randomized. Of these patients, 2 withdrew informed consent before the initial assessment (visit 1) leaving 59 patients to start the intervention. Before the training intervention, 2 patients died and 5 withdrew from the study due to other reasons (lack of support from caregivers or potential transportation barriers to guarantee adherence and attendance to scheduled visits); thus, a total of 52 patients (Figure 1) finished the trial. The mean age of the sample who started the intervention was 74 ± 9 years, 34 (58%) were female, 18 (30.5%) were in New York Heart Association functional class III/IV, and all were previously admitted for acute decompensated heart failure. The mean peak VO2, body mass index, Minnesota Living with Heart Failure Questionnaire score, and 6-minute walk test were 9.9 ± 2.5mL/min/kg, 32 ± 5.2kg/m2, 39.8 ± 20, and 267 ± 88 m, respectively. The median [interquartile range] of the N-terminal pro-B-type natriuretic peptide value and ventilatory efficiency (VE/VCO2 slope) were 912 pg/mL [302-1826] and 37 [34-42], respectively. The omnibus P values indicated there were no significant differences in baseline characteristics among the 4 treatment groups, except for diastolic blood pressure at peak exercise (Table 1). The mean observed values for all endpoints, stratified for the assigned treatment and prespecified visits (baseline, 12, and 24 weeks), are presented in Table 2.
Primary EndpointBetween-person Comparisons
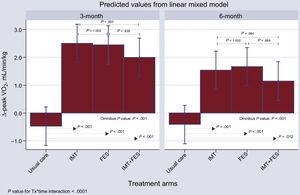
The mixed-effects model for the repeated measures model showed a significant increase in Δ-peak VO2 for IMT, FES, and IMT + FES at 12 and 24 weeks (Figure 2). When the UC group was used as a reference category, the net mean increase in Δ-peak VO2 at 12 weeks was 2.98, 2.93, and 2.47 for IMT, FES, and IMT + FES, respectively (omnibus P value < .001); furthermore, the individual contrast between each active treatment group and UC was significant (Figure 2). This significant effect persisted, but was less intense, at 24 weeks with net Δ-peak VO2 values of 1.95, 2.08, and 1.56 for IMT, FES, and IMT + FES, respectively (omnibus P value < .001). No statistically significant differences in Δ-peak VO2 were documented either at 12 or 24 weeks when the 3 active arms were compared (Figure 2).
Within-person Comparisons
Overall, there was a decrease in Δ-peak VO2 values of -0.96, -0.78, and -0.85 for IMT, FES, and IMT + FES, respectively for the 24- vs 12-week comparison (omnibus P value < .001); no significant changes were documented for the UC group [+0.06 (P = .84)].
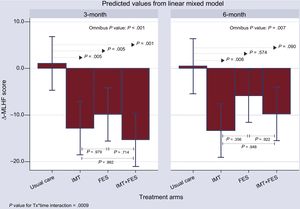
Secondary EndpointsMinnesota Living With Heart Failure Questionnaire ScoreOverall, the 3 active treatment groups showed a significant decrease in the Δ-Minnesota Living with Heart Failure Questionnaire score compared with the UC group at 12 weeks (Figure 3); while no sizable changes occurred in the UC group. The comparison with the UC group revealed a net mean decrease of 13.85, 10.91, and 16.34 for the IMT, FES, and IMT + FES groups, respectively (P ≤ .005 for all comparisons) at 12 weeks. The effect over time persisted for IMT and was borderline for IMT + FES. The effect was no longer significant for FES (Figure 3).

Change from baseline in the Minnesota Living with Heart Failure Questionnaire score among treatments and visits. FES, functional electrical stimulation; IMT, inspiratory muscle training; UC, usual care; Δ-MLHF, Δ-Minnesota Living with Heart Failure Questionnaire score; Tx, treatment.
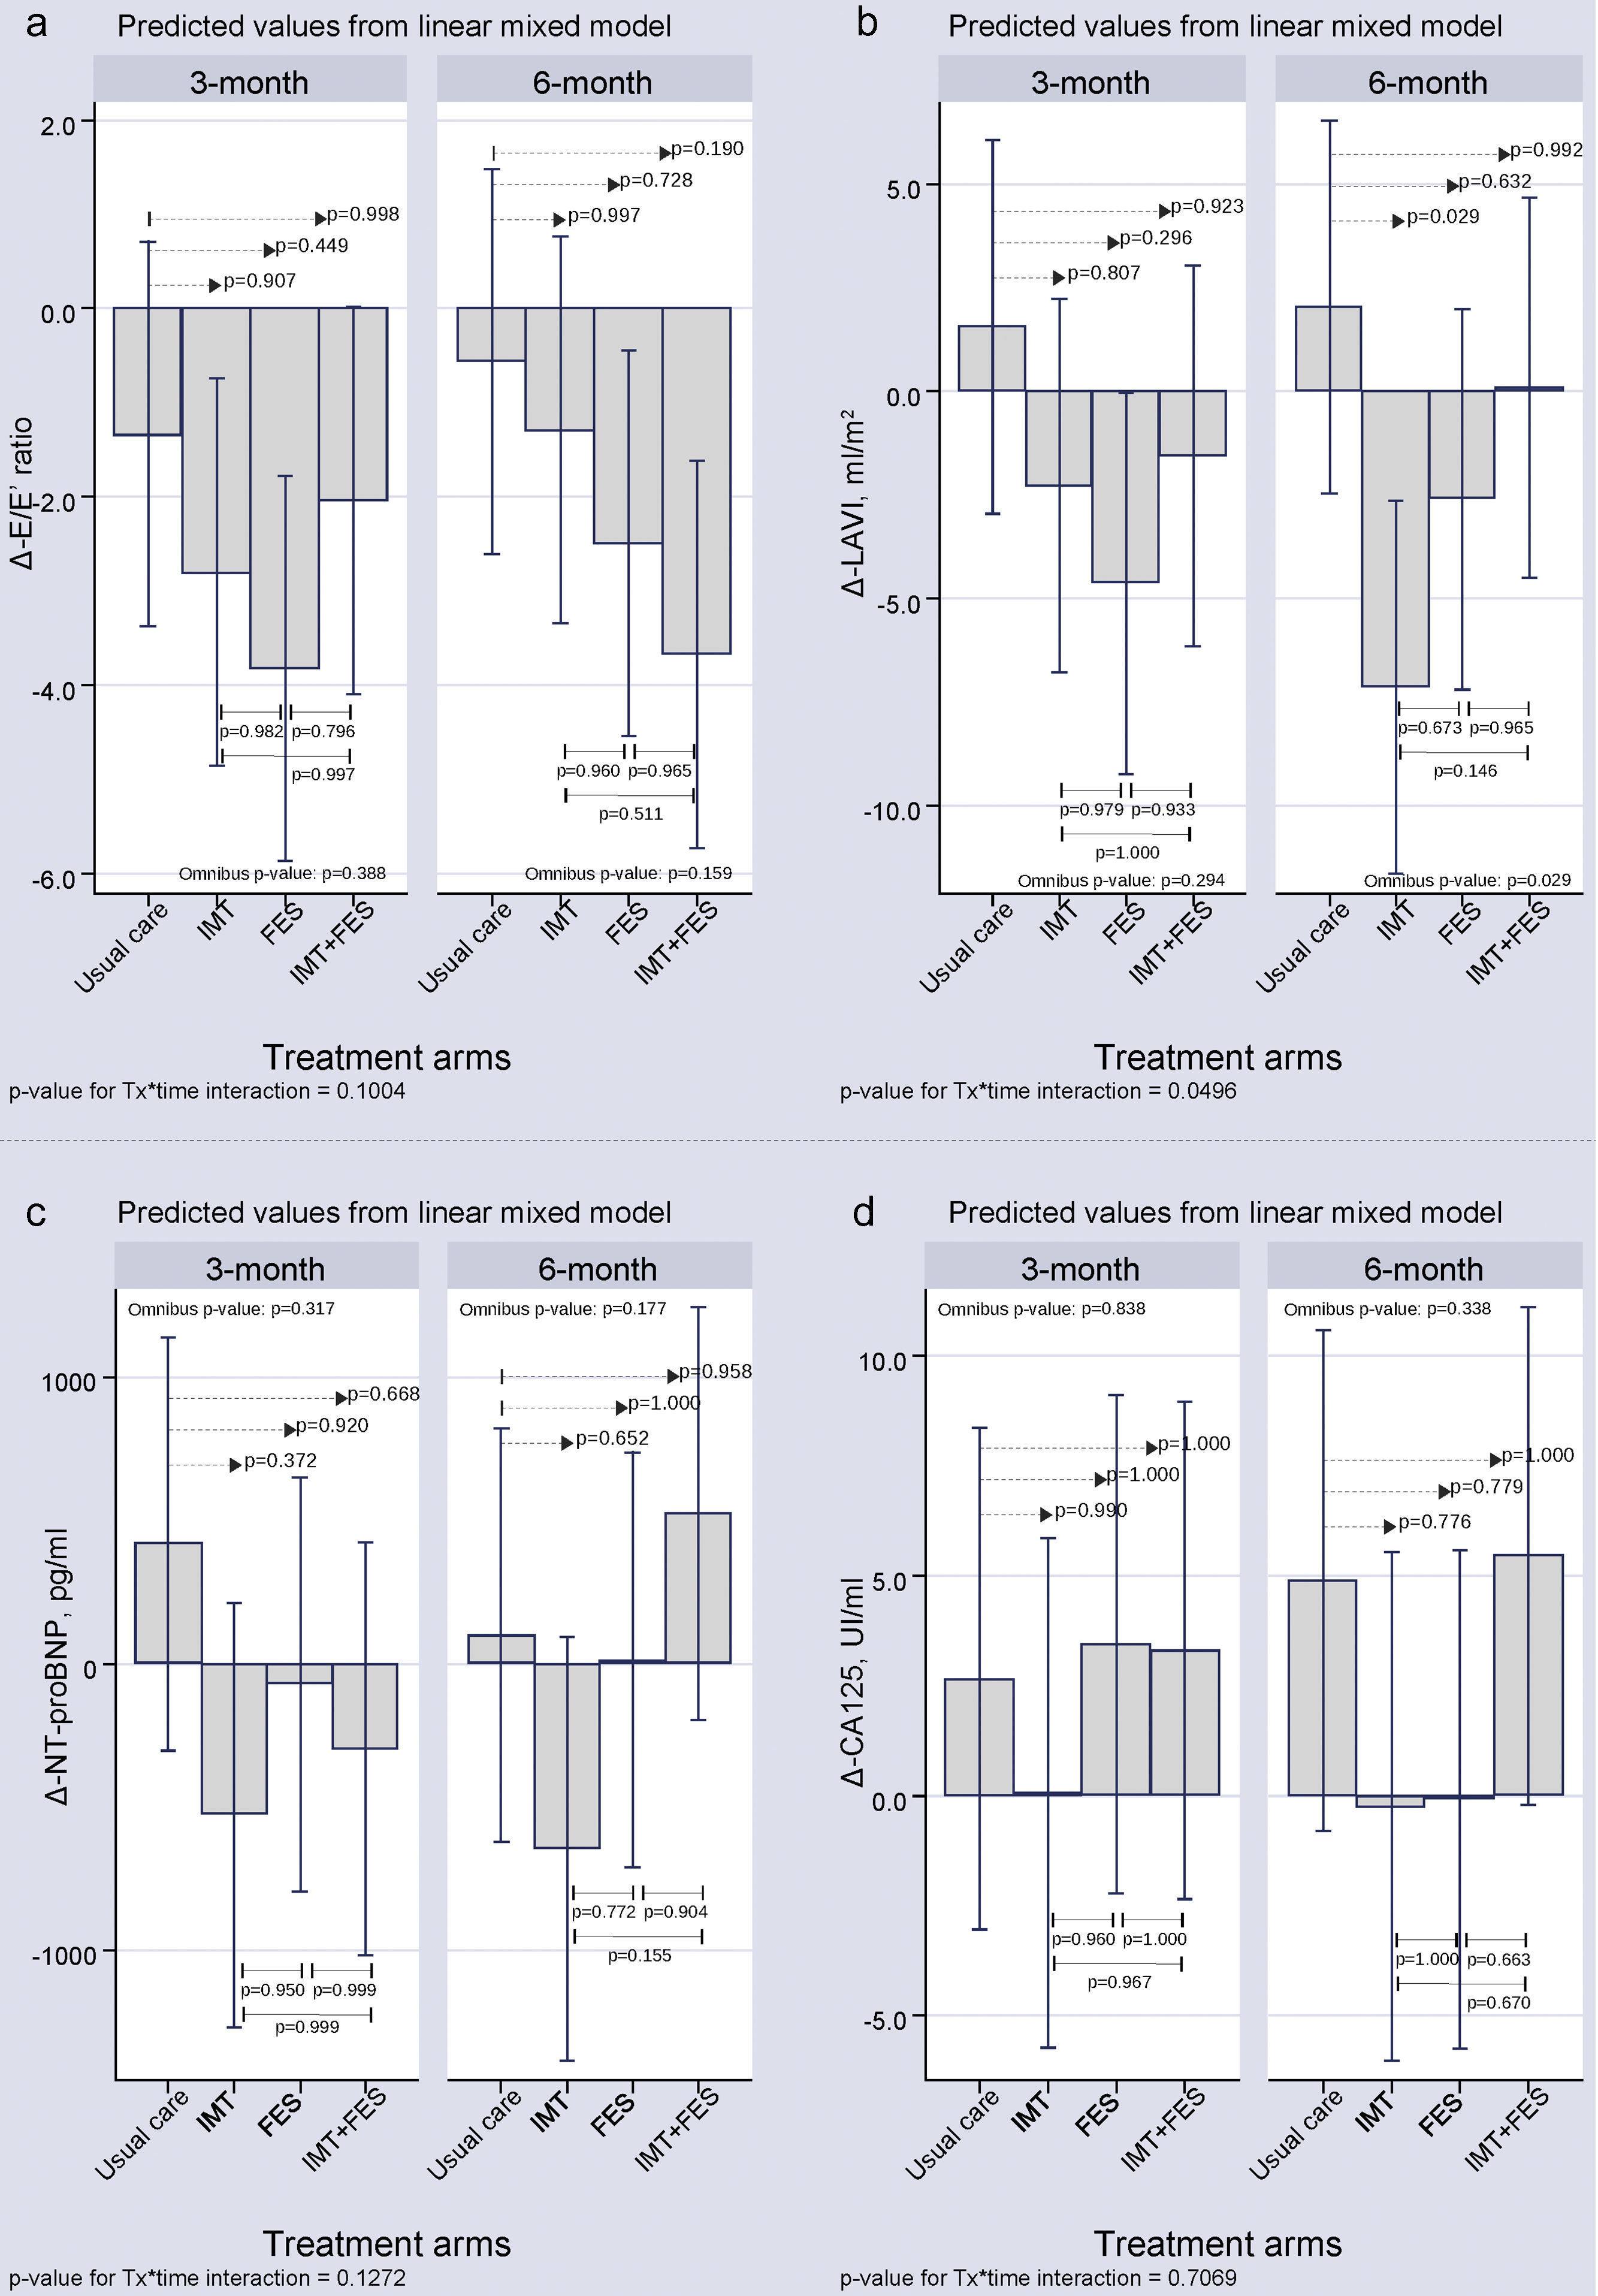
All treatment groups had a decrease in the Δ-E/E′ ratio at the 12- and 24-week visits (). However, there were no significant differences for any of the active treatment groups compared with the UC group at 12 and 24 weeks. The Δ-left atrial volume index at 3 months showed no significant differences for any of the active treatment groups compared with UC. At the 6-month visit, a significant decrease in Δ-left atrial volume index occurred only for IMT compared with UC (-9.20; P = .029) ().
Laboratory ParametersThere were no significant differences for Δ-N-terminal pro-B-type natriuretic peptide and Δ-CA125 among treatment arms at 3 or 6 months ().
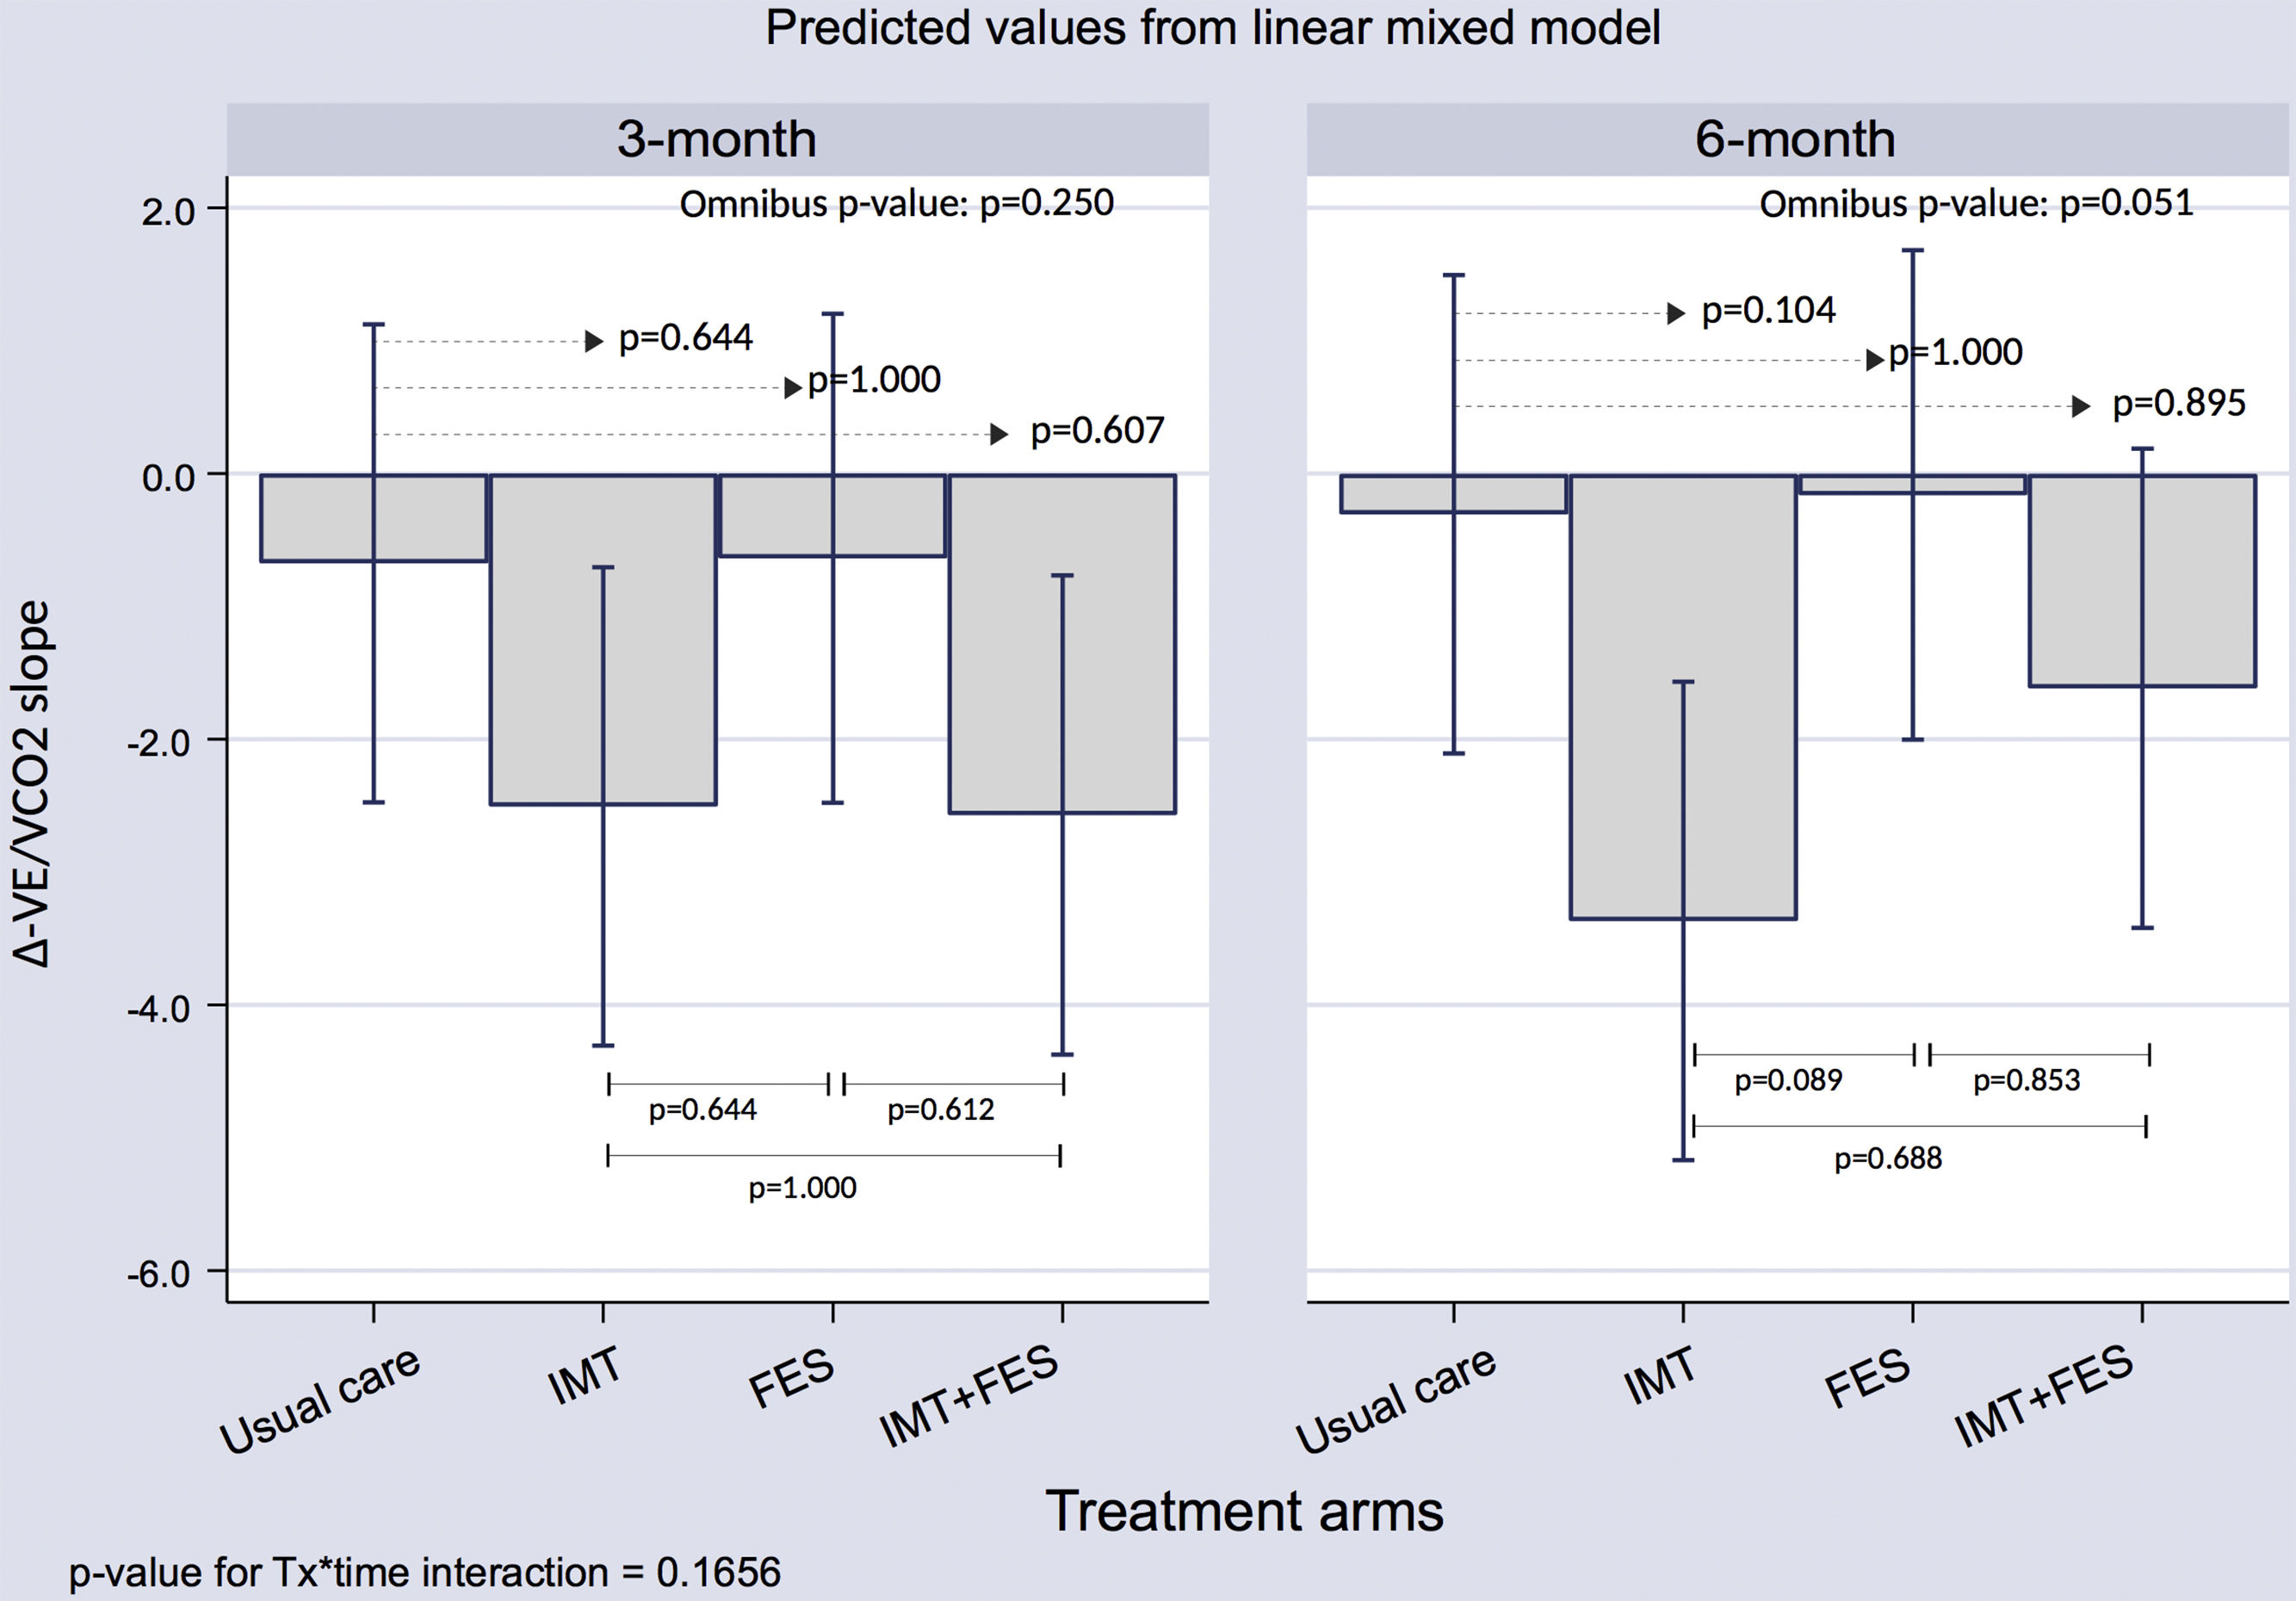
Exploratory AnalysisVE/VCO2 SlopeThere were no significant differences for ventilatory efficiency among treatment arms at 3 or 6 months ().
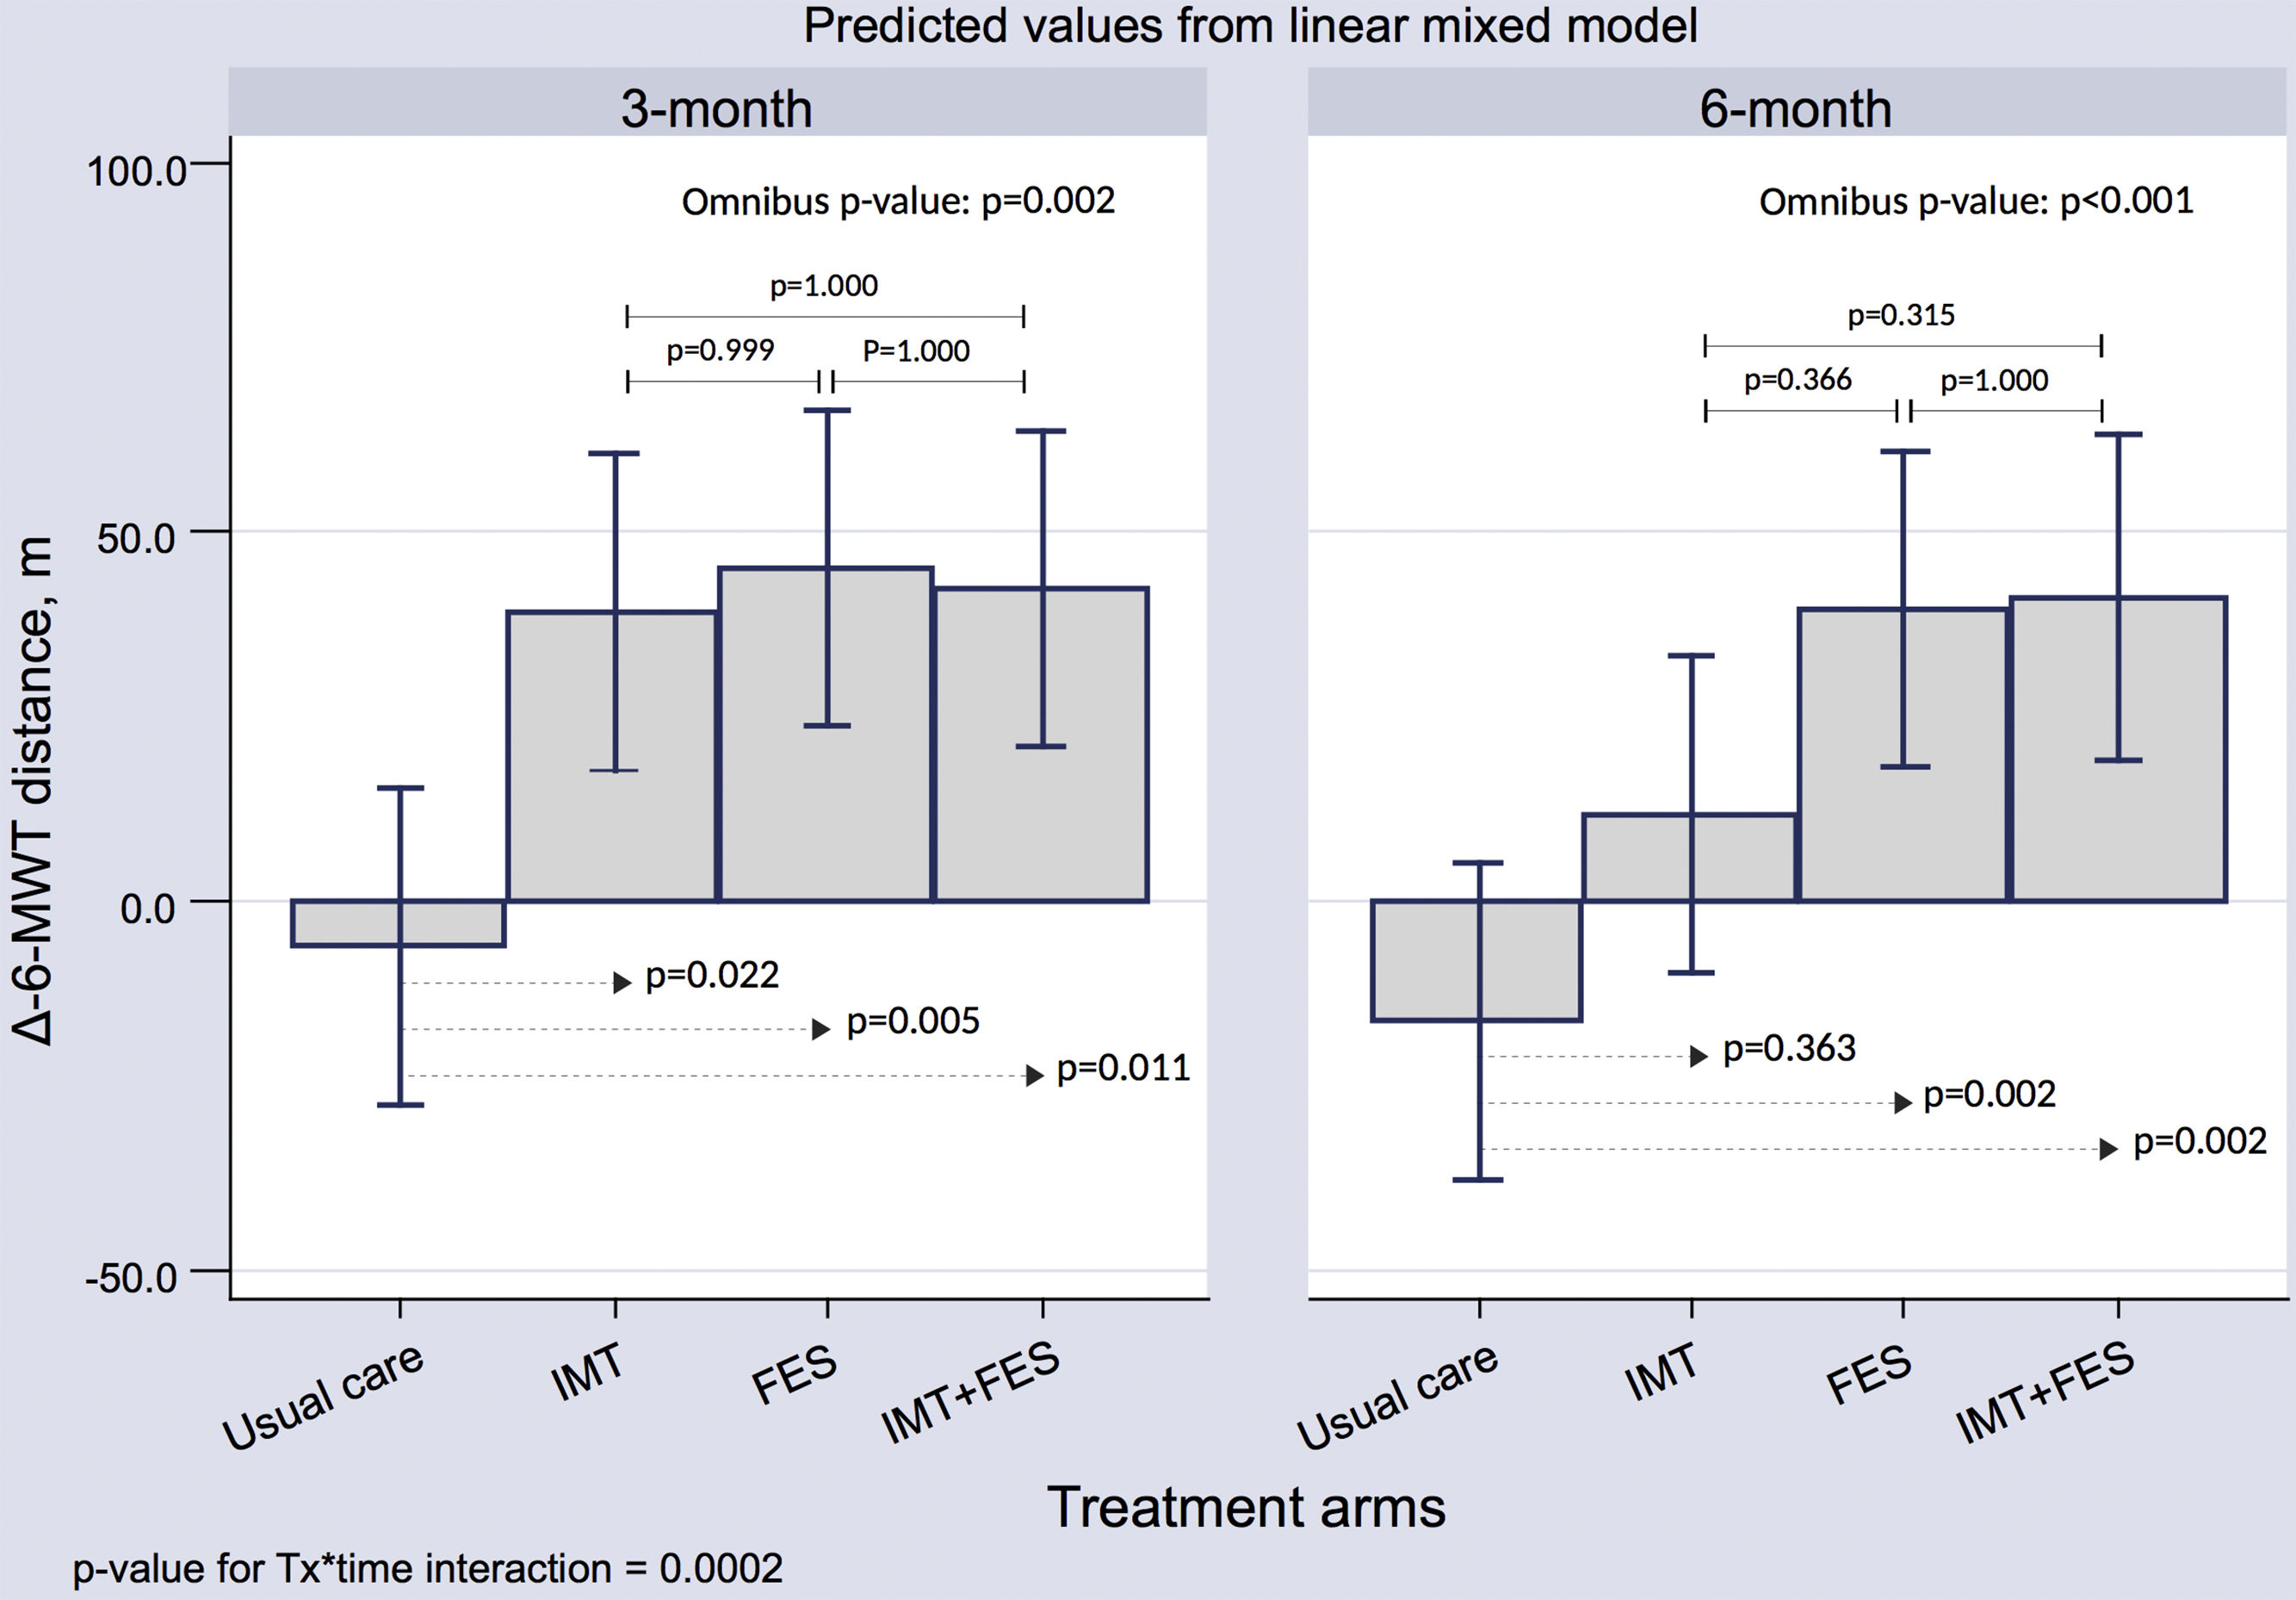
6-minute Walk TestThere was a significant improvement in the distance walked at the 3-month visit for the 3 active arms compared with UC (P < .05 for all). At 6 months, this beneficial effect persisted for the FES and IMT + FES groups ().
SafetyAt the 6-month follow-up, there were 3 deaths [IMT (n = 1), FES (n = 1) and IMT + FES (n = 1)] and 8 episodes of acute decompensated heart failure [UC (n = 4), IMT + FES (n = 2) and IMT (n = 2). There were no significant differences among treatment groups for the composite of death and acute decompensated heart failure (P = .44).
DISCUSSIONIn this randomized controlled study, the 3 active physical therapy interventions (IMT, FES, and IMT + FES) resulted in substantial improvement in peak VO2 and QoL at 12 weeks. The effect on peak VO2 decreased in magnitude at 24 weeks but remained significant for all active arms. The beneficial effect on QoL persisted at 24 weeks for the IMT group only. No sizable changes were found for the echocardiographic indices and biomarkers that were tested as endpoints. To our knowledge, TRAINING-HF is the first trial of patients with HFpEF to evaluate the effect of FES, IMT, and their combination on maximal functional capacity in a short and mid-term timeframe. Overall, our results highlight the efficacy of IMT, FES, and their combination to improve functional capacity in patients with HFpEF.
Physical Therapies in Heart Failure With Preserved Ejection FractionPhysical ExerciseHFpEF patients are usually older, predominantly female, with a high prevalence of comorbid cardiovascular1,2,21 and noncardiovascular conditions such as obesity, balance instability, and/or orthopedic limitations.21 This plethora of comorbidities plays an important role in promoting inactivity, deconditioning, and muscle wasting,22 which ultimately severely impairs the functional capacity of these patients.23 Aerobic exercise training can significantly improved the functional capacity in sexagenarian and obese patients with HFpEF.15 However, the feasibility of conventional exercise-based cardiac rehabilitation programs in older patients with advanced HFpEF is more questionable; indeed, data from current heart failure registries have shown that these patients are less likely to receive referrals to exercise-based cardiac rehabilitation programs after a heart failure admission.24
Inspiratory Muscle TrainingIn a previous pilot study of 26 patients with symptomatic HFpEF,16 our group found that a low-intensity IMT protocol was associated with a significant improvement in exercise capacity and QoL. The results of the present study not only confirm prior findings (at 3 months the magnitude of Δ-peak VO2 was similar between the 2 studies [+2.9 and 2.7mL/min/kg]), but expand the benefits of a 6-month follow-up. Interestingly, the magnitude of the beneficial effect of IMT on peak VO2 was comparable to those found for patients with heart failure with reduced ejection fraction.25–27
Functional Electrical StimulationTo date, only 1 randomized trial has analyzed the effects of this passive intervention in HFpEF patients.17 Karavidas et al.17 included 30 patients with a mean age of 69 ± 8 years, showing that FES improved functional capacity (evaluated by distance in the 6-minute walk test), QoL, and endothelial function with no changes in levels of biomarkers or in diastolic parameters at 6 weeks. Our results are in line with those findings, but also expand the functional benefits of FES to an older and more severe subset of patients with HFpEF. As has been reported for IMT, the magnitude of functional improvement found in both trials agreed with results reported in patients with heart failure with reduced ejection fraction treated with the same FES modality (short duration program, with a total stimulation time < 30h).28
Combined Physical Therapies (IMT + FES)The combined protocol improved peak VO2 during the follow-up but was not superior to the IMT or FES program alone. This lack of incremental effect suggests that, in HFpEF patients, there might be a limited margin of improvement from these types of protocols. Thus, we postulate that once this threshold is reached with either intervention (IMT or FES), no additional benefit can be obtained by combining them.
Biological PlausibilityAlthough it was not the aim of this study to analyze the physiological mechanisms underlying the effects of these physical therapies, several potential mechanisms have been postulated to explain the beneficial effects of IMT and FES on the functional capacity of HFpEF patients. They include: a) a delay in the development of diaphragmatic fatigue, which leads to a reduction in the recruitment of accessory respiratory muscles and, ultimately, to an improvement in ventilatory efficiency26,29; b) attenuation of the exercise pressor reflex in skeletal muscle30; c) increased muscle strength, muscle mass, and improvement in the aerobic-oxidative capacity14,31; and d) improvement of endothelial function.17
Interestingly, no structural and/or functional cardiac changes were documented for IMT or FES in the treatment of patients with HFpEF that could explain their beneficial effect.16,17 We also could not document substantial changes in the E/E′ ratio, left atrial volume index, natriuretic peptides, and CA125 (a marker of congestion) in this study, despite the improvement in exercise capacity and QoL. Extra-cardiac effects not directly related to improvement in cardiac function may play an important role in the beneficial effect of these interventions.
Clinical ImplicationsBoth IMT and FES are simple, low-cost, and harmless interventions that could be implemented in home-based exercise programs after a short training period. According to our findings, home-based IMT and FES programs are suitable, feasible, and effective alternatives for improving exercise capacity and QoL in patients with HFpEF, and may serve as “bridge therapies” to conventional exercise-based cardiac rehabilitation programs.
Study LimitationsSeveral limitations must be addressed. First, as a single center study, the generalizability of our results to other populations may be limited. Second, it is possible that a low statistical power may explain the negative results of the interventions on echocardiographic and cardiac biomarker endpoints. Third, the applicability of our results cannot be directly extrapolated to patients with milder forms of the disease. Fourth, in patients allocated to active arms, we cannot rule out a placebo effect in some endpoints such as QoL. Finally, the long-term (> 24 weeks) functional and clinical effects of FES and IMT were not assessed.
Additionally, although some variables–as a part of baseline characteristics–showed a trend toward being statistically different among the treatment groups, we opted not to include them in any of the outcome analyses for the sake of preventing overfitting of the model.
CONCLUSIONsIn this randomized controlled study, a 12-week IMT, FES, or IMT + FES intervention in HFpEF patients with reduced aerobic capacity was associated with significant improvement in exercise capacity and QoL. Further studies are needed to confirm these results and elucidate the underlying pathophysiological mechanisms responsible for these benefits. These 2 physical therapy interventions may become standard treatments for HFpEF patients.
FUNDINGThis work was supported in part by grants from: Sociedad Española de Cardiología, Investigación Clínica en Cardiología, Grant SEC 2015; CIBERCV 16/11/00420, 16/11/00403; FEDER and PIE15/00013.
CONFLICTS OF INTERESTNone declared.
- -
Although HFpEF has become the most prevalent form of heart failure in developed countries, there is currently no evidence-based effective therapy for this disease.
- -
The hallmark clinical feature of HFpEF is a severe reduction in functional capacity, which limits patients’ activities of daily living and is an important determinant of the poor prognosis and QoL.
- -
Physical therapies such as IMT and FES have shown improvement in exercise capacity and QoL in heart failure with reduced ejection fraction patients; however, there is little evidence supporting their feasibility and clinical usefulness in HFpEF.
- -
This is the first trial of patients with HFpEF to evaluate the effect of FES, IMT, and their combination on maximal functional capacity in a short and mid-term timeframe.
- -
Overall, our results highlight the efficacy of IMT, FES, and their combination to improve functional capacity and QoL in patients with HFpEF.
- -
Both IMT and FES are simple, low-cost, and harmless interventions that could be implemented in home-based exercise programs.
- -
Home-based IMT and FES programs are suitable, feasible, and effective alternatives in patients with HFpEF, and may serve as “bridge therapies” to conventional exercise-based cardiac rehabilitation programs.