
There is extensive controversy exists on whether cardiac resynchronization therapy corrects electrical or mechanical asynchrony. The aim of this study was to determine if there is a correlation between electrical and mechanical sequences and if myocardial scar has any relevant impact.
MethodsSix patients with normal left ventricular function and 12 patients with left ventricular dysfunction and left bundle branch block, treated with cardiac resynchronization therapy, were studied. Real-time three-dimensional echocardiography and electroanatomical mapping were performed in all patients and, where applicable, before and after therapy. Magnetic resonance was performed for evaluation of myocardial scar. Images were postprocessed and mechanical and electrical activation sequences were defined and time differences between the first and last ventricular segment to be activated were determined. Response to therapy was defined as a reduction in left ventricular end-systolic volume ≥ 15% after 12 months of follow-up.
ResultsGood correlation between electrical and mechanical timings was found in patients with normal left ventricular function (r2 = 0.88; P = .005) but not in those with left ventricular dysfunction (r2 = 0.02; P = not significant). After therapy, both timings and sequences were modified and improved, except in those with myocardial scar.
ConclusionsDespite a close electromechanical relationship in normal left ventricular function, there is no significant correlation in patients with dysfunction. Although resynchronization therapy improves this correlation, the changes in electrical activation may not yield similar changes in left ventricular mechanics particularly depending on the underlying myocardial substrate.
Keywords
Cardiac resynchronization therapy (CRT) aims to normalize electromechanical abnormities in order to improve left ventricular (LV) performance. However, up to one third of these patients do not respond to CRT, which underscores the lack of understanding of the complex relationship between LV electrical and mechanical activation, especially in dilated, dysfunctional hearts. Some studies have shown that QRS duration is a poor marker of mechanical asynchrony1,2 and analysis of mechanical dyssynchrony, based on imaging, also has not delivered consistent and widely applicable results.3 On the other hand, mechanical dyssynchrony does not necessarily correlate with electrical dyssynchrony as defined by QRS width.4,5 Similar patterns in the surface electrocardiogram (ECG) show different electrical or mechanical sequences of activation.6,7 Hence, a complex interplay might exist between electrical activation and mechanical events in patients with heart failure and LV dysfunction. The present study aimed to determine whether there is a correlation between electrical and mechanical sequences and whether myocardial scar has any relevant impact. We hypothesized that integrating mechanical, structural and electrical imaging could lead to a better understanding of the response to CRT and potentially to an improved selection of candidates for CRT.
To this aim, we used invasive endocardial electroanatomical maps and real-time three-dimensional echocardiography (RT3DE) to characterize the relationship and correlation of electrical and mechanical activation of the LV in different subsets of patients and attempted to determine the impact of CRT. Accordingly, this analysis could be considered as a pilot study to validate the use of RT3DE methods to evaluate mechanical motion time and correlate it to electrical time, and its potential role in predicting and improving understanding of the response to CRT.
METHODSPatient PopulationThe present study included 6 patients recruited from a population undergoing catheter ablation of lone paroxysmal atrial fibrillation (group I), with no structural heart disease and with normal LV systolic function and a QRS duration < 120ms on the surface ECG, and 12 patients with LV systolic dysfunction undergoing CRT implantation (group II), selected according to the currently accepted guidelines: heart failure, LV ejection fraction < 35%, and a wide QRS (> 120ms) on the surface ECG.8 All patients in both groups underwent RT3DE to assess the LV mechanical motion sequence, as well as endocardial electroanatomical mapping to evaluate the LV electrical activation sequence. The study protocol was approved by the hospital's ethics committee and was conducted according to the Helsinki Declaration of Ethical Principles for Medical Research Involving Human Subjects. Written informed consent was obtained from all participants.
Cardiac Resynchronization TherapyPatients with LV dysfunction (group II) were implanted with a CRT device. Leads were positioned at the right ventricular apex and, if the patient was in sinus rhythm, right atrial appendage. The LV lead was positioned in the lateral or posterolateral LV wall through the coronary sinus. All leads were implanted transvenously.
All devices were optimized based on an ECG-based method as previously described.9
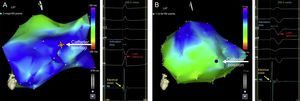
Endocardial Electroanatomical Left Ventricular MappingStudies were performed during atrial fibrillation ablation (group I) or before and after CRT implantation (group II). A 4-mm-tipped mapping catheter (Navistar, Biosense-Webster Inc.) was advanced into the LV through the retrograde aortic approach. During sinus rhythm, the LV was mapped to achieve a mean (standard deviation [SD]) of 37 points (SD, 15 points) in each map. In CRT patients (group II), maps were obtained with the device inactivated (Off) and once the interventricular (VV) interval was optimized (Optimized). Activation time at each point was determined as the time interval between the peak of the R wave from limb leads (or augmented limb leads) and the peak in the bipolar electrogram, which was associated with the steepest negative intrinsic deflection catheter tip. Figure 1 shows the electroanatomical maps of a patient in group I and from another in group II.
 from a patient with a normal left ventricular function (group I) (A) and from a patient with left ventricular dysfunction (group II) (B); traces at the right side of each panel represent the electrical information from augmented limb leads and from an endocardial bipolar catheter. Cold (blue-green) colors represent subsequently activated segments and warm (orange-red) colors represent the first areas to be activated. The activation time is defined as the time difference between the reference (aVL, blue arrow) and the electrical onset of M1-M2 endocardial signal (yellow arrow). The position of the tip of the catheter is represented by a larger point highlighted in the left ventricular.")
Left ventricular endocardial electroanatomical map (anterolateral view) from a patient with a normal left ventricular function (group I) (A) and from a patient with left ventricular dysfunction (group II) (B); traces at the right side of each panel represent the electrical information from augmented limb leads and from an endocardial bipolar catheter. Cold (blue-green) colors represent subsequently activated segments and warm (orange-red) colors represent the first areas to be activated. The activation time is defined as the time difference between the reference (aVL, blue arrow) and the electrical onset of M1-M2 endocardial signal (yellow arrow). The position of the tip of the catheter is represented by a larger point highlighted in the left ventricular.
Once the full LV volume was reconstructed, the LV was divided into 16 segments (according to the American Heart Association LV segmentation) based on 3 anatomic reference landmarks (mitral valve, aortic valve, and LV apex). The LV endocardial breakthrough site was defined as the earliest activated LV site in the electroanatomical map. To obtain the sequence of electrical activation, activation times from all the points within each of the 16 LV segments were averaged. From this, we extracted: a) the sequence of electrical activation of 16 LV segments, and b) total activation time (ΔTe), defined as the time difference between the first and last activated LV points. The electrical propagation patterns were represented in classical LV “bull's-eye” plots by mapping every acquired point within the LV to a flattened ellipsoid (oriented based on the 3 reference points). For the visualization of the electrical activation sequence, “bull's-eye” plots were generated starting from the first point of activation until the last activated point, with a time step of 5ms.
Real Time Transthoracic Three-dimensional EchocardiographyRT3DE was performed using a commercially available ultrasound scanner equipped with an X3-1 matrix array transducer (IE33, Philips Medical Systems; Andover, Massachusetts, United States). Scans were performed before the ablation procedure in group I. In group II, RT3DE was performed before (Off) and 48h after CRT, once the VV interval was optimized optimized (Optimized).
Full volumes of the LV were obtained in all patients from the apical window. Depth was minimized to include only the whole LV. The mean frame rate used was 15 fps (SD, 3 fps). The off-line analysis was done using commercially available software (Qlab, version 7.1, Philips). A shell of the LV cavity was then created, providing time-volume data for the entire cardiac cycle. Finally, this volume was divided according to the 16-segmental volume, and the volume change during the cardiac cycle was obtained for each segment.
The segmental LV volume-time curves provided by RT3DE allowed identification of the time sequence of each LV segment to reach the minimum systolic volume.10,11 Therefore, from the analysis of RT3DE, we obtained: a) the sequence or spread of mechanical activation of 16 LV segments and b) the temporal spread of maximal mechanical motion (ΔTm), corresponding to the time difference between the first and the last LV segment to reach the minimum systolic volume.
The sequence of mechanical motion was also represented by “bull's-eye” plots. The mapping was performed using the LV segmentation obtained from the three-dimensional echocardiography analysis with QLab. For each patient, 12 time steps were generated, representing the total difference between the time to reach minimal volumes of the first and last segment.
Magnetic ResonanceCardiac magnetic resonance examinations were performed in all patients in a 1.5 T Signa magnetic resonance scanner (General Electric; Milwaukee, Wisconsin, United States) 72h before CRT device implantation. Delayed-enhancement images were obtained after bolus injection of 0.2 mmol/kg body weight gadodiamide (Omniscan®, GE Healthcare Buchler; Munich, Germany) using an inversion-recovery gradient echo sequence and optimizing the inversion time to null the myocardium. Delayed-enhancement was scored with a 3-point scale, as previously described elsewhere (0, none; 1, non-transmural, defined as involving < 50% of the myocardial width; and 2, transmural enhancement, defined involving ≥ 50% of the myocardial width).12 The presence, extent, and location of myocardial scar were also integrated in the “bull's-eye” representations of the electrical and mechanical data.
Follow-up of Cardiac Resynchronization Therapy PatientsPatients undergoing CRT were followed-up at the outpatient clinic at 12 months postimplantation. Patients underwent a comprehensive transthoracic echocardiogram, both at baseline and follow-up, using a commercially available system (Vivid 7, General Electric; Milwaukee, Wisconsin, United States). In each scan, LV volumes and LV ejection fraction were calculated from 4- and 2-chamber apical views by Simpson's rule.13 Response to CRT was defined by LV volumetric reverse remodeling, which was considered when LV end-systolic volume decreased by ≥15% at follow-up compared with baseline.14
Statistical AnalysisContinuous baseline variables are expressed as mean (SD) values or median [interquartile range], after checking for normality with the Shapiro-Wilks test, and tested by the unpaired Student t test or the Mann-Whitney U test or by the paired t test or Wilcoxon analysis, according to normality. Categorical variables were expressed as total number (percentages) and were compared between groups using the chi-square or Fisher's test when appropriate. Linear regression analysis was used to analyze the correlation between ΔTe and ΔTm. Statistical significance was defined at P < .05. All data were analyzed using the SPSS version 15.0 statistical package (SPSS Inc.; Chicago, Illinois, United States).
RESULTSPatients With Normal Left Ventricular Systolic FunctionClinical and echocardiographic baseline characteristics are shown in Table 1. All patients in group I had a QRS duration < 120ms on the surface ECG and showed a similar pattern of distribution of the electrical propagation. Earliest activation was mid-septal in most patients, with a first wave front through the anterior LV wall, and with the latest activated segments located in the inferoposterior basal LV walls. Regarding mechanical motion, a high synchronicity was found, with all the LV segments reaching the minimum systolic volume almost at the same time. The earliest contracted segments were septal and apical, while the posterior wall was the last (Figure 2). A high correlation was found between electrical and mechanical timings (ΔTe = 55 ms [SD, 14 ms] and ΔTm = 58 ms [SD, 18 ms]) (r2 = 0.88; P = .005) (Figure 3).
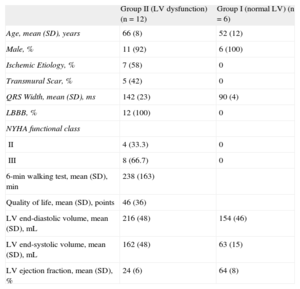
Clinical and Echocardiographic Baseline Characteristics of the Study Population
| Group II (LV dysfunction) (n = 12) | Group I (normal LV) (n = 6) | |
| Age, mean (SD), years | 66 (8) | 52 (12) |
| Male, % | 11 (92) | 6 (100) |
| Ischemic Etiology, % | 7 (58) | 0 |
| Transmural Scar, % | 5 (42) | 0 |
| QRS Width, mean (SD), ms | 142 (23) | 90 (4) |
| LBBB, % | 12 (100) | 0 |
| NYHA functional class | ||
| II | 4 (33.3) | 0 |
| III | 8 (66.7) | 0 |
| 6-min walking test, mean (SD), min | 238 (163) | |
| Quality of life, mean (SD), points | 46 (36) | |
| LV end-diastolic volume, mean (SD), mL | 216 (48) | 154 (46) |
| LV end-systolic volume, mean (SD), mL | 162 (48) | 63 (15) |
| LV ejection fraction, mean (SD), % | 24 (6) | 64 (8) |
LBBB, left bundle branch block; LV, left ventricular, NYHA, New York Heart Association; SD, standard deviation.

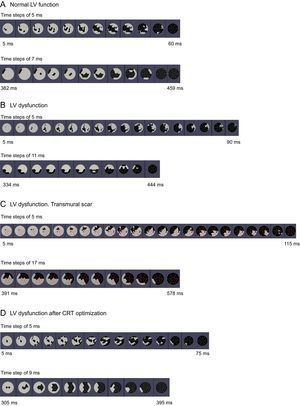
Sequences of electrical activation (upper “bull's-eye” maps) from the electrical onset (left) to the end (right) and maximal mechanical motion (lower “bull's-eye” maps) from the first segment (left) to the last segments to reach minimal volume from a representative patient from each group: A: normal left ventricular systolic function. B: left ventricular systolic dysfunction without transmural scar and with anterolateral propagation line block. C: left ventricular systolic dysfunction with transmural scar and with posterior line block. D: same patient as in B, after cardiac resynchronization therapy. CRT, cardiac resynchronization therapy; LV, left ventricular. Steps: time between images. Red lines represent left ventricular segments with transmural myocardial scar.
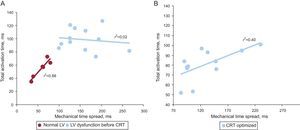
 and maximal mechanical motion (mechanical time spread) for patients with normal left ventricular systolic function and with left ventricular dysfunction (before cardiac resynchronization therapy) (A) and for patients with left ventricular dysfunction after optimized interventricular interval programming of the device (B). CRT, cardiac resynchronization therapy; LV, left ventricular.")
Linear regression plots between the temporal intervals of electrical activation (total activation time) and maximal mechanical motion (mechanical time spread) for patients with normal left ventricular systolic function and with left ventricular dysfunction (before cardiac resynchronization therapy) (A) and for patients with left ventricular dysfunction after optimized interventricular interval programming of the device (B). CRT, cardiac resynchronization therapy; LV, left ventricular.
Clinical and echocardiographic baseline characteristics are shown in Table 1. Mean age was 66 years (SD, 8 years) and mean LV ejection fraction 24% (SD, 6%). Patients with LV systolic dysfunction (group II), all with left bundle branch block (LBBB) on the surface ECG, showed longer delays both in LV electrical and mechanical sequences compared with patients with normal LV systolic function (Table 2). No correlation was found between electrical and mechanical timings in these patients (Figure 3). Similarly, no concordance was found between the sequence of electrical activation and mechanical motion (Figure 2). Wide variability existed in the first and last LV segments to be mechanically contracted. For electrical activation, patterns were more similar, with the septum the first and the posterolateral wall the last LV segments to be activated in most cases. However, in 7 patients (58%), a clear line of electrical conduction block could be observed (mainly in the lateral wall) together with a later reonset in the spread of electrical activation. All activation and mechanical sequences for each individual patient before and after therapy are shown in the supplementary material.
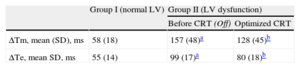
Electrical Activation and Mechanical Motion Timings
| Group I (normal LV) | Group II (LV dysfunction) | ||
| Before CRT (Off) | Optimized CRT | ||
| ΔTm, mean (SD), ms | 58 (18) | 157 (48)a | 128 (45)b |
| ΔTe, mean SD, ms | 55 (14) | 99 (17)a | 80 (18)b |
ΔTe: electrical activation time; ATm: maximal mechanical spread time; CRT: cardiac resynchronization therapy; LV, left ventricular; Off, device inactivated.
After CRT activation, the programming of the VV interval was optimized, resulting in 8 patients (66.6%) in simultaneous biventricular pacing configuration (VV = 0ms) and 4 patients (33.3%) in LV preactivation (VV = –30 ms). Both electrical and mechanical timings and sequences of activation were modified in all patients after CRT by decreasing time delays and changing the mechanical and electrical onset (Table 2). After this optimization, a slight improvement in the correlation between electrical and mechanical activation times was observed (r2 = 0.40; P = .02) (Figure 3B), suggesting restoration of at least partial synchrony. With optimized CRT, the onset of electrical propagation for patients with LV preactivation (VV = –30ms, n = 4) was at the lateral LV wall, while the septum was the last segment to be activated in all patients. Patients with an optimized simultaneous biventricular pacing (n = 8) showed different patterns (Figure 2D and Figures 1-8 from supplementary material). Analyzing the pattern of the maximal mechanical motion spread with the optimized device, there was also wide variation among patients in both the first and last segments to reach the maximum motion (Figure 2D). Further information is provided in the supplementary material.
Impact of Scar TransmuralityFive patients showed transmural and 2 patients nontransmural scars, all of them of ischemic origin. No delayed enhancement was found in the remaining patients with ischemic and those with nonischemic LV dysfunction. Electrical and mechanical timings did not differ in patients with LV dysfunction (group II), based on whether they had transmural or nontransmural scars (time of electrical activation 94 ms [SD, 15 ms] vs 106 ms [18 ms]; P = not significant, and time of mechanical motion spread 160 ms [SD, 18 ms] vs 154 ms [35 ms]; P = not significant, respectively). The location of the transmural scar was at the lateral wall in 2 patients, at the posterolateral wall in another 2 and at the posterior wall in 1 patient. After optimized CRT, in the group of patients with a transmural scar, there were no significant changes in the timings of electrical and mechanical activation (Figure 4). However, in the group of patients without transmural scar, significant reductions were observed in both electrical and mechanical timings after optimized VV programming. Although the onset of the electrical activation was clearly located at the lateral LV wall (85%), wide variability existed in the last electrically activated LV segment (Figures 1-12 from supplementary material).
 and electrical (left) activation times before and after optimized cardiac resynchronization therapy. Upper panels show data for all patients. Middle panels show changes in time delays for patients without a transmural scar (ie, those with nontransmural scar or no scar). Lower panels show changes in time delays for patients with a transmural scar. CRT, cardiac resynchronization therapy. Data are expressed as mean (standard deviation). * P < .05 left ventricular dysfunction after optimized cardiac resynchronization therapy vs left ventricular dysfunction before cardiac resynchronization therapy.")
Mechanical (right) and electrical (left) activation times before and after optimized cardiac resynchronization therapy. Upper panels show data for all patients. Middle panels show changes in time delays for patients without a transmural scar (ie, those with nontransmural scar or no scar). Lower panels show changes in time delays for patients with a transmural scar. CRT, cardiac resynchronization therapy. Data are expressed as mean (standard deviation).
* P < .05 left ventricular dysfunction after optimized cardiac resynchronization therapy vs left ventricular dysfunction before cardiac resynchronization therapy.
At follow-up, there were 8 responders (66%) and 4 (34%) nonresponders, according to the criteria of an LV end-systolic volume reduction ≥ 15% at follow-up compared with baseline. Responders to CRT showed a mean increase of 17% (SD, 4%) in LV ejection fraction and a decrease of 44% (SD, 7%) in LV end-systolic volume, while in nonresponders, the increase in LV ejection fraction and decrease of LV end-systolic volume were 3% (SD, 3%) and 1.5% (SD, 3.6%), respectively. Responders showed an immediate decrease in both electrical activation and mechanical motion timings with CRT, while nonresponders showed a significant increase in maximal mechanical motion timings (ΔTm) despite nonsignificant changes in the electrical activation time (ΔTe) (Figure 5). Most responders (87%) had no transmural scar in the magnetic resonance imaging prior to CRT, whereas all nonresponders had a transmural scar.
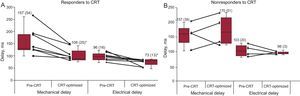
 and nonresponders (B). CRT: cardiac resynchronization therapy. Data are expressed as mean (standard deviation). * P < .05 left ventricular dysfunction after optimized cardiac resynchronization therapy vs left ventricular dysfunction before cardiac resynchronization therapy.")
Changes in the timing of maximal mechanical motion and electrical activation after cardiac resynchronization therapy for responders (A) and nonresponders (B). CRT: cardiac resynchronization therapy. Data are expressed as mean (standard deviation).
* P < .05 left ventricular dysfunction after optimized cardiac resynchronization therapy vs left ventricular dysfunction before cardiac resynchronization therapy.
The main findings of this small observational study can be summarized as follows: a) there was a good correlation between the timing of the propagation of electrical activation and maximal mechanical motion, with similar patterns and sequences, in normally functioning LV; b) this correlation was lost in patients with LV dysfunction, indicating that mechanical contraction is determined not only by electrical activation but also by electromechanical coupling of the contractility and interactions of the segments; c) CRT partially restores this correlation, but to a lesser extent in patients with myocardial scar, and d) patients with transmural scar did not show significant improvements in the timings or patterns of electromechanical activation immediately after CRT, which was related to the long-term response (ie, they were more likely to be nonresponders).
Electrical and Mechanical Activation in Left Bundle Branch BlockPrevious LV endocardial electroanatomical mapping studies have demonstrated different electrical conduction patterns and activation sequences in the LV or in both the right and left ventricles in patients with dilated cardiomyopathy and LBBB15–18 and with similar LV activation times, such as those in the present study; in addition, CRT has been shown to decrease electrical activation time.19 In the present study, we also found electrical sequences similar to those reported in these studies. Additionally, we found that some patients exhibited a line of block with a later sudden reonset of rapid electrical propagation; all of these patients responded to CRT. In contrast, some patients (n = 5) showed a more stepped propagation and a more posterior line of block; 4 of these patients had a transmural scar located around the posterolateral wall. Auricchio et al17 previously demonstrated the presence of this block line in most of their population with LBBB and described how the block lines are shifted after ventricular pacing from the coronary veins and the right ventricular apex. We have confirmed these previous findings and additionally have shown how the pattern is changed after CRT.
Few studies have analyzed the sequence of mechanical spread using echocardiography. De Boeck et al20 evaluated mechanical activation patterns based on two-dimensional strain, reconstructing three-dimensional geometry from two-dimensiona echocardiography and analyzing mechanical activation and LV deformation. These authors also observed different patterns of mechanical activation in patients with LV systolic dysfunction and LBBB compared with those with normal ventricles. On the other hand, the relationship between LV electrical activation and maximal mechanical contraction among patients with systolic LV dysfunction and LBBB has been scarcely studied.15,21 Fung et al15 evaluated the relationship between LV electrical activation from noncontact mapping and mechanical dyssynchrony using tissue Doppler imaging in patients with LV systolic dysfunction and LBBB. They found a high correlation between LV electrical activation time and an index of mechanical synchrony among those patients with a line of conduction block. However, in those patients with a homogeneous conduction and no line of conduction block, there was no correlation between these electrical and mechanical activation timings. After 3 months of follow-up with CRT, only those patients with a line of conduction block showed significant improvements in clinical parameters and LV systolic function.
Impact of the Underlying SubstrateAfter optimized CRT, the timings of the spread of both electrical and mechanical activations were significantly reduced. Significant reductions in time delays after CRT were only observed in patients without a transmural scar in the LV, whereas timings remained mainly unchanged in patients with a transmural scar (Figure 4). Additionally, patients showing immediate reductions in electrical and mechanical timing, most of them (87%) without transmural scar, exhibited a positive response to CRT at 12 months’ follow-up. This is in line with the findings of Leclercq et al,22 who showed in an animal experiment study that mechanical resynchronization seems most important for functional improvement, rather than electrical resynchronization and is also in keeping with the lower response to CRT observed in ischemic patients,23,24 directly related to the extent of viable myocardium and the presence of transmural scar.24
Indeed, 80% of patients with transmural scar did not response to CRT and their timings did not change significantly after CRT. The extent of the scar, as well as the precise location of the lead related to the scar, also influence the effect of CRT, because implantation of the lead on a scarred myocardial segment can lead to ineffective activation and stimulation. In this sense, RT3DE has already demonstrated its potential in evaluating the optimal lead positioning and the its effect on CRT response.25
LimitationsThe main limitation of this study is the small sample size of the population; however, considering the complexity of the tests included (electroanatomical mapping), we believe it is sufficient to generate a hypothesis of knowledge, even though the conclusions might not be powerful enough to change patient management. Consequently, confirmation of our findings is required in larger studies.
Inadequate acquisition of ventricular geometry determined by the number of points registered in the electroanatomical studies may have limited our analysis of LV activation. Regarding RT3DE, the low temporal resolution may have limited the image quality and therefore the precise analysis of the sequence of mechanical activation; additionally, the assessment of mechanical motion by RT3DE relies on changes in segmental volumes, and therefore motion might not correspond to a true myocardial contraction but rather to passive motion due to the tethering of adjacent segments. Further studies based on three-dimensional strain26,27 and not on displacement or volume changes could help to better understand the sequence of mechanical contraction, particularly in patients with myocardial scar. Despite these limitations, we believe that changes in segmental volumes provide a useful tool to evaluate segmental motion sequences in terms of ventricular ejection.10,28 In addition, we did not consider the area of the scar relative to the remaining myocardial tissue and the location of the lead according to the scar.
Finally, definition of response to CRT, which still remains controversial29, was based on LV volumetric reverse remodeling and did not include other comprehensive variables.
CONCLUSIONSWe show a widely variable relationship between sequences and timings of LV electromechanical coupling in patients with LV systolic dysfunction, despite a similar pattern on the surface ECG (LBBB). Additionally, the potential correction of this relationship with CRT depends on the underlying myocardial substrate. Normalization of the spread of mechanical motion through the correction of the sequence of electrical activation is a requirement for response to CRT; however, this varies according to the presence of myocardial scar. Indeed, partial electrical resynchronization was observed in responders and even in some nonresponders to CRT while mechanical resynchronization only occurred in responders. Avoiding scarred myocardium and a better understanding of the electrical activation sequence in each individual patient may lead to better response to CRT in the future. Larger, prospective studies combining these imaging modalities are necessary.
FUNDINGThe study was supported in part by grants from the CENIT (Consorcios Estratégicos Nacionales en Investigación Técnica) program of the Centro de Desarrollo Tecnológico Industrial (cvREMOD [Convergencia de Tecnologías Médicas para la Gestión Integral del Remodelado Cardiovascular] project), the Spanish Society of Cardiology (2010) and the Spanish Government, REDINSCOR RD06/0003/0008
CONFLICT OF INTERESTNone declared.
We are indebted to Gemma Pros and Neus Portella for secretarial assistance and to Elaine Lilly for editorial collaboration.