There are models for cardiovascular risk prediction in the general population, but the prediction of risk in postmenopausal women has not been specifically studied. This study aimed to determine the association of lifestyle habits and chronic diseases with cardiovascular risk in menopausal women, as well as to build a risk scale.
MethodsRetrospective population-based cohort study using data from the 2011 National Health Survey of Spain as a data source, Women ≥ 50 years were included. The characteristics that best defined the life habits of the study women were collected, as well as their health status and self-reported medical history at the time of the survey. Follow-up data on all-cause mortality were obtained from participants from 2011 to 2017.
ResultsA total of 5953 women ≥ 50 years of age were included, with a mean age of 66.4 ± 11.4 years. The incidence of cardiovascular mortality in the follow-up period was 4%. Vegetable consumption less than 1 time/week (HR, 1.758), smoking (HR, 1.816) or excess hours of sleep (≥ 9h/day, HR, 1.809), or o have main daily activity sitting most of the time (HR, 2.757) were related to cardiovascular mortality. The predictive model presents an honest C-index in test sample of 0.8407 (95%CI, 0.8025-0.8789).
ConclusionsLife habits such as the consumption of vegetables, daily main activity, sleeping hours or smoking are risk factors for cardiovascular mortality of great relevance among menopausal women. A simple 6-year self-reported risk scale with high predictive capacity is provided.
Keywords
Cardiovascular disease (CVD) is the leading cause of morbidity and mortality worldwide.1 Guidelines exist for the primary prevention of CVD and their aim is to establish recommendations to reduce risk,2 but there are considerable differences between men and women.3 According to data from the United States for the period 2013 to 2016, premenopausal women had lower rates of CVD than men of the same age, whereas postmenopausal women had higher rates.4 The difference was even greater for women in early menopause.5 Differences in health care are also a cause for concern. Because CVD presents differently in women, it is often diagnosed and treated later than in men, increasing the risk of poor outcomes.6
Many CV risk prediction models exist for the general population.7 While most do not account for the differential characteristics of women, a number of models in the United States have included female-specific risk factors.8,9
It has been shown that women with diabetes have a 58% greater risk of coronary heart disease and a 13% greater risk of all-cause mortality than men with the same condition.10 Similarly, hyperlipidemia appears to be associated with an increased CVD risk in postmenopausal women.11 No clear associations, however, have been identified for other classic risk factors such as smoking and alcohol consumption in this population.12 Obesity13 and sedentary behavior may increase the risk of CVD and hospitalization for heart failure in women after menopause.14
The aim of this study was to determine the influence of lifestyle habits and chronic disease on increased CV risk in a representative sample of women of menopausal age from a national health survey in Spain and to use our findings to build an easy-to-apply risk scale.
MethodsWe performed a population-based retrospective observational cohort study using data from the 2011 National Spanish Health Survey (ENSE11) conducted by the National Statistics Institute (INE) between July 2011 and June 2012. This survey is representative of all residents aged over 18 years in Spain and the sample was obtained using a complex stratified 3-stage design. The study was conducted in accordance with the principles of the Declaration of Helsinki and was approved by the Office of Responsible Research at Universidad Miguel Hernández in Elche, Alicante.
We included women aged 50 years and older and excluded those with missing data for any of the study variables. Information was collected on sociodemographic variables, the population characteristics that best defined the lifestyle habits of the women included, self-reported health status and medical history at the time of the survey, and mortality data for a 6-year follow-up period (2011-2017). Mortality data were provided by the INE, which used probabilistic record linkage to match data from the ENSE11 to causes of death from the national death registry. We distinguished between mortality due to CVD (deaths due to diseases of the circulatory system [codes 100-199 in the 10th revision of the International Classification of Diseases]) and mortality due to other causes.
The following exposure variables were extracted from the ENSE11:
- •
Sociodemographic variables: age, place of residence (autonomous community), social class based on occupation of reference person,15 country of birth, civil status, level of education, and net monthly household income.
- •
Lifestyle variables: smoking, exposure to environmental smoke, alcohol consumption, hours of daily sleep, type of physical activity in main daily activity, frequency of physical activity in leisure time, dental hygiene, and consumption of fruit, vegetables, pulses, dairy products, sweet products, and fast food.
- •
Health status: body mass index (BMI), use of a hearing aid, chronic or long-term diseases, current or past history of hypertension, myocardial infarction, other heart diseases, varicose veins, osteoarthritis, chronic neck pain, chronic lower back pain, allergies, asthma, chronic obstructive pulmonary disease, diabetes mellitus, stomach ulcer, urinary incontinence, high cholesterol, cataracts, chronic skin diseases, constipation, cirrhosis, migraine, hemorrhoids, osteoporosis, thyroid problems, stroke, malignant tumor, chronic depression, chronic anxiety, permanent injury due to an accident, or mental health.
- •
Self-reported health and health-related quality of life: self-perceived health in the past 12 months, self-rated health on the 5-level EQ-5D (EQ-5D-5L) visual analog scale (VAS), and limitations in activities of daily living due to health problems in the past 6 months or longer.
- •
Use of health services: admission to hospital in the past 12 months, admission to a day hospital in the past 12 months, emergency care in the past 12 months, primary care visit in the past month, specialist consultation in the past month, physical therapy in the past year, psychology consultation in the past year, radiography in the past year, computed tomography in the past year, ultrasound in the past year, magnetic resonance imaging in the past year, and vaccination in the last flu vaccination campaign.
The items within each category are shown in the .
Statistical analysisFrequencies of all qualitative variables were calculated for the descriptive analysis. Factors associated with CV mortality were analyzed using contingency tables and the chi-square test. To estimate the magnitude of CV risk over 6 years, we built multivariate Cox models that adjusted for competing risks between CV mortality and mortality due to other causes using the approach of Putter et al.16 applied by Moore.17 Hazard ratios (HRs) with 95% confidence intervals (95%CIs) were calculated. The most parsimonious model was selected using the Akaike Information Criterion with forward stepwise selection. The proportional hazards assumption of the model was tested, as was goodness of fit using the likelihood ratio test (LRT). The predictive performance of the model was tested using the C index and 95%CI. The model was built using a random sample of 70% of the original sample and validated using the remaining 30%. The results of the optimal model were used to build a 6-year CV mortality risk scale following the approach described by Sullivan et al.18 To obtain a representative sample of the Spanish population within the complex sampling approach, we applied the raising factor of the sample divided by its mean as a weighting factor; this method provides weights centered around the mean.19 The analyses were performed in SPSS v.21
ResultsOf the 21 007 individuals surveyed in the ENSE11, 6223 were women older than 50 years; 270 (4.3%) were excluded due to missing values, leaving 5953 for analysis. Their mean age was 66.4±11.4 years (range, 50-103 years). The number and percentage of women in each of the lifestyle and chronic CVD-related disease categories are shown in table 1, together with cumulative rates for CV mortality and mortality due to other causes. The estimated rate calculated for the 6 years of follow-up was 4% (n=239) for CV mortality and 7% (n=419) for mortality due to other causes. Mean age at death was 83.5±8.6 years for women who died of CVD and 78.6±10.8 years for those who died of another cause. Cumulative CV mortality and mortality due to other causes according to sociodemographic characteristics, other chronic diseases, self-rated health and quality of life, and use of health care services are shown in . The mean EQ-5D-5L VAS score for self-rated health was 67.5±20.9 (50.3±21.9) for women who died of CVD and 52.2±23.0 for those who died of another cause.
Cumulative incidence of cardiovascular mortality and morbidity due to other causes according to lifestyle habits and chronic disease
| Total | Alive | Died of cardiovascular disease | Died of another cause | ||||||
|---|---|---|---|---|---|---|---|---|---|
| No. | % | No. | % | No. | % | No. | % | P | |
| Body mass index | <.001 | ||||||||
| Normal | 1983 | 33.3 | 1814 | 91.5 | 54 | 2.7 | 115 | 5.8 | |
| Overweight | 1874 | 31.5 | 1713 | 91.4 | 56 | 3.0 | 105 | 5.6 | |
| Obesity | 1189 | 20.0 | 1060 | 89.1 | 49 | 4.1 | 80 | 6.8 | |
| DK/DA | 907 | 15.2 | 709 | 78.1 | 80 | 8.8 | 118 | 13.0 | |
| Smoking | <.001 | ||||||||
| Never | 4497 | 75.5 | 3897 | 86.6 | 227 | 5.0 | 374 | 8.3 | |
| Exsmoker | 693 | 11.6 | 663 | 95.7 | 9 | 1.3 | 21 | 3.0 | |
| Smoker | 763 | 12.8 | 735 | 96.5 | 3 | 0.4 | 24 | 3.1 | |
| Exposure to environmental smoke | <.001 | ||||||||
| Never | 5033 | 84.5 | 4426 | 87.9 | 220 | 4.4 | 387 | 7.7 | |
| <1 h/d | 370 | 6.2 | 346 | 93.4 | 10 | 2.6 | 15 | 3.9 | |
| >1 h/d | 550 | 9.2 | 523 | 95.2 | 9 | 1.7 | 17 | 3.1 | |
| Alcohol | <.001 | ||||||||
| Does not drink | 4231 | 71.1 | 3663 | 86.6 | 205 | 4.9 | 363 | 8.6 | |
| Mean daily intake over a wk ≤20 g | 1549 | 26.0 | 1464 | 94.5 | 32 | 2.1 | 53 | 3.4 | |
| Mean daily intake over a wk ≤20 g | 173 | 2.9 | 169 | 97.4 | 1 | 0.8 | 3 | 1.9 | |
| Hours of sleep | <.001 | ||||||||
| >9 h/d | 386 | 6.5 | 247 | 64.0 | 64 | 16.6 | 75 | 19.4 | |
| 7-9 h/d | 3619 | 60.8 | 3324 | 91.8 | 105 | 2.9 | 191 | 5.3 | |
| <7 h/d | 1948 | 32.7 | 1725 | 88.6 | 70 | 3.6 | 153 | 7.8 | |
| Main daily activity | <.001 | ||||||||
| Sitting most of the day | 2339 | 39.3 | 1815 | 77.6 | 200 | 8.5 | 323 | 13.8 | |
| Standing most of the day | 3124 | 52.5 | 3002 | 96.1 | 36 | 1.2 | 86 | 2.7 | |
| Walking-tasks involving exertion | 490 | 8.2 | 478 | 97.6 | 2 | 0.5 | 9 | 1.9 | |
| Physical activity during free time | <.001 | ||||||||
| Sedentary behavior | 3025 | 50.8 | 2498 | 82.6 | 208 | 6.9 | 319 | 10.5 | |
| Occasional activity | 2358 | 39.6 | 2244 | 95.2 | 29 | 1.2 | 85 | 3.6 | |
| Frequent activity | 306 | 5.1 | 298 | 97.5 | 2 | 0.6 | 6 | 1.9 | |
| Sports training | 265 | 4.4 | 256 | 96.6 | 1 | 0.3 | 8 | 3.1 | |
| Fruit consumption | .229 | ||||||||
| Daily | 4591 | 77.1 | 4104 | 89.4 | 173 | 3.8 | 314 | 6.8 | |
| > 3 times/wk | 772 | 13.0 | 678 | 87.8 | 32 | 4.2 | 62 | 8.1 | |
| 1-2 times/wk | 370 | 6.2 | 325 | 87.9 | 19 | 5.0 | 26 | 7.1 | |
| <1 time/wk | 219 | 3.7 | 188 | 86.0 | 15 | 6.7 | 16 | 7.3 | |
| Consumption of vegetables | <.001 | ||||||||
| Daily | 3366 | 56.5 | 3037 | 90.2 | 119 | 3.5 | 210 | 6.2 | |
| > 3 times/wk | 1906 | 32.0 | 1687 | 88.5 | 79 | 4.1 | 141 | 7.4 | |
| 1-2 times/wk | 516 | 8.7 | 448 | 86.7 | 26 | 5.0 | 43 | 8.3 | |
| <1 time/wk | 164 | 2.8 | 124 | 75.5 | 15 | 9.1 | 25 | 15.4 | |
| Consumption of pulses | .004 | ||||||||
| Daily | 91 | 1.5 | 85 | 92.6 | 1 | 0.7 | 6 | 6.6 | |
| > 3 times/wk | 1383 | 23.2 | 1213 | 87.7 | 62 | 4.5 | 108 | 7.8 | |
| 1-2 times/wk | 3608 | 60.6 | 3240 | 89.8 | 130 | 3.6 | 239 | 6.6 | |
| <1 time/wk | 698 | 11.7 | 620 | 88.8 | 31 | 4.4 | 47 | 6.7 | |
| Never/almost never | 172 | 2.9 | 138 | 80.2 | 15 | 8.8 | 19 | 11.0 | |
| Consumption of dairy products | .336 | ||||||||
| Daily | 5204 | 87.4 | 4630 | 89.0 | 208 | 4.0 | 365 | 7.0 | |
| > 3 times/wk | 340 | 5.7 | 304 | 89.4 | 17 | 4.9 | 20 | 5.8 | |
| 1-2 times/wk | 159 | 2.7 | 147 | 92.4 | 3 | 1.6 | 10 | 6.0 | |
| <1 time/wk | 97 | 1.6 | 86 | 89.0 | 2 | 2.5 | 8 | 8.6 | |
| Never/almost never | 154 | 2.6 | 128 | 83.6 | 9 | 6.0 | 16 | 10.4 | |
| Consumption of sweet products | .009 | ||||||||
| Daily | 1607 | 27.0 | 1395 | 86.8 | 78 | 4.8 | 134 | 8.3 | |
| > 3 times/wk | 747 | 12.6 | 662 | 88.6 | 31 | 4.1 | 54 | 7.3 | |
| 1-2 times/wk | 942 | 15.8 | 854 | 90.7 | 31 | 3.3 | 57 | 6.0 | |
| <1 time/wk | 1070 | 18.0 | 982 | 91.8 | 30 | 2.8 | 57 | 5.4 | |
| Never/almost never | 1586 | 26.6 | 1402 | 88.4 | 69 | 4.3 | 116 | 7.3 | |
| Consumption of fast food | <.001 | ||||||||
| > 3 times/wk | 76 | 1.3 | 68 | 88.7 | 3 | 3.3 | 6 | 8.0 | |
| 1-2 times/wk | 357 | 6.0 | 330 | 92.3 | 6 | 1.6 | 22 | 6.1 | |
| <1 time/wk | 904 | 15.2 | 855 | 94.6 | 14 | 1.5 | 35 | 3.9 | |
| Never/almost never | 4615 | 77.5 | 4042 | 87.6 | 217 | 4.7 | 355 | 7.7 | |
| Dental hygiene | <.001 | ||||||||
| ≥ 3 times/d | 2201 | 37.0 | 2067 | 93.9 | 51 | 2.3 | 83 | 3.7 | |
| 2 times/d | 1985 | 33.3 | 1811 | 91.2 | 57 | 2.9 | 117 | 5.9 | |
| 1 time/d | 1207 | 20.3 | 1030 | 85.3 | 63 | 5.3 | 114 | 9.4 | |
| Never/occasionally | 561 | 9.4 | 388 | 69.2 | 67 | 12.0 | 105 | 18.7 | |
| Chronic disease | <.001 | ||||||||
| No | 2016 | 33.9 | 1901 | 94.3 | 38 | 1.9 | 77 | 3.8 | |
| Yes | 3937 | 66.1 | 3395 | 86.2 | 201 | 5.1 | 342 | 8.7 | |
| Hypertension | <.001 | ||||||||
| No | 3438 | 57.7 | 3167 | 92.1 | 78 | 2.3 | 193 | 5.6 | |
| Yes | 2515 | 42.3 | 2129 | 84.6 | 161 | 6.4 | 225 | 9.0 | |
| Acute myocardial infarction | <.001 | ||||||||
| No | 5804 | 97.5 | 5194 | 89.5 | 218 | 3.8 | 392 | 6.8 | |
| Yes | 149 | 2.5 | 102 | 68.2 | 21 | 14.0 | 27 | 17.8 | |
| Other heart diseases | <.001 | ||||||||
| No | 5269 | 88.5 | 4794 | 91.0 | 147 | 2.8 | 328 | 6.2 | |
| Yes | 684 | 11.5 | 502 | 73.3 | 92 | 13.5 | 90 | 13.2 | |
| Diabetes mellitus | <.001 | ||||||||
| No | 5110 | 85.8 | 4640 | 90.8 | 162 | 3.2 | 308 | 6.0 | |
| Yes | 843 | 14.2 | 656 | 77.9 | 76 | 9.1 | 110 | 13.1 | |
| High cholesterol | .070 | ||||||||
| No | 3937 | 66.1 | 3483 | 88.5 | 157 | 4.0 | 298 | 7.6 | |
| Yes | 2016 | 33.9 | 1813 | 89.9 | 82 | 4.1 | 120 | 6.0 | |
| Stroke | <.001 | ||||||||
| No | 5835 | 98.0 | 5227 | 89.6 | 215 | 3.7 | 393 | 6.7 | |
| Yes | 118 | 2.0 | 68 | 58.0 | 24 | 20.4 | 25 | 21.5 | |
DK/DA, didn’t know/didn’t answer.
The results of the multivariate Cox model for CV mortality adjusted for competing causes of death and all the study variables analyzed are shown in table 2. The model was built using a random sample of 4204 women (71%) and tested in the remaining 1749 (29%). The HRs for CV mortality are shown for each item within the predictor categories. Sitting during most of the day vs walking around and performing tasks requiring exertion in the person's main daily activity was the strongest predictor of CV mortality (HR=2.757). This was followed by active smoking (HR=1.816) vs having never smoked, sleeping for more than 9hours a day (HR=1.809) vs 7 to 9hours, eating vegetables less than once a week (HR=1.758) vs every day, and having been admitted to hospital in the past year (HR=1.700). The only chronic diseases that independently predicted CV mortality were diabetes mellitus (HR=1.522) and high cholesterol. BMI did not have independent predictive power in the presence of the other factors. As seen in the last row of table 2, there was a significant interaction between age and mortality due to other causes, such that the HR represents the difference in the effect of age on CV mortality and mortality due to other causes. In brief, the risk of mortality due to other causes was 0.955 times that of CV mortality. In other words, age contributed to a slightly increased risk of CV mortality compared with mortality due to other causes. The model fit the data well (LRT=1072.6; P<.001), met the proportional hazards assumption (P=.257), and showed high predictive capacity in the validation sample, with a C index of 0.8407 (95%CI, 0.8025-0.8789).
Multivariate Cox model for cardiovascular mortality with adjustment for competing risks from other causes of death
| β | SE | HR (95%CI) | P | |
|---|---|---|---|---|
| Age, y | 0.131 | 0.011 | 1.140 (1.116-1.165) | <.001 |
| EQ-5D-VAS | –0.012 | 0.003 | 0.988 (0.982-0.993) | <.001 |
| Body mass index | ||||
| Normal | 0 | 1 | ||
| Overweight | –0.177 | 0.162 | 0.837 (0.61-1.15) | .275 |
| Obesity | 0.011 | 0.174 | 1.011 (0.719-1.421) | .951 |
| DK/DA | 0.097 | 0.149 | 1.102 (0.823-1.475) | .514 |
| Smoking | ||||
| Never | 0 | 1 | ||
| Exsmoker | 0.272 | 0.275 | 1.313 (0.766-2.251) | .321 |
| Smoker | 0.597 | 0.280 | 1.816 (1.049-3.145) | .033 |
| Hours of sleep | ||||
| 7-9 h/d | 0 | 1 | ||
| >9 h/d | 0.593 | 0.157 | 1.809 (1.33-2.461) | <.001 |
| <7 h/d | 0.235 | 0.121 | 1.265 (0.998-1.604) | .053 |
| Main daily activity | ||||
| Walking around-tasks involving exertion | 0 | 1 | ||
| Standing during most of the day | 0.280 | 0.458 | 1.323 (0.539-3.245) | .542 |
| Sitting during most of the day | 1.014 | 0.467 | 2.757 (1.104-6.885) | .030 |
| Vegetable consumption | ||||
| Daily | 0 | 1 | ||
| > 3 times/wk | 0.074 | 0.125 | 1.077 (0.843-1.376) | .551 |
| 1-2 times/wk | 0.073 | 0.186 | 1.076 (0.747-1.549) | .694 |
| < 1 time/wk | 0.564 | 0.220 | 1.758 (1.143-2.707) | .010 |
| Diabetes mellitus | ||||
| Yes | 0.420 | 0.126 | 1.522 (1.189-1.949) | .001 |
| High cholesterol | ||||
| Yes | –0.315 | 0.114 | 0.730 (0.584-0.912) | .006 |
| Hospital admission in past year | ||||
| Yes | 0.531 | 0.140 | 1.700 (1.292-2.237) | <.001 |
| Age*other causes | –0.046 | 0.012 | 0.955 (0.933-0.978) | <.001 |
95%CI, 95% confidence interval; DK/DA, didn’t know/didn’t answer; EQ-5D-VAS, 5-level EQ-5D visual analog scale; HR, hazard ratio; SE, standard error.
Training sample, n=4204; cardiovascular deaths, n=177; deaths due to another cause, n=348; likelihood ratio test (χ2=1072.6; P<.001); C index=0.8656 (95%CI, 0.8472-0.8840); proportional hazards test, P=.257.
Validation in test sample (n=1749); “honest” C index=0.8407 (95%CI, 0.8025-0.8789).
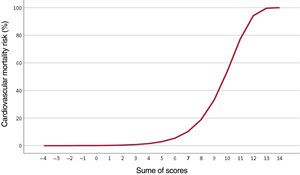
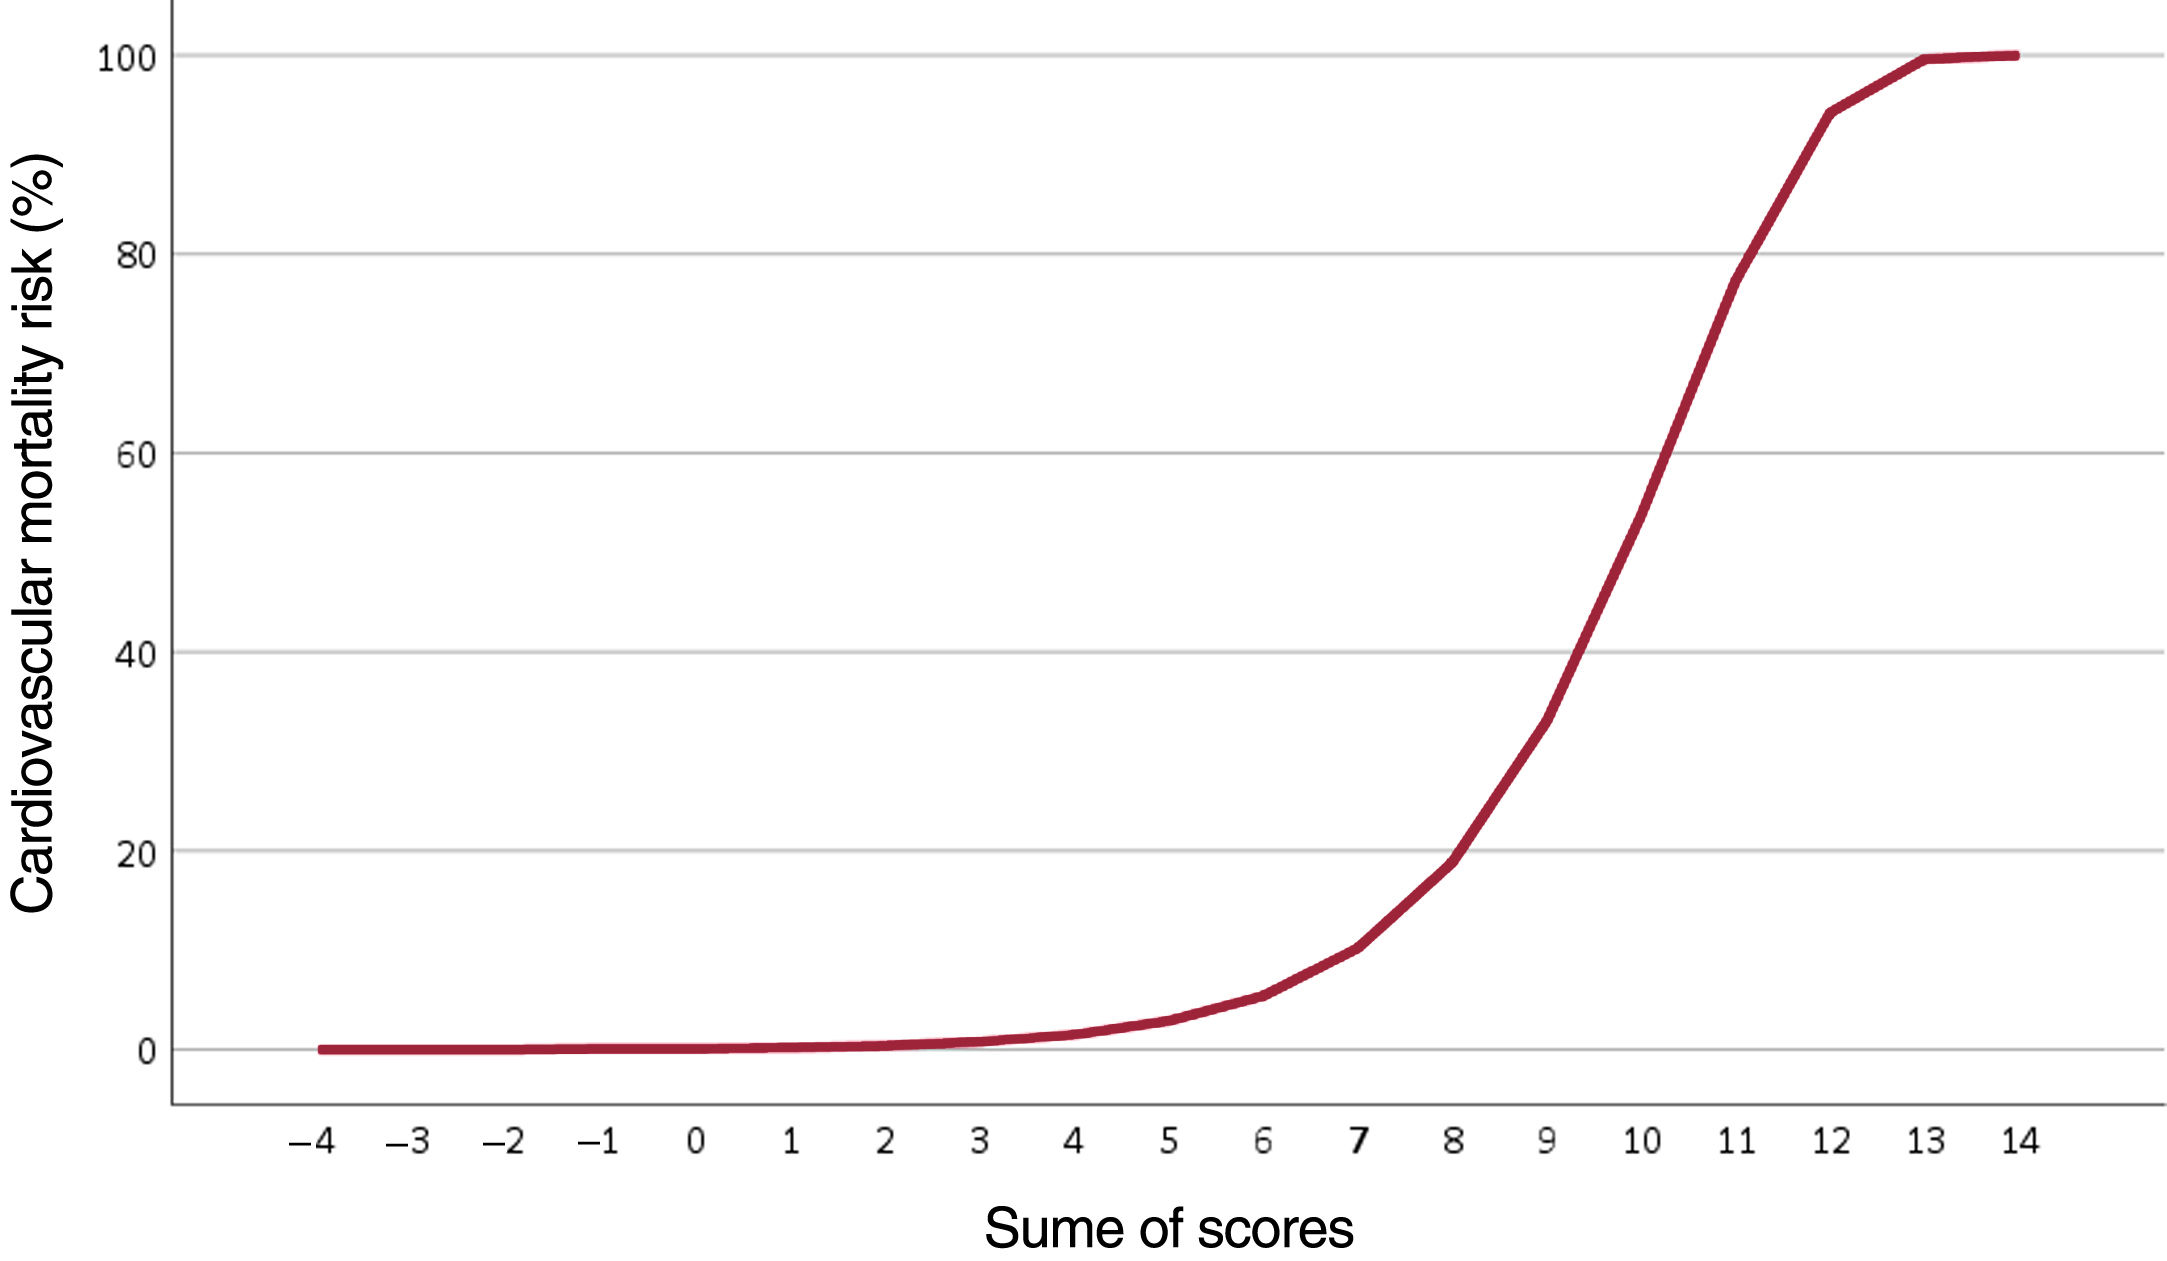
The results of the multivariate model were used to assign a score to each risk factor and build a CV risk scale for women based on their lifestyle habits and the presence of chronic diseases (table 3). BMI and high cholesterol levels were not included as they did not have independent predictive power in the multivariate analysis. The sum of scores for each predictor indicates the probability of CV mortality over 6 years (table 4). For example, an 85-year-old woman (5 points) who scored 80 on the EQ-5D-5L VAS (0 points), smoked (1 point), slept an average of 8hours a day (0 points), spent most of her day sitting (2 points), ate vegetables 3 times a week (0 points), did not have diabetes (0 points), and had been admitted to hospital once in the past year (1 point) would have a 33% risk of dying of CVD in the next 6 years (total score, 9 points). The curve showing the risk of CV mortality according to total score is shown in figure 1.
Risk scale for each category of predictor variables from the multivariate model
| Risk factor | Category | Score |
|---|---|---|
| Age, y | 50-54 | –2 |
| 55-59 | –1 | |
| 60-64 | 0 | |
| 65-69 | 1 | |
| 70-74 | 2 | |
| 75-79 | 3 | |
| 80-84 | 4 | |
| 85-89 | 5 | |
| 90-94 | 6 | |
| 95-99 | 7 | |
| 100-105 | 8 | |
| EQ-5D-VAS (0-100) | 0-24 | 1 |
| 25-49 | 0 | |
| 50-74 | 0 | |
| 75-100 | 0 | |
| Smoking | Never smoked | 0 |
| Exsmoker | 0 | |
| Smoker | 1 | |
| Sleep duration | ≤9 h/d | 0 |
| >9 h/d | 1 | |
| Main daily activity | Walking-tasks involving exertion | 0 |
| Standing for most of the day | 0 | |
| Sitting for most of the day | 2 | |
| Vegetable consumption | Daily | 0 |
| ≥3 times/wk | 0 | |
| 1-2 times/wk | 0 | |
| <1 time/wk | 1 | |
| Diabetes | No | 0 |
| Yes | 1 | |
| Hospital admission in past year | No | 0 |
| Yes | 1 |
EQ-5D-VAS, 5-level EQ-5D visual analog scale.

We have shown that lifestyle habits are closely linked to CV mortality in women of menopausal age. Vegetable consumption, physical activity, smoking, and number of hours spent sleeping carried as much or more weight than chronic diseases or classic CV risk factors. We used our findings to design a simple 6-year CV risk scale based on self-reported data that had high predictive capacity.
Prevalence of CV risk factorsCV risk factors were common in the women studied: 42% had hypertension, 14% diabetes, and 34% high cholesterol. This indicates that there is much room for improvement in interventions aiming to promote heart-healthy diets, physical exercise, and avoidance of smoking or excessive alcohol intake. The proportion of women leading a sedentary life—51%—is similar to rates described in countries with different geographic, sociocultural, and economic backgrounds, such as Bangladesh (58%),20 India (55%),21 and Cameroon (51.9%).22
ObesityNumerous studies have analyzed the association between weight and CVD in postmenopausal women. It has been postulated that abdominal, not general, obesity is linked to insulin dependence and onset of diabetes and CVD,23 and one of the predisposing factors for centrally distributed obesity is early postmenopause. The combination of age, menopause, and abdominal obesity has been linked to the accumulation of classic CV risk factors such as hypertension, dyslipidemia, and diabetes.13 As in other settings such as heart failure, stroke, and atrial fibrillation, obesity defined by BMI exerts a protective effect against CVD.24,25
DietDietary phytoestrogens, which are diphenolic components present at high levels in fruit and vegetables, have been shown to counter the antiestrogenic effects of postmenopause.26 Accordingly, they may be especially beneficial in populations such as ours. Basic research has identified a number of possible mechanisms underlying the beneficial effects of phytoestrogens, namely, affinity for estrogen receptors, antioxidant properties, and antiangiogenic and antiproliferative effects.27 Consumption of plant-based rather than animal-based protein has been shown to reduce low-density lipoprotein cholesterol and triglycerides.28 Unlike other strategies for reducing CV risk in postmenopausal women, eating vegetables has been shown to simultaneously reduce the risk of breast cancer.27 Vegetable consumption in our series was the strongest modifiable predictor of CV mortality and mortality due to other causes.
Physical activityPhysical activity has been shown to reduce CV risk in both the general population and postmenopausal women.29 Indeed, high levels of inactivity are thought to be one of the reasons why postmenopausal women have a higher CV risk than men.30 We were able to distinguish between women who engaged in physical activity for leisure and those whose main daily activity involved being physically active (regardless of whether or not this activity was considered to be work-related). Being active as part of one's main daily activity was closely associated with a lower risk of CV mortality, where leisure-time physical activity had no predictive capacity in the presence of other factors.
Although numerous studies have shown that nonoccupational physical activity reduces CV risk, very few studies have adjusted for physical activity performed as part of the person's main daily activity. We believe that this novel distinction is important, as work-related or similar physical activity occupies many more hours—and years—than leisure-time physical activity, which is typically performed for 30 to 120minutes a day 2 to 5 days a week. In our sample, the number of hours spent sitting or lying down was directly associated with CVD, supporting previous findings.14 Many of the studies showing the benefits of physical activity programs on CV risk in women have been conducted in sedentary, obese women,20 but the effect might be diluted in women who are very physically active in their daily routines. Cross-sectional studies analyzing the effects of physical activity in postmenopausal women have shown an inverse correlation between CVD risk and physical activity, with greater reductions observed with increasing activity.20 Leisure-time physical activity is obviously very important for sedentary women, but its effects are diluted in women whose daily routines involve being physically active.
Hours of sleepPrevious research has shown an association between CVD and excessive or deficient sleep,31 but none of the studies have specifically analyzed postmenopausal women. Although the causal associations between sleep duration and CVD are unclear, there are indications that genetic predisposition31 and concomitant risk factors such as dyslipidemia and insufficient physical activity32 may contribute to an increased CV risk. Predisposition to adverse coronary events has been shown in this setting.33
Nonsignificant classic CV risk factors in our populationHigh cholesterol, a known CV risk factor, exerted a protective effect in our cohort. We believe there are several reasons for this. Because our data were taken from a survey on lifestyle habits, we did not have access to lipid profiles, but a considerable proportion of the women diagnosed with high cholesterol were probably on treatment with statins, which have a strong protective role in CVD. There is also a close association between cholesterol levels and fruit and vegetable intake and physical activity, with basic research indicating that higher fruit and vegetable consumption reduces atherosclerosis linked to serum cholesterol levels.34 Because our results are based on self-reported data, the presence of hypercholesterolemia may be underestimated.
Lifestyle CV risk scaleCV risk scales have a dual purpose: to identify people with increased CV risk and to raise awareness among patients and health care professionals of the importance of adhering to treatments and encouraging action in this regard. Although current scales adjust for differences between men and women, the adjustments are exclusively quantitative in nature. Our risk scale, by contrast, is based on data from women of menopausal age, providing an easy-to-use scale directly applicable to postmenopausal women. A score of 6 points or more indicates a 5% increased risk in CV mortality but, as shown in figure 1, risk increases sharply after a score of 7. Age adds up to 2 points to the risk of premature CV death (before the age of 74 years). To maintain this risk under 5% thus, it is sufficient to refrain from smoking, take some physical activity every day, and eat plenty of vegetables.
Limitations and strengthsOur study has some limitations. Because of its retrospective, observational design, we cannot infer any causal relationships or rule out the presence of selection and exclusion biases. Although we controlled for confounders in our multivariate analysis, we cannot fully rule out the possibility of confounding. Likewise, some predictors of CV risk may be missing from our model. Our study also has some strengths, in particular the complex sampling design used, which provided representative estimates from a cohort of women older than 50 years living in Spain in 2011.
ConclusionsCV risk in women of menopausal age is significantly influenced by lifestyle habits. Factors such as vegetable consumption and physical activity are very important in this population. Other factors, however, such as high cholesterol and obesity, which are strong predictors in men, do not appear to have predictive value in postmenopausal women.
FundingNo funding was received for this study.
Authors’ contributionsJ.A. Quesada, V. Bertomeu-González, J.M. Ruiz-Nodar, A. López-Pineda, and F. Sánchez-Ferrer contributed to the study design. J.A. Quesada requested the data and performed the statistical analyses. J.A. Quesada, V. Bertomeu-González, J.M. Ruiz-Nodar, A. López-Pineda, and F. Sánchez-Ferrer contributed to the interpretation of data. J.A. Quesada, V. Bertomeu-González, J.M. Ruiz-Nodar, A. López-Pineda, and F. Sánchez-Ferrer contributed to writing the manuscript. All the authors approved the final version of this manuscript.
Conflicts of interestNone.
- –
CVD is the leading cause of morbidity and mortality worldwide but there are marked differences between men and women. The prevalence of CV disease is lower in premenopausal women than in men of the same age but the opposite is true for postmenopausal women.
- –
Many CV risk prediction models exist for the general population, but no studies have specifically analyzed predictors in postmenopausal women.
- –
CV risk in postmenopausal age is significantly influenced by lifestyle habits. Vegetable consumption, physical activity, smoking, and number of hours spent sleeping carry as much or more weight than chronic diseases or classic CV risk factors. We have designed a simple 6-year CV risk scale based on self-reported data that has high predictive capacity.
Supplementary data associated with this article can be found in the online version available, at https://doi.org/10.1016/j.rec.2021.10.006