INTRODUCTION
Regular physical activity is considered one of the most effective strategies in preventing the leading causes of morbidity and mortality in western countries.1 The North American Health Department has identified increased physical activity as its primary aim by 2010.2 This was motivated by the serious risk to individual and social health due to the lack of physical activity.3 It has been known , even for early ages, that the level of physical activity seems to be related to specific cardiovascular risk factors.4,5
Physical activity is defined as any body movement produced by the skeletal muscles that requires a certain amount of energy expenditure. This refers to the type of physical effort that is practiced regularly, and its duration, and frequency. Although related, physical fitness is a concept different from physical activity. This refers to the ability to perform exercise, understood as an integrated measure of all the functions and structures that are involved (skeletal-muscle, cardiorespiratory, hematocirculatory, psychoneurological, and endocrine-metabolic).6
Recent research has clearly shown that physical fitness, mainly aerobic capacity, is an important predictor of cardiovascular and all-cause morbidity and mortality in both men7-9 and women.8-10 Similarly, muscle strength, in men11-13 and in women,13 can be a different and independent predictor of morbidity and mortality.
However, the evidence shows that these do not originate in adulthood, but at much earlier ages. Longitudinal studies have confirmed that the level of physical fitness and cardiovascular risk factors in adults are directly related to the level of physical fitness during adolescence.14,15 Although the clinical characteristics of cardiovascular disease normally appear in adults, their pathogenic origin can be found in adolescence and even in childhood.16-19
Cross-sectional studies have shown the close relationship, during childhood and adolescence, between specific cardiovascular risk factors and the level of physical fitness, as measured by aerobic capacity20-22 and muscle strength.23 However, no in-depth analysis has investigated how both components of physical fitness together affect the lipid-metabolic profile in adolescents.
Therefore, the aims of this work were: a) to study which variable, physical activity, or physical fitness, has the greatest influence on the lipid-metabolic profile in Spanish adolescents; and b) to study the independent effect of aerobic capacity and muscle strength on the lipid-metabolic profile.
METHODS
Subjects and Experimental Design
This work is part of the AVENA project (Alimentación y Valoración del Estado Nutricional en Adolescentes) (Food and Assessment Nutritional Status in Adolescents). This was a multicenter study designed to evaluate the state of health, as well as the nutritional-metabolic situation and level of physical fitness, of a representative sample of Spanish adolescents aged 13-18.5 years. The general methodology of the study has already been published.24-26 From a total of 2859 adolescents, 460 (248 male and 212 female; mean age 15.2 [1.4] years) were randomly chosen for biochemical-metabolic analysis, forming a representative sample of the total study sample.27
The project followed the ethical standards recognized by the Declaration of Helsinki (reviewed in Hong-Kong in September 1989 and in Edinburgh in 2000) and the EEC Good Clinical Practice recommendations (document 111/3976/88, July 1990), and current Spanish legislation regulating clinical research on humans (Royal Decree 561/1993 on clinical trials). The study was approved by the Ethics Committee of the University Hospital Marqués de Valdecilla (Santander, Spain).
Anthropometric Characteristics
All anthropometric measurements were performed with the subjects barefoot and in underwear. Weight was measured with a Seca platform scale (Seca, Hamburg, Germany) (range, 0.05-130 kg; accuracy, 0.05 kg). Height was measured with the same device (range, 60-200 cm; accuracy, 1 mm). Body Mass Index was calculated. The anthropometric measurements in the AVENA project were standardized and intraobserver and interobserver reliability strictly monitored.25
Sexual Maturation
We assessed the different stages of maturational development were assessed following the methodology described by Tanner and Whitehouse.28 Five stages were recognized for each of the following characteristics: genital development and pubic hair in males, and breast development and pubic hair in females.
Physical Activity
Physical activity was assessed through questionnaires designed in line with the Yesterday Activity Checklist,29 translated and validated for the Spanish population.30 The level of physical activity outside school (and in different situations: school days, weekends, and summer vacation) was assessed with these questionnaires. These included a list of activities normally practiced by adolescents. The participants were asked to mark only those activities they actually practiced. Based on previous classifications,31 each activity was assigned a value in metabolic equivalents (MET) according to its estimated energy expenditure. A physical activity index was calculated based on the total MET of each activity, through principal components factor analysis (varimax rotation).32 Thus, a single factor was obtained representing the level of physical activity of each subject. The physical activity index had an eigenvalue >1 (2.23) and explained 55.9% of the variance in physical activity.
A dichotomous question (yes/no) was included in one of the questionnaires to establish which physical activities were practiced outside the school schedule. This was answered by each adolescent and a classmate for greater objectivity. This dichotomous variable was compared with the physical activity index. The sensitivity (S) and specificity (E) of the index were calculated and the cut-off point obtained via receiver operating characteristic curves.33 The cut-off point was expressed with the maximum value of the Youden index34 (Y), (Y=S+E1), which provides information on the value of diagnostic tests. Thus, the optimal cut-off value was set at 0.44 to distinguish between "active" and "non-active."32 The area below the curve was 0.766, with a standard error of 0.011.
The time spent in sedentary activities, including watching television and playing video games, was recorded via questionnaire,35 classifying the subjects into two groups (¾2 h/day and >2 h/day). Information was also collected on the time spent by the adolescents in actively traveling (walking or cycling) to school, distinguishing between 0-15 min/day and >15 min/day.
Physical Fitness
Aerobic Capacity
Aerobic capacity was assessed via the Course-Navette test or 20-m shuttle run test, an indirect-incremental-maximum field test.36 This test has been validated in children and adolescents (r=0.7 for young people aged 8-19 years).37,38 The following formula was used to calculate maximum oxygen consumption (VO2max) based on the result of the Course-Navette test38:
VO2max=31.025+3.238V3.248E+0.1536VE
where V is the final speed reached in the test (V=8+0.5last completed stage) and E is age in years.
Muscle Strength
Muscle strength was measured via 3 tests: a) standing broad jump with feet together to measure lower limb explosive strength; b) hand dynamometry test to measure maximum hand grip strength via the Takei TKK 5101 digital dynamometer (range 5-100 kg, accuracy 0.1 kg); and c) bent-arm hang test to measure upper-limb muscle endurance.
All these tests are included in the EUROFIT battery which has been validated and standardized by the Council of Europe.39 Each variable was transformed by dividing each observed value by the maximum value of the variable. The average of the three transformed variables was used to establish a single variable called the general strength index (GSI), having values between 0 and 1.
Biochemical Analysis
Blood samples were taken between 08.00 and 09.00, after fasting for 10 h. Subjects were asked not to engage in any prolonged exercise during the previous 48 h. In all cases, blood was extracted from an antecubital vein (20 mL).
Glucose, triglyceride, and high-density lipoprotein cholesterol (HDL-C) concentrations were measured by enzymatic colorimetric assay via a Hitachi 911 analyzer (Roche Diagnostics, Basel, Switzerland). High-density lipoprotein cholesterol was measured after precipitating out the remaining circulating lipoproteins, before the analysis, via the phosphotungstate precipitation method. Low-density lipoprotein cholesterol (LDL-C) was calculated via the Friedewald formula40 adjusting for serum triglyceride concentrations.41 The results of the analytical procedures underwent quality control, according to the regulations governing hospitals in the Spanish public health system.
A lipid-metabolic cardiovascular risk index was derived from22 triglyceride, LDL-C, HDL-C, and glucose concentrations. Each of these blood variables was standardized as, for example, Z=([valuemean]/SD). The standardized variable for HDL-C was multiplied by [1] since its relation to cardiovascular risk stands in contrast to the remaining variables. The lipid-metabolic cardiovascular risk index was calculated as the total of the 4 standardized variables, so that lower values of this parameter reflect a more beneficial lipid-metabolic profile in terms of cardiovascular health. By definition, its mean is 0.
Statistical Analysis
Statistical analysis was performed with SPSS version 12.0.1 software. Between-sex differences were analyzed by one-way analysis of variance (one-way ANOVA) for continuous variables, and the Pearson χ2 test for discrete variables. The relationships between independent variables (physical activity, aerobic capacity, and muscle strength) were studied via partial correlation adjusted for age and maturational development. All of these independent variables were recoded as terciles to study their relationship to the lipid-metabolic index via analysis of covariance (one-way ANCOVA), separately by sex, and adjusting for age and maturational development. A linear trend analysis was performed via polynomial contrast. The P value for post-hoc hypothesis testing was determined via the Bonferroni correction for multiple comparisons.
RESULTS
Descriptive Analysis
Table shows that weight and height were greater in males (P<.001), whereas Body Mass Index was similar in both sexes. The physical activity index and the percentage of physically active adolescents was greater in males. However, females spent less time in sedentary activities (P<.001) and the percentage of adolescents spending more than 2 h in such activities was lower among females (P<.001). Both aerobic capacity and muscle strength were significantly greater in males (P<.001). Male adolescent showed higher triglyceride (P=.042) and glucose (P<.001) concentrations. Females presented greater concentrations of LDL-C and HDL-C (P=.002 and P<.001, respectively).

Relationship Between Physical Activity, Aerobic Capacity, and Muscle Strength
The physical activity index showed a significant correlation with aerobic capacity in both sexes (males, r=0.182, P=.009; females, r=0.259, P<.001), but not with the general strength index. On the other hand, there was a correlation between aerobic capacity and the general strength index, both in males (r=0.262; P<.001), and females (r=0.289; P¾.001).
Relationship of the Lipid-Metabolic Index to Physical Activity, Aerobic Capacity, and Muscle Strength
There was no relationship between the physical activity index and the lipid-metabolic index. Aerobic capacity was related to the lipid-metabolic index in males (P=.003) after adjusting for age, maturational development, physical activity, and muscle strength. A linear relationship was found in males via polynomial contrast (P=.001), whereas the post-hoc study showed significant differences between the 1st and 3rd terciles (P=.003) and 2nd and 3rd terciles (P=.027) (Figure 1). In females, there was a relationship between the general strength index and the lipid-metabolic index (P=.048) after adjusting for age, maturational development, and aerobic capacity. A linear relationship was also observed between the general strength index and the lipid-metabolic index (P=.014) in females, and a significant difference between the 1st and 3rd terciles (P=.042) (Figure 2).

Figure 1. Relationship between aerobic capacity and lipid-metabolic cardiovascular risk index in male and female adolescents. VO2max indicates maximum oxygen consumption. Minimum and maximum values are indicated for each category (low, medium, and high representing the 1st, 2nd, and 3rd terciles, respectively). The error bars represent the standard error of the mean. aP<.05. bP<.01.

Figure 2. Relationship between the general strength index and the lipid-metabolic cardiovascular risk index in male and female adolescents. Minimum and maximum values are indicated for each category (low, medium, and high representing the 1st, 2nd, and 3rd terciles, respectively). The error bars represent the standard error of the mean. *P<.05.
DISCUSSION
According to our results, aerobic capacity and muscle strength in Spanish adolescents are significantly associated with their lipid-metabolic profile. High aerobic capacity in males (VO2max >51.6 mL/kg/min) is associated with a lower lipid-metabolic cardiovascular risk index (Figure 1), independently of the level of physical activity and muscle strength. On the other hand, the adolescents who have a high level of muscle strength (3rd tercile) have a healthier lipid-metabolic profile than those with a low level (1st tercile) of muscle strength (Figure 2), independently of their aerobic capacity. Previous studies have reported a relationship between aerobic capacity and given cardiovascular risk factors in adolescents.20-22 Taken together with this, our results show that muscle strength in the adolescents (at least in females) is also independently associated with cardiovascular risk factors, which we have not consistently found in previous literature.
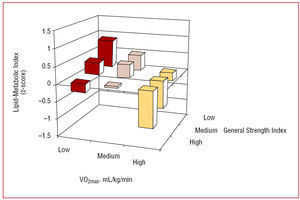
The combined analysis of aerobic capacity and muscle strength (Figure 3) shows that low aerobic capacity corresponds to a high lipid-metabolic index, except when the level of strength is high. A low level of muscle strength corresponds to a high lipid-metabolic index, except when aerobic capacity is high. High aerobic capacity corresponds to a low lipid-metabolic risk, whatever the level of strength. At the same time, a high level of muscle strength corresponds to a low lipid-metabolic risk at any level of aerobic capacity.

Figure 3. Combined effect of aerobic capacity and muscle strength on the lipid-metabolic profile in male and female adolescents. VO2max indicates maximum oxygen consumption.
A person´s physical fitness (expressed in the present work as aerobic capacity and muscle strength) is mainly determined by 2 components. One of these is the genetic constitution of the individual.42 The other includes the set of stimuli encountered by the organism, among which are the physical activities the person performs. Thus, it is reasonable to assume that there would be a relationship, although modest, between the level of physical activity and aerobic capacity (males, P=.009, r=0.182; females, P<.001, r=0.259).
Previous works have reported a positive relationship between the level of physical activity and cardiovascular health in adults,43,44 and also in children and adolescents.5 The absence of this finding in our work, together with the positive relationship established between the level of physical activity and aerobic capacity, suggests that aerobic capacity is the variable that really determines the relationship between physical activity and cardiovascular health reported by previous studies. As other studies on adolescents have demonstrated,45,46 physical fitness is associated with cardiovascular risk factors to a greater extent than the level of physical activity. This leads us to conclude that the level of physical activity may not be a cardiovascular health indicator with high discriminatory power. In fact, engaging in more physical activity does not seem to be sufficient to achieve a healthy lipid-metabolic profile. Such physical activity should involve an improvement in physical fitness, especially in aerobic capacity and muscle strength.
The subjective nature of assessment via questionnaires hinders the task of accurately measuring the quantity and intensity of physical activity performed by the adolescent. This limitation may have negatively influenced the analysis of a possible association between physical activity and lipid-metabolic profile. A recent study using accelerometry reported that vigorous physical activity (>6 MET), but not moderate or total physical activity, seems to be a predictor of the degree of obesity in adolescents.47 However, and despite using accelerometry, the aerobic capacity of adolescents is associated with cardiovascular risk factors to a greater degree than the level of physical activity.48
CONCLUSIONS
The results show that, in Spanish adolescents, low physical fitness is associated with a less healthy lipid-metabolic profile in terms of cardiovascular risk, regardless of the level of physical activity performed. Lipid-metabolic risk was related to aerobic capacity in males, whereas muscle strength was the associated in females quality of physical activity. The results indicate that improvements in physical fitness, especially aerobic capacity in males and muscle strength in females, can have a protective role in cardiovascular risk in adolescents. Cross-sectional studies with a greater sample size and specially longitudinal prospective studies, are needed, to confirm the results of the present work.

ACKNOWLEDGEMENTS
To all who made the AVENA study possible: adolescents, parents, teachers, institutions and, of course, researchers, and co-workers. To María Teresa Miranda León, for her expert advice on statistics. To the group: the strongest links join with the weakest such that the entire chain may be strengthened.
ABBREVIATIONS
AVENA: Alimentación y Valoración del Estado Nutricional en Adolescentes (Food and Assessment of Nutritional Status in Adolescents)
HDL-C: high-density lipoprotein cholesterol
LDL-C: low-density lipoprotein cholesterol
GSI: general strength index
MET: metabolic equivalents
VO2max: maximum oxygen consumption
See editorial on pages 565-8
*The researchers participating in the AVENA study are listed in the Annex.
This study was financially supported by the Spanish Ministry of Health and Consumption (FCI No.00/0015), FEDER-FSE funds, the Spanish Ministry of Education and Science (AP2002-2920; AP2003-2138; AP2004-2745; AP2005-4358), the Higher Sports Council (Ref: 05/UPB32/01, 109/UPB31/03, and 13/UPB20/04), and Panrico S.A., Madaus S.A., and Procter & Gamble S.A.
Correspondence: Dr. E. García Artero.
Departamento de Fisiología. Facultad de Medicina. Universidad de Granada.
Avda. Madrid, s/n. 18012 Granada. España.
E-mail: artero@ugr.es
Received October 6, 2006.
Accepted for publication March 15, 2007.