Plant stanol consumption may improve long-term cholesterol control. The aim of the present study was to evaluate the effectiveness of 2g/day of plant stanols in reducing low-density lipoprotein cholesterol levels in patients with hypercholesterolemia.
MethodsThis randomized, double-blind, and placebo-controlled study included 182 adults diagnosed with hypercholesterolemia. A yogurt drink containing 2g of plant stanols was administered to 91 participants in the intervention group; 91 participants in the control group received unsupplemented yogurt. The primary end point was the change in the lipid profile at 12 months.
ResultsLow-density lipoprotein cholesterol levels at 12 months were significantly more reduced in the stanol intervention group than in the control group: 13.7 (95% confidence interval, 3.2-24.1) mg/dL (P=.011). A reduction of more than 10% in low-density lipoprotein cholesterol was achieved by a significantly higher proportion of participants in the intervention group (relative risk=1.7; 95% confidence interval, 1.1-2.7). In this group, the mean (standard deviation) level of low-density lipoprotein cholesterol decreased by 11.0% (23.9%).
ConclusionsOur results confirm that administration of plant stanols at a dosage of 2 g/day for 12 months significantly reduces (by slightly more than 10%) the concentrations of low-density lipoprotein cholesterol in individuals with hypercholesterolemia.
Trial registration (www.ClinicalTrials.gov): Current Controlled Trials NCT01406106.
Keywords
Although various clinical practice guidelines are aimed at reducing total cholesterol (TC) and low-density lipoprotein cholesterol (LDL-C) in individuals with hypercholesterolemia, a high percentage of patients have values higher than the recommended targets in both primary and secondary prevention.1–3
Low dosages of lipid-lowering drugs can be sufficient in some people with elevated cardiovascular risk (CVR) if they make sufficient changes to their usual diet.4 One dietary method that reduces TC and LDL-C is daily consumption of stanols.5 Moreover, the combination of stanols and statins provides an additional effect on lipid reduction.6 However, controversy surrounds the recommendation of dietary phytosterol supplementation.7
Although the available evidence on the effectiveness of phytosterols has been included in various clinical practice guidelines,4,8–11 fewer guidelines recommend their consumption.8,11
Despite publication of various studies on this topic, they have often been short in duration and with small numbers of patients.12–14 Moreover, most of the studies on the effectiveness of stanols have been performed outside Spain, probably in populations with life style and dietary habits different from ours. Accordingly, rigorous and longer-lasting studies in our setting are required to accurately quantify the magnitude of the long-term effects of stanols. Thus, the aim of the present study was to evaluate the effectiveness of 2g/day of plant stanols in reducing LDL-C levels in patients diagnosed with hypercholesterolemia. We also quantified the effect of daily stanol intake on other lipid profile parameters, evaluated the presence of adverse effects, and identified the factors associated with a greater reduction in LDL-C levels.
METHODSThis study consisted of a randomized, double-blind, placebo-controlled clinical trial. Participants were selected from 9 family medicine clinics from 3 health care centers of the health services area of Albacete, Spain. Individuals ≥ 18 years attending the participating centers were included if they had been diagnosed with borderline (TC, 200-249mg/dL) or definite (TC ≥ 250mg/dL) hypercholesterolemia with LDL-C ≥ 130mg/dL. Exclusion criteria were as follows: known hypersensitivity or contraindication for stanols or other components of the yogurt drink, triglyceride levels ≥ 400mg/dL, physical incapacity to participate, or severe chronic disease, whether organic or psychiatric, that restricted the patient's ability to attend the clinic or consume lactate products. All participants signed a written informed consent form after sufficient explanation of the study. The trial was approved by the Ethics Committee for Clinical Research in the Health Care Area of Albacete and adhered to the pertinent ethical guidelines for clinical trials (Spanish Royal Decree 223/2004) and the Declaration of Helsinki.
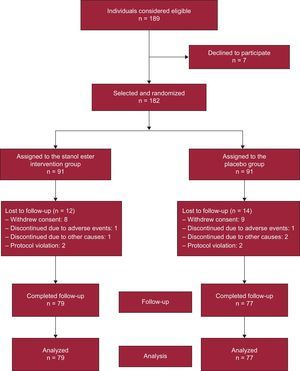
Sample size calculation was based on an expected mean (standard deviation) LDL-C level of 190 (36) mg/dL15 in the participants and an expected demonstration of a 10% reduction in LDL-C in those consuming stanols for 12 months. To obtain a power of 90% with an alpha error of 0.05 (bilateral hypothesis), 152 individuals were required (76 in the intervention group and 76 in the control group). With an assumed rate of loss to follow-up of 20%, 182 individuals distributed between 2 equal-sized groups (91 per group) were selected to achieve maximum statistical power. Of the 189 individuals evaluated for selection, 7 declined to participate in the study (acceptance rate, 96.3%) (Figure). The recruitment period was from March 2010 to February 2011.

The 182 remaining individuals were randomly and equiprobably assigned to the intervention or control group. The patient were assigned to groups by computer using a sequence of random numbers and following a 4×4 block system (ensuring that in a short interval there would be a similar number of patients in both groups). The assignment was performed in a centralized manner by a researcher of the Pharmacy Department of the Gerencia de Atención Primaria of Albacete who was not involved in the interviews or analysis. The information with the patient identification number and the assigned product number was kept in the pharmacy department in sealed, opaque, and numbered envelopes. The yogurt containers (with or without stanols) were delivered in a blind manner to the patients. To protect the blinding, the placebo and stanol-supplemented products had an identical appearance and were only identifiable via a code whose assignment was unknown to patients and researchers. Patients, researchers, and those responsible for data analysis were blinded to group assignments to guarantee objectivity when analyzing the results.
The intervention consisted of a yogurt drink, commercially available in Spain, containing 2g of the following plant stanol esters per container: sitostanol and campestanol (recommended dose of the American Heart Association, 1.5-3.0 g). Both the supplemented product and the placebo had the same characteristics (composition, external appearance, and taste) but the placebo contained no stanol esters. The yogurt drink was administered in a daily container and consumed after the main meal for 12 months. Each container had the following composition: protein, 1.8g; carbohydrate, 9.8g; fat (except stanols), 1.4g; plant stanols, 2g; vitamin B6, 0.6 mg; folic acid, 60 μg. All participants continued with previous and any newly prescribed lipid-lowering therapies. All participants were recommended to follow the therapeutic guidelines most suitable in each case (lifestyle modifications or lipid-lowering medication, according to the recommendations of the European guidelines on cardiovascular disease prevention).16 Physical exercise was advised (at least 30min/day for 4-5 days/weak), as well as the general characteristics of the Mediterranean diet (type and quantity of fats, carbohydrates, and proteins).
The follow-up duration was 12 months. Once consent was obtained, patients were scheduled for the initial visit and to provide samples for analysis. At the initial visit, participants were randomized to 1 of the 2 groups, data were obtained on medical history, analytics, and physical examination, and the corresponding yogurt drink was dispensed (subsequent deliveries were made according to the expiration date). Follow-up visits were conducted after 1, 3, 6, and 12 months to record analytical and physical examination parameters, as appropriate. The primary end point was the difference in LDL-C levels after 12 months. The lipid profile was measured (TC, LDL-C, HDL-C [high-density lipoprotein cholesterol], and triglycerides) after 3 and 12 months. Analytical measurements were made using blood vein samples taken following a fast of at least 12 h; the plasma concentrations of TC and LDL-C were determined using the CHODPAP and Friedewald methods, respectively. These measurements were made in the reference laboratory (Complejo Hospitalario Universitario de Albacete), which is accredited by the Spanish Society of Clinical Biochemistry. Other variables aalyzed included sociodemographic characteristics (age, sex, marital status, education level, and social class), therapeutic adherence using the Morisky-Green test17 (adherence was considered good if patients responded adequately to the 4 dichotomous questions of the questionnaire, concerning forgetting to drink the yogurt and adherence to the regimen), adverse events, adherence to dietary recommendations, dietary intake (lifestyle questionnaire),18 cardiovascular events (ischemic heart disease, atherothrombotic cerebrovascular disease, and peripheral artery disease), anthropometric data (weight, height, and body mass index), physical activity, smoking habits, systolic and diastolic blood pressure, CVR (SCORE [Systematic Coronary Risk Evaluation] tables for countries with low CVR and REGICOR [Registre Gironí del Cor]), health problems (International Classification of Primary Care-2 of WONCA [World Organization of National Colleges, Academies, and Academic Associations of General Practitioners/Family Physicians]), follow-up of the lipid-lowering drug therapy, and use of other medications. The following events were considered study end points: completion of the observation period, death, protocol violation, a severe adverse event, an intercurrent disease precluding dietary ingestion, and patient abandonment or withdrawal of consent. No changes were made to the protocol during the course of the study.
For the statistical analysis, a description was made of the baseline characteristics of the° 2 groups (measures of central tendency and spread). Subsequently, the participants in both groups were classified into different levels of LDL-C and TC reductions and a crude analysis was performed to evaluate the following parameters and their 95% confidence intervals (95%CIs): absolute benefit increase, relative benefit increase, and number of patients needed to treat. Moreover, the incidences of the outcome variables were described and compared in the 2 groups (comparison of proportions via a chi-square test or comparison of means via a Student t test or Mann-Whitney U test, with an alpha error of 5%). Changes in the parameters of each group were analyzed using a repeated measures t test. The possible existence of confounding factors and the effects of other variables on the relationship between the proposed intervention and the outcome variables were analyzed using logistic regression models (dependent variable: level of reduction of the lipid parameters). Multiple linear regression was used to analyze the possible variables related to a greater reduction in LDL-C levels in the intervention group and in all participants, by including the following variables in the model: sex, age, marital status, social class, number of health problems, number of medications taken, tobacco consumption, performance of physical activity, plasma levels of LDL-C and TC, weight and body mass index, CVR determined with SCORE, and adherence to the lipid-lowering diet at the beginning of the study. An effectiveness analysis was performed by intention to treat and all participants were maintained in their originally assigned group. All participants analyzed at 3 and 12 months were included in this analysis, regardless of their adherence to the yogurt consumption. The LDL-C value was determined in the corresponding visit. Analyses were performed with SPSS.v.20.0.
RESULTSOf the 182 individuals who began the study, 79 and 77 completed follow-up in the intervention and control groups, respectively. There was no difference in the percentage of individuals completing the study (86.8% vs 84.6%; P=.672). The distribution of patients lost to follow-up is shown in the Figure.
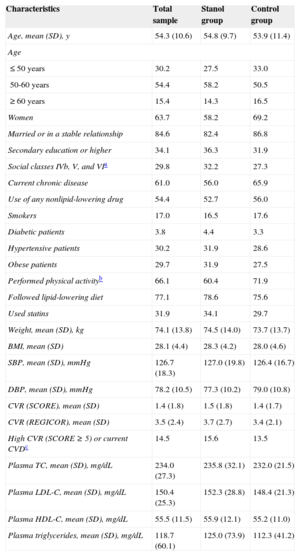
The mean (standard deviation) age of the participants was 54.3 (10.6) years. The baseline characteristics of the 2 groups are shown in Table 1. At the beginning of the study, 31 (34.1%) and 27 (29.7%) individuals were taking statins in the intervention and control groups, respectively. In the intervention group, 18, 10, 2, and 1 participants were taking simvastatin, atorvastatin, rosuvastatin, and pravastatin, respectively. In the control group, 17, 8, 1, and 1 participants were taking simvastatin, atorvastatin, pravastatin, and fluvastatin, respectively. The 2 groups showed similar dietary habits regarding the frequency of the consumption of oil, vegetables, salads, meat, fish, and other foods.
Baseline Characteristics of the Participants
| Characteristics | Total sample | Stanol group | Control group |
|---|---|---|---|
| Age, mean (SD), y | 54.3 (10.6) | 54.8 (9.7) | 53.9 (11.4) |
| Age | |||
| ≤ 50 years | 30.2 | 27.5 | 33.0 |
| 50-60 years | 54.4 | 58.2 | 50.5 |
| ≥ 60 years | 15.4 | 14.3 | 16.5 |
| Women | 63.7 | 58.2 | 69.2 |
| Married or in a stable relationship | 84.6 | 82.4 | 86.8 |
| Secondary education or higher | 34.1 | 36.3 | 31.9 |
| Social classes IVb, V, and VIa | 29.8 | 32.2 | 27.3 |
| Current chronic disease | 61.0 | 56.0 | 65.9 |
| Use of any nonlipid-lowering drug | 54.4 | 52.7 | 56.0 |
| Smokers | 17.0 | 16.5 | 17.6 |
| Diabetic patients | 3.8 | 4.4 | 3.3 |
| Hypertensive patients | 30.2 | 31.9 | 28.6 |
| Obese patients | 29.7 | 31.9 | 27.5 |
| Performed physical activityb | 66.1 | 60.4 | 71.9 |
| Followed lipid-lowering diet | 77.1 | 78.6 | 75.6 |
| Used statins | 31.9 | 34.1 | 29.7 |
| Weight, mean (SD), kg | 74.1 (13.8) | 74.5 (14.0) | 73.7 (13.7) |
| BMI, mean (SD) | 28.1 (4.4) | 28.3 (4.2) | 28.0 (4.6) |
| SBP, mean (SD), mmHg | 126.7 (18.3) | 127.0 (19.8) | 126.4 (16.7) |
| DBP, mean (SD), mmHg | 78.2 (10.5) | 77.3 (10.2) | 79.0 (10.8) |
| CVR (SCORE), mean (SD) | 1.4 (1.8) | 1.5 (1.8) | 1.4 (1.7) |
| CVR (REGICOR), mean (SD) | 3.5 (2.4) | 3.7 (2.7) | 3.4 (2.1) |
| High CVR (SCORE ≥ 5) or current CVDc | 14.5 | 15.6 | 13.5 |
| Plasma TC, mean (SD), mg/dL | 234.0 (27.3) | 235.8 (32.1) | 232.0 (21.5) |
| Plasma LDL-C, mean (SD), mg/dL | 150.4 (25.3) | 152.3 (28.8) | 148.4 (21.3) |
| Plasma HDL-C, mean (SD), mg/dL | 55.5 (11.5) | 55.9 (12.1) | 55.2 (11.0) |
| Plasma triglycerides, mean (SD), mg/dL | 118.7 (60.1) | 125.0 (73.9) | 112.3 (41.2) |
BMI, body mass index; CVD, cardiovascular disease; CVR, cardiovascular risk; DBP, diastolic blood pressure; HDL-C, high-density lipoprotein cholesterol; LDL-C, low-density lipoprotein cholesterol; REGICOR: Registre Gironí del Cor; SBP, systolic blood pressure; SCORE, Systematic Coronary Risk Evaluation; SD, standard deviation; TC, total cholesterol.
Values are expressed as percentages or mean (standard deviation).
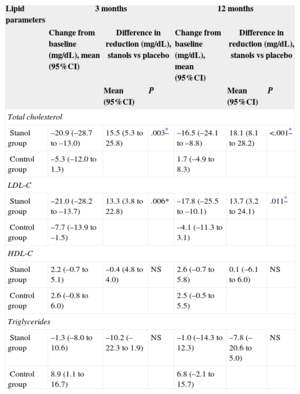
Table 2 shows the differences between the intervention and control groups in the lipid parameters at 3 and 12 months of follow-up. Comparison of the changes in the values of the various lipid parameters between the 2 groups during follow-up revealed a greater mean reduction in TC in the intervention group at both 3 months (15.5 [95%CI, 5.3-25.8] mg/dL; P=.003) and 12 months (18.1 [95%CI, 8.1-28.2] mg/dL; P<.001). The decrease in LDL-C was also greater in participants taking stanols after both 3 months (13.3 [95%CI, 3.8-22.8] mg/dL; P=.006) and 12 months (13.7 [95%CI, 3.2-24.1] mg/dL; P=.011). There were no statistically significant differences between the groups in HDL-C, triglycerides, TC/HDL-C, and LDL-C/HDL-C.
Changes in Lipid Parameters and Differences Between the Intervention and Control Groups in the Reduction of These Parameters After 3 and 12 Months
| Lipid parameters | 3 months | 12 months | ||||
|---|---|---|---|---|---|---|
| Change from baseline (mg/dL), mean (95%CI) | Difference in reduction (mg/dL), stanols vs placebo | Change from baseline (mg/dL), mean (95%CI) | Difference in reduction (mg/dL), stanols vs placebo | |||
| Mean (95%CI) | P | Mean (95%CI) | P | |||
| Total cholesterol | ||||||
| Stanol group | –20.9 (–28.7 to –13.0) | 15.5 (5.3 to 25.8) | .003* | –16.5 (–24.1 to –8.8) | 18.1 (8.1 to 28.2) | <.001* |
| Control group | –5.3 (–12.0 to 1.3) | 1.7 (–4.9 to 8.3) | ||||
| LDL-C | ||||||
| Stanol group | –21.0 (–28.2 to –13.7) | 13.3 (3.8 to 22.8) | .006* | –17.8 (–25.5 to –10.1) | 13.7 (3.2 to 24.1) | .011* |
| Control group | –7.7 (–13.9 to –1.5) | –4.1 (–11.3 to 3.1) | ||||
| HDL-C | ||||||
| Stanol group | 2.2 (–0.7 to 5.1) | –0.4 (4.8 to 4.0) | NS | 2.6 (–0.7 to 5.8) | 0.1 (–6.1 to 6.0) | NS |
| Control group | 2.6 (–0.8 to 6.0) | 2.5 (–0.5 to 5.5) | ||||
| Triglycerides | ||||||
| Stanol group | –1.3 (–8.0 to 10.6) | –10.2 (–22.3 to 1.9) | NS | –1.0 (–14.3 to 12.3) | –7.8 (–20.6 to 5.0) | NS |
| Control group | 8.9 (1.1 to 16.7) | 6.8 (–2.1 to 15.7) | ||||
95%CI, 95% confidence interval; HDL-C, high-density lipoprotein cholesterol; LDL-C, low-density lipoprotein cholesterol; NS, not significant.
At 12 months, the mean reduction in LDL-C from baseline was significantly greater in the intervention group than in the control group (11.0% vs 0.9%; 95%CI, 2.1%-18.1%; P=.014). The reduction in TC was also greater (6.1% vs 1.3%; 95%CI, 3.0%-11.7%; P=.001).
The proportion of participants with reduced LDL-C levels was significantly greater in the intervention group at both 3 months (relative risk [RR]=1.38; 95%CI, 1.10-1.74) and 12 months (RR=1.47; 95%CI, 1.13-1.91). A 10% reduction in LDL-C levels was achieved by a significantly higher proportion of participants in the intervention group than in the control group at both 3 months (RR=1.74; 95%CI, 1.16-2.62) and 12 months (RR=1.72; 95%CI, 1.11-2.65). After 12 months, the absolute benefit increase for achieving a 10% LDL-C reduction was 20% (95%CI, 5%-34%), the relative benefit increase was 42% (95%CI, 10%-62%), and the number of patients needed to treat was 5. A 10% reduction in TC levels at 12 months was also achieved by significantly more patients in the intervention group (RR=2.57; 95%CI, 1.38-4.77).
Adverse effects were seen in 7 patients (7.7%) in the intervention group and in 6 (6.7%) in the control group, without statistically significant differences between the groups (P=.733). All adverse effects were gastrointestinal (epigastric pain, feeling of fullness, bloating).
At 3 and 12 months, 73.0% (95%CI, 65.7%-80.2%) and 72.2% (95%CI, 64.7%-79.7%), respectively, of all the participants showed adequate adherence to the yogurt drink. No significant differences between the groups were seen in adherence at 3 months (68.7% vs 77.6%) and 12 months (68.8% vs 75.5%).
At both 3 and 12 months, no significant differences between the groups were seen in statin use and adherence to the dietary recommendations. At 12 months, 28 patients in the intervention group (35.4%) and 25 in the control group (32.9%) were taking statins. During follow-up, statins were prescribed to 2 patients in the intervention group and 2 patients in the control group. No modification was made to the statin dosage or type in any members of either group during follow-up.
There were no significant differences between the 2 groups in changes in anthropometric parameters, blood pressure, or CVR during follow-up.
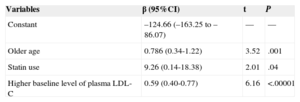
In the linear multiple regression, the factors related to the greatest reduction in LDL-C at 12 months are shown in Table 3 for all participants and in Table 4 for those consuming stanols. The variables related to a greater reduction in LDL-C values at 12 months in all participants were, apart from the treatment type (β=9.26; 95%CI, 0.14-18.38), older age (β=0.79; 95%CI, 0.34-1.22) and a higher baseline LDL-C value (β=0.59; 95%CI, 0.40-0.77).
Multiple Linear Regression Model for Variables Related to the Higher Reduction in Low-density Lipoprotein Cholesterol Levels in All Participants
| Variables | β (95%CI) | t | P |
|---|---|---|---|
| Constant | –124.66 (–163.25 to –86.07) | — | — |
| Older age | 0.786 (0.34-1.22) | 3.52 | .001 |
| Statin use | 9.26 (0.14-18.38) | 2.01 | .04 |
| Higher baseline level of plasma LDL-C | 0.59 (0.40-0.77) | 6.16 | <.00001 |
95%CI, 95% confidence interval; LDL-C, low-density lipoprotein cholesterol.
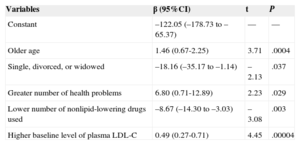
Multiple Linear Regression Model for Variables Related to the Higher Reduction in Low-density Lipoprotein Cholesterol Levels in the Intervention Group
| Variables | β (95%CI) | t | P |
|---|---|---|---|
| Constant | –122.05 (–178.73 to –65.37) | — | — |
| Older age | 1.46 (0.67-2.25) | 3.71 | .0004 |
| Single, divorced, or widowed | –18.16 (–35.17 to –1.14) | –2.13 | .037 |
| Greater number of health problems | 6.80 (0.71-12.89) | 2.23 | .029 |
| Lower number of nonlipid-lowering drugs used | –8.67 (–14.30 to –3.03) | –3.08 | .003 |
| Higher baseline level of plasma LDL-C | 0.49 (0.27-0.71) | 4.45 | .00004 |
95%CI, 95% confidence interval; LDL-C, low-density lipoprotein cholesterol.
Studies of the effectiveness of stanols in combating hypercholesterolemia show wide variationin design, with differences in consumption duration, the product administered, sample size, and the epidemiological characteristics of the population. In the present study, daily ingestion of 2g of plant stanols was associated with a > 10% decrease in the plasma levels of LDL-C from baseline at both 3 months and 12 months of consumption. This 10% reduction in LDL-C could reduce cardiovascular disease risk.8,9,19
Our results match those of a recent meta-analysis evaluating the effects of phytosterols incorporated in 9 distinct food types and consumed for different durations.20 Previous studies with stanols administered in yogurt form have shown similar21 or inferior22 LDL-C and TC reductions to those of our study. A similar decrease has also been seen upon supplementation of other foods with stanols.23 As in previous studies, our study failed to show changes in HLD-C and triglycerides.12,21
Our study shows the long-term effects of stanols, whereas few previous studies exceeded 4 weeks and almost all of those studies were shorter than 2 months.24–26 In addition, this effect on LDL-C was demonstrated in a large sample of primary care patients with hypercholesterolemia treated according to standard clinical practice treatment guidelines adapted to the Spanish population. Moreover, the adverse effects seen after stanol consumption for 12 months were similar to those described elsewhere.18,24
Our results agree with the available evidence and suggest consideration of stanols in patients in primary prevention whose CVR does not justify statin administration27,28 and in those requiring simultaneous treatment with statins.6,28,29 Thus, stanols could be useful in both primary and secondary6 prevention to allow use of lower statin doses, avoiding their possible adverse effects.
Age and baseline LDL-C concentrations were associated here with a greater LDL-C reduction. Similar results have been found in various meta-analyses,22,30 although the effect of age was explained by the initial LDL-C values. In contrast, in our study, the effect of age was maintained after exclusion of baseline LDL-C from the regression model. These results could be related to the age distribution of our sample.
LimitationsOne of the limitations of our study is that changes in diet or statin use could alter the results; however, there were no significant changes in either parameter from baseline, so it is unlikely that the lipid profile reductions were due to dietary or statin changes. Moreover, there were no differences between the intervention and control groups in lipid-lowering agent use and diet. Another possible limitation is that stanol consumption could affect statin adherence, but previous studies have shown that daily stanol consumption does not modify adherence.31 The characteristics of the study setting could be a limitation restricting extrapolation of our results; however, the present study was a randomized clinical trial of dyslipidemic patients attending primary health care clinics, whose characteristics should be similar to those of other patients with hypercholesterolemia.
Given the demonstrated effectiveness of plant stanols in reducing TC and LDL-C concentrations after 12 months, new controlled studies of longer durations should be performed to determine the effectiveness of stanols in reducing the frequency of cardiovascular events,4 because no data are available on the effectiveness of stanols in preventing cardiovascular disease.9 Also required are new studies specifically designed to determine the factors associated with the degree of the LDL-C reduction following long-term stanol consumption. These studies of longer-term stanol consumption could also determine if the development of adverse effects is modified.9 Moreover, new studies are required that examine stanol adherence and possible associated factors, such as the type of food supplemented, the daily dose, and the number of doses per day.
CONCLUSIONSOur results show the effectiveness of plant stanols on LDL-C reduction in individuals with hypercholesterolemia: in this randomized and placebo-controlled study, daily ingestion of 2g of plant stanols for 12 months was associated with a higher decrease in plasma LDL-C than the consumption of stanol-free yogurt. This reduction exceeded 10% with respect to the baseline values at both 3 and 12 months of consumption and could be clinically relevant. Our results suggest that daily consumption of plant stanols can be considered in patients with hypercholesterolemia, given their effectiveness, adequate adherence, and few adverse effects.
FUNDINGThis study was funded by the FISCAM (Fundación para la InvestigaciónSanitaria en Castilla-La Mancha), resolution of December 23, 2009 (published in the Diario Oficial de Castilla-La Mancha on January 4, 2010). This grant allowed purchase of the yogurt products.
CONFLICTS OF INTERESTSNone declared.
The authors thank all patients and professionals that participated in this study.