
Machine learning in cardiology is becoming more commonplace in the medical literature; however, machine learning models have yet to result in a widespread change in practice. This is partly due to the language used to describe machine, which is derived from computer science and may be unfamiliar to readers of clinical journals. In this narrative review, we provide some guidance on how to read machine learning journals and additional guidance for investigators considering instigating a study using machine learning. Finally, we illustrate the current state of the art with brief summaries of 5 articles describing models that range from the very simple to the highly sophisticated.
Keywords
This narrative review considers the use of machine learning (ML) or artificial intelligence (AI) in cardiology publications with an emphasis on diagnostic models. In 2022, 1 in 60 cardiovascular disease publications in PubMed had ML or AI as a medical subject heading. Despite the abundance of articles, few diagnostic models have been validated or translated into practice. While this may be no worse than with other research avenues, there were high expectations that AI would revolutionize medicine. So, when will the revolution arrive?
As with many new technologies, ML in cardiology will go through the Gartner hype cycle—currently it is probably in the “Trough of disillusionment” and the field now needs to move up the “Slope of enlightenment” to the “Plateau of productivity”.1 To reach these next stages, 3 things need to happen. First, clinicians need to understand the language of AI and ML and what is being said, and not said, in the articles they read. Second, scientists and clinicians need improve on current study designs. Third, robust validation studies and translational research is needed to identify where and how ML will make daily medical practice more precise and productive.
This manuscript has been written from the perspective of a scientist most interested in how ML can improve diagnosis. It focuses on diagnostics, though much of the content could translate to other uses of ML.
AI is strictly a machine which continues to learn through a flow of data after the development of the initial model. This is extremely rare. ML and statistical models are those developed on a bounded data set. Almost all cardiology articles using the term, AI, are strictly ML or statistical models. At their core, whatever we call the method, they are attempting to improve prediction or classification.2 The appearance of ML and AI in the medical literature means clinicians and medical researchers are interacting with the culture and language of computer science even while the language of statistics is evolving. In time the languages may converge, but for now they confuse—both those reading the literature and those moving between disciplines. For the purposes of this article, a single term, ML will be used to encompass all that others call AI, ML, or statistics.
Statistics is a young discipline (it is only 120 years since the concept of a statistical hypothesis was introduced),3 and computer science is even younger. In the last 20 years, the processing power of computers has become sufficient for ML to enter mainstream and to drive the new discipline of data science (an amalgam of computer science and statistics). As with any young discipline, we should expect not only changes in language, but a turnover in key concepts. This should engender caution within disciplines, such as cardiology, which make use of statistics and computer science concepts. Difficulty arises when concepts transfer from one discipline to another and become axiomatic—an example is the concept of statistical significance, which is ubiquitous in medicine, but is now considered poor methodology by academic statisticians.4
The first section is aimed at all who read the medical literature. Differences in language between statistics and computer science used to describe diagnostic model or risk score development are discussed. In the second section, for those looking to incorporate ML in their research, additional concepts that need to be considered before investing the time and effort to develop new models are introduced. Finally, a few exemplar articles on ML in the cardiology literature are evaluated.
PART 1: HOW TO EVALUATE ML PAPERSTo understand an ML article, one must be familiar with the terms used. Table 1 translates computer science terms to statistics terms. The table is not exhaustive and many ML glossaries are available online.8 Understanding the specific methods used is important, but recognizing good science and good algorithm development methodology is also crucial, regardless of the ML techniques applied.
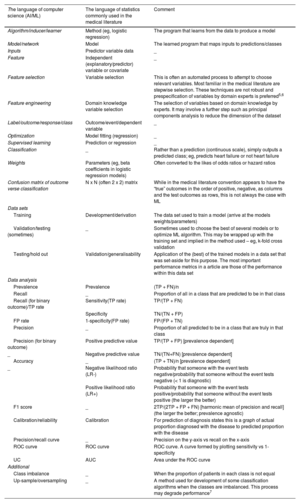
Common terms with a “translation” between computer science and statistical language
| The language of computer science (AI/ML) | The language of statistics commonly used in the medical literature | Comment |
|---|---|---|
| Algorithm/inducer/learner | Method (eg, logistic regression) | The program that learns from the data to produce a model |
| Model/network | Model | The learned program that maps inputs to predictions/classes |
| Inputs | Predictor variable data | _ |
| Feature | Independent (explanatory/predictor) variable or covariate | _ |
| Feature selection | Variable selection | This is often an automated process to attempt to choose relevant variables. Most familiar in the medical literature are stepwise selection. These techniques are not robust and prespecification of variables by domain experts is preferred5,6 |
| Feature engineering | Domain knowledge variable selection | The selection of variables based on domain knowledge by experts. It may involve a further step such as principal components analysis to reduce the dimension of the dataset |
| Label/outcome/response/class | Outcome/event/dependent variable | _ |
| Optimization | Model fitting (regression) | _ |
| Supervised learning | Prediction or regression | _ |
| Classification | _ | Rather than a prediction (continuous scale), simply outputs a predicted class; eg, predicts heart failure or not heart failure |
| Weights | Parameters (eg, beta coefficients in logistic regression models) | Often converted to the likes of odds ratios or hazard ratios |
| Confusion matrix of outcome verse classification | N x N (often 2 x 2) matrix | While in the medical literature convention appears to have the “true” outcomes in the order of positive, negative, as columns and the test outcomes as rows, this is not always the case with ML |
| Data sets | ||
| Training | Development/derivation | The data set used to train a model (arrive at the models weights/parameters) |
| Validation/testing (sometimes) | _ | Sometimes used to choose the best of several models or to optimize ML algorithm. This may be wrapped up with the training set and implied in the method used – eg, k-fold cross validation |
| Testing/hold out | Validation/generalisability | Application of the (best) of the trained models in a data set that was set-aside for this purpose. The most important performance metrics in a article are those of the performance within this data set |
| Data analysis | ||
| Prevalence | Prevalence | (TP + FN)/n |
| Recall | _ | Proportion of all in a class that are predicted to be in that class |
| Recall (for binary outcome)/TP rate | Sensitivity(TP rate) | TP/(TP + FN) |
| Specificity | TN/(TN + FP) | |
| FP rate | 1-specificity(FP rate) | FP/(FP + TN) |
| Precision | _ | Proportion of all predicted to be in a class that are truly in that class |
| Precision (for binary outcome) | Positive predictive value | TP/(TP + FP) [prevalence dependent] |
| _ | Negative predictive value | TN/(TN+FN) [prevalence dependent] |
| Accuracy | _ | (TP + TN)/n [prevalence dependent] |
| _ | Negative likelihood ratio (LR-) | Probability that someone with the event tests negative/probability that someone without the event tests negative (< 1 is diagnostic) |
| Positive likelihood ratio (LR+) | Probability that someone with the event tests positive/probability that someone without the event tests positive (the larger the better) | |
| F1 score | _ | 2TP/(2TP + FP + FN) [harmonic mean of precision and recall] (the larger the better; prevalence agnostic) |
| Calibration/reliability | Calibration | For prediction of diagnosis states this is a graph of actual proportion diagnosed with the disease to predicted proportion with the disease |
| Precision/recall curve | _ | Precision on the y-axis vs recall on the x-axis |
| ROC curve | ROC curve | ROC curve. A curve formed by plotting sensitivity vs 1-specificity |
| UC | AUC | Area under the ROC curve |
| Additional | ||
| Class imbalance | _ | When the proportion of patients in each class is not equal |
| Up-sample/oversampling | _ | A method used for development of some classification algorithms when the classes are imbalanced. This process may degrade performance7 |
AUC, area under the curve; FN, false negative; FP, false positive; n, sum of TP, TN, FP, FN; ROC curve, receiver operator characteristic curve; TN, true negative; TP, true positive.
ML articles can be grouped into 3 categories: identifying associations between input variables and an outcome, illustrating the potential of a technique, or developing a model to change practice. Sometimes, articles combine these goals. An article may claim to develop a diagnostic model but also discuss causal relationships, which is not necessary for the model to be clinically useful. Often, there is no attempt to show that the developed model is better than current methods. This does not invalidate the study, but it should be recognized that the model is in an early stage of development and is not ready for implementation.
Q2: What is the cohort/from where does the data come?If the study population does not reflect the population in which the model will be applied, the algorithm may be biased. This is known as spectrum bias (see Tseng et al.9 for a cardiology example). Readers should pay special attention to how race, age, and ethnicity are dealt with. For example, the American Heart Association risk score for mortality in heart patients assigns lower risk to black patients,10 which may lead to less intervention, and this can embed systematic inequities in society and health care systems.
Q3. What is the outcome?When evaluating the usefulness of a model, it is important to consider if it is prognosticating something clinically meaningful and if its outcome would affect treatment or investigation decisions. Additionally, consider if the model is diagnosing something that is otherwise difficult to diagnose at the time it is expected to be applied. These are the important “so what?” questions.
Additionally, note if the model classifies (assign to a class, eg, whether a patient has heart failure or not) or provides a probability of a patient being in a particular class (eg, a patient has a 31.4% probability of having heart failure). A prediction may then turn into a classification by application of a threshold. An example of a classifier is a decision tree, and a method capable of giving probabilities is logistic regression. The ML literature does not always distinguish between the 2 types and may, for example, call logistic regression a classifier by applying a threshold (often arbitrarily at a probability of 50%).
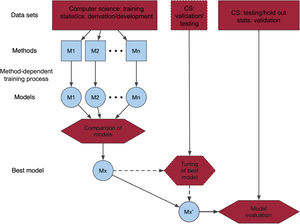
Q4. What is the machine learning method used and why?The choice of ML method often appears arbitrary and is often not justified. Recent successful methods for similar problems may be the reason for choosing a particular method. Where several methods are considered, a process using a training and/or testing data set may be used to create the best ML model (figure 1). The exact process can vary, and the reader will come across descriptions which may be quite complex, often relegated to a supplement, such as feature selection, cross validation (K-fold, leave-one-out, bootstrapping), and hyperparameter tuning to control the learning process. A difficulty that a clinical reader may face is not knowing how well the article has been refereed from a computer science (or statistical) methodological perspective. Editors could help by indicating the types of reviewers of an article.
, temporally different from the other data set(s), or randomly chosen from the same data source as the other data set(s). CS, computer science; M1, model 1; M2, model 2; Mn, model n.")
Central illustration. Schematic of process of developing and validating a machine learning model. One or several models are trained/derived and compared using different methods. The best model, Mx, may then undergo some further validation or tuning of parameters. The final model is validated in a data set that may be external (from other sources), temporally different from the other data set(s), or randomly chosen from the same data source as the other data set(s). CS, computer science; M1, model 1; M2, model 2; Mn, model n.
The most crucial metrics for evaluating ML are those for the validation cohort with the chosen “best” model. Readers may also encounter metrics used to compare models. Some of these are discussed in the section for model developers below.
Diagnostic metricsFor diagnostic and risk classification, the receiver operator characteristic (ROC) plot and the associated area under the ROC curve (AUC) are the most commonly used metrics. However, they should not be used on their own or without further interpretation.
The ROC plot is a curve created by evaluating diagnostic performance at all possible outcome thresholds (probabilities for ML). The sensitivity and specificity are calculated at each threshold. The ROC plot is the curve formed on a sensitivity vs 1-specificity grid, and the AUC is the area under that curve. It is often assumed that the main diagonal represents a coin toss and that only values on the curve above that diagonal are useful. This, though, is incorrect.11 Only the point in the middle of the diagonal (0.5, 0.5) is equivalent to a fair coin toss. Other points may contain diagnostically useful information depending on the prevalence. For example, the point 0.0 at the bottom left is equivalent to saying all diagnostic test results are negative, which in a low prevalence population has a probability much greater than 0.5 (equal to 1-prevalence).
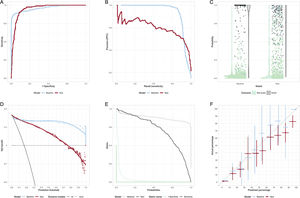
The AUC may be interpreted as the probability that if one randomly drew the model outputs for a patient who had the outcome of interest and for another who did not, that the patients who had the outcome of interest had a greater output value than the patient who did not. In this light, it is difficult to understand why the AUC has become such a popular metric to describe the model performance. Figure 2A illustrates how 2 models with identical AUCs (0.94) can have different ROC curves. If the clinical situation is such that the cost of missing a diagnosis is very high, then the curve with the highest sensitivity at high specificity would be the preferred model.
 curves of 2 models with identical areas under the ROC curve. B: precision-recall curve. The baseline model is best at highest precision, but for recall> 0.92 the new model has best precision. C: scatter and violin plots. The bar on the violin plot is at the median probability for the model. An alternative is a box-and-whiskers plot. D: decision curve/net benefit curve. The greater the net benefit the better. Usually illustrate only over prediction thresholds of clinical relevance. In this case, the baseline model is better than the new model except at low (< 0.15) probabilities. E: risk assessment plot. The closer the teal curves are to the bottom left, the better the model is at assigning low probabilities to those without the outcome. The closer the black curves to the top right, the better the model is at assigning high probabilities to those with the outcome. In this case, the new model improves on the baseline for those without the outcome, but for probabilities> 0.2 it is worse than the baseline model. F: calibration plot. Ideally all points are along the diagonal line, indicating that predicted risk accurately reflects the actual risk. 95% confidence intervals are shown.")
A: receiver operator characteristic (ROC) curves of 2 models with identical areas under the ROC curve. B: precision-recall curve. The baseline model is best at highest precision, but for recall> 0.92 the new model has best precision. C: scatter and violin plots. The bar on the violin plot is at the median probability for the model. An alternative is a box-and-whiskers plot. D: decision curve/net benefit curve. The greater the net benefit the better. Usually illustrate only over prediction thresholds of clinical relevance. In this case, the baseline model is better than the new model except at low (< 0.15) probabilities. E: risk assessment plot. The closer the teal curves are to the bottom left, the better the model is at assigning low probabilities to those without the outcome. The closer the black curves to the top right, the better the model is at assigning high probabilities to those with the outcome. In this case, the new model improves on the baseline for those without the outcome, but for probabilities> 0.2 it is worse than the baseline model. F: calibration plot. Ideally all points are along the diagonal line, indicating that predicted risk accurately reflects the actual risk. 95% confidence intervals are shown.
Figure 2 illustrates some less common diagnostic plots that may appear in the medical literature. The precision/recall (positive predictive value [PPV]/sensitivity) is common in computer science. It can be used to choose between models at desired levels of PPV or sensitivity (figure 2B). Figure 2C is a violin plot. In this case, it shows that the baseline model has more very high probabilities for those with the event. The net benefit curve (decision curve), figure 2D, shows that, for the situation where false negatives and false positives are evenly weighted, there is net benefit in using the new model only where a prediction threshold of <0.1 is applied. The risk assessment plot, figure 2E, illustrates that the difference in performance between the baseline and new model is a result of a small improvement in the lowering of the probability of those without the event (the solid teal, “1-specificity”, curve for the new model moves nearer the bottom left compared with the dotted baseline model), but a large, inappropriate, lowering of probability for those with the event (the solid sensitivity curve moves toward the lower left for the new model, rather than the top right, compared with the baseline model).
Some ML models report accuracy, the proportion of true positives and true negatives in the cohort, but this is not a useful measure in typical clinical situations where prevalence is low. For example, one could stand at the door of a hospital and turn away everyone with chest pain. The accuracy for diagnosis of myocardial infarction is likely to be 90% or more. Unfortunately, the sensitivity is 0% and one would be out of a job, in jail, or worse.
For classification models, common metrics include sensitivity, negative predictive value (NPV), specificity and PPV (see table 1). To generate these metrics, it is important to choose, by consensus among clinicians, clinically meaningful threshods.12 When there are differences in prevalence between training, test, and validation data sets, NPV and PPV should not be compared as these vary with prevalence. Accompanying these may be the negative and positive likelihood ratios (LR-, LR+) which are robust against prevalence. These ratios indicate if the test adds any diagnostic value. Data scientists may also report the F1 score.
All metrics should be reported with a confidence interval and it is important to consider both bounds when interpreting results.13 The point estimate is only one of many possible values the underlying population could take. The null value may lie within the confidence interval, but, contrary to what is often stated, this does not mean the test is not useful. For example, if the LR- (95% confidence interval) is 0.80 (0.55-1.05), and if LR- <0.9 is considered clinically meaningful then, in this case, values from 0.6 to 0.9 are all more likely than the null. For diagnostic algorithms, a particular bound may be important from a safety or utility perspective; eg, the lower bound for sensitivity is most important for assessing safety.
Importance of calibrationCalibration is important, yet often missing in analysis.14 Goodness of fit tests (eg, the Hosmer-Lemonshow test), are much less informative than a calibration plot of the actual proportion with the outcome vs the predicted portion with the outcome, figure 2F. Models which discriminate may have poor calibration, which limits their usefulness. Check calibration curves at the probabilities of interest. For example, when the predicted rate is 3%, but the actual rate is 6%, then this could result in a clinically relevant underestimation of risk in a very large proportion of people in whom it is applied.
Q6. How are bias and equity handled?In addition to assessing how the article has handled possible spectrum bias, consider if evidence is provided on the performance of the model in specific subgroups known to face inequity in the population. For example, are performance metrics given for an indigenous population? When looking at such data, be aware that confidence intervals will be wider where numbers are low and take care not to interpret the model as “not working” in specific populations because of this.
Further literatureUseful articles for understanding ML are those by Marteen van Smeden,15 Sebastian Vollmer from the Alan Turing institute,16 and Google Alphabet ML expert Yun Liu.17 Van Smeeden et al. start with the question “Is a new prediction model really needed?” Vollmer's first question relates to patient benefit. Where the researchers have not been “cognisant of the path from development to implementation” the manuscript may not pass the “so what?” test. In Yun Liu's article on how to read ML articles they state “clinical gestalt plays a crucial role in evaluating whether the results are believable: because one of the biggest strengths of ML models is consistency and the lack of fatigue, a useful check for believable ML results is whether an experienced expert could reproduce the claimed accuracy given an abundance of time.” Finally, if a formal tool is wanted for assessing risk of bias in a prediction model, then I suggest the PROBAST tool.18,19
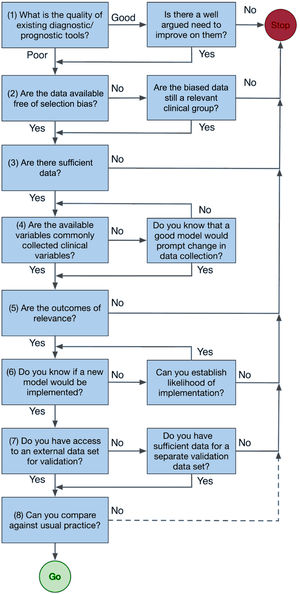
PART 2: HOW TO UNDERTAKE RESEARCH WITH MLThe heuristic, figure 3, is a brief guide to reaching a decision on the viability of a study.
- (1)
Before developing a new model, assess the quality of existing tools and determine if they can answer your research question, then assess the availability of relevant data. To pass the “so what?” test, survey those most affected by the introduction of a new tool, including patients, clinical staff, and health system management. Perhaps adopt “co-design” principles. These go a step further than consultation and ensure those most affected receive a “product” meaningful to them. For example, in New Zealand codesign is being used to reduce inequities for Māori in the delivery of cardiac health. By going first to Māori communities with a very limited agenda, the researcher acknowledges the primacy of the community and individual to make choices about their own health. The research may, for example, find the community has little interest in the probabilities of the proposed model, but instead suggests something different. Notably, the United States’ “Blueprint for an AI Bill of Rights” adopts a similar approach with its first principal, which states that “Automated systems should be developed with consultation from diverse communities, stakeholders, and domain experts to identify concerns, risks, and potential impacts of the system”.20
- (2)
Assess the suitability of available data. Large, routinely collected data sets may have limitations, such as missing clinically relevant material or clinical outcome data biased because it is primarily used for financial purposes. To avoid selection bias, consider the target patient group and assess the potential data sets for bias. If the data exclude certain patient groups, the developed model will be limited in relevance and may bias treatment against those groups, especially if they are at higher risk. For example, a heart failure prediction model developed primarily on non-Māori may underpredict events in Māori, perpetuating inequities.
- (3)
To establish sufficient data rules of thumb of 10 to 20 (minimum) outcome events per variable have been popularized, but Richard Riley's recent work provides tools to make a priori calculations which inform the maximum number of variables in a model.21–23 If some variable data are missing, imputation is accepted as better than discarding data incomplete patients because it reduces the risk of bias and reduces uncertainties in final estimates. However, there is a need to assess first if the data are missing at random.24–28
- (4)
Stepwise methods of variable selection, which use arbitrary P value thresholds to reduce the number of variables, are outdated and can result in biased and poorly transferable models.5,6 The starting point for variable selection is to consult experts to determine the commonly collected predictors in clinical practice.29 If the model relies on variables that are only accessible retrospectively, there needs to be a strong reason for inclusion, as it would also require their prospective collection for the model's future use.

In the past, perhaps because of the need for simple algorithms able to be used at the bedside, continuous variables like age and systolic blood pressure were dichotomized. This process discards information and is unnecessary with today's technology.30
- (5)
Model outcomes must be relevant to the model users. For example, if the aim is to develop an in-hospital prediction model for cardiologists, is this of relevance to the cardiologist and what level of improvement over current predictions would be of use?
- (6)
Changing clinical practice is difficult, yet it is the implied goal of all ML. Before undertaking ML research, establish the need for the model and the barriers to implementation. These may include the likes of the “black-box” nature of some ML, management priorities, and IT resources. Codesign may help overcome such barriers.
- (7)
An external validation data set is not strictly required and there are good internal validation techniques that should always be applied. Best practice will avoid data-splitting for smaller data sets.31,32 However, generalizability is still best assessed with external data sets. Identify these prior to model development and choose the largest data set to be the development data set.
- (8)
Finally, if the exercise is to be more than an academic one, it must be compared with standard practice. While not doing so is not fatal, it certainly means a model is much less likely to be adopted by others.
While diagnosis involves classification, ML models do not have to output a classification. A model that produces a probability output may be more informative. Logistic regression can be thought of as a baseline algorithm that is easy to implement and interpret. Ensemble models such as random forests or gradient boosting can improve on simple logistic regression. This is the familiar wisdom of the crowd. There are several forms of ensemble models by combining multiple models or using bootstrapping. A recent survey of methods can be found in Sagi and Rokach.33
ReportingIt is important to report how the “best” model for validation was chosen and the methodology for this should be prespecified. It need not be based on the AUC. As figure 1 illustrates, there are other considerations depending on the intended purpose of the model. This includes calibration. Metrics that should be considered include log-likelihood, Brier skill (the relative change in Brier score from a baseline model), Nagelkerk's R2, and the integrated discrimination improvement reported separately for those with and without events. If the intended use does not include presenting predicted probabilities, then the best model may be the one that has the highest specificity for a prespecified minimum sensitivity (for identifying low-risk patients) or vice versa (for identifying high-risk patients).
The primary outcome measures are both the discrimination (predefined) and calibration in the validation cohort of the best model. These must be reported in the abstract along with a confidence interval.
PART 3: EXAMPLES OF ML IN CARDIOLOGYMyocardial infarction decision support in the emergency departmentTroponin is the strongest predictor of a myocardial infarction (not surprisingly as it is also part of the definition) on presentation to the emergency department. Troponin concentrations are also associated with age and sex, both of which are also associated with myocardial infarction. The kinetics of high-sensitivity troponin, and in particular the rate of change, are also related to the outcome.34
Decision support tools for risk stratification in the emergency department have been constructed from one person's expert opinion (HEART), have used scores developed for other purposes (ADAPT), have developed a fit-for-purpose score using logistic regression (EDACS), and have used simple decision trees based on a single variable, namely the troponin result.35–39 Application of ML that can provide support via providing predicted probabilities is new. Body et al.40 T-MACS combined high-sensitivity troponin with electrocardiogram, vomiting, sweating and the nature of the pain in a logistic regression in 2017, which outputs a myocardial infarction probability. Discrimination was high (0.90 in the external validation data set) and a threshold chosen to aid decision-making meant that the model could be applied clinically with a high degree of safety (very high sensitivity). Performance at the threshold was good and the model has been implemented in the Greater Manchester region of the United Kingdom.41 No calibration was provided, and the algorithm was not well calibrated in a further external validation.42 This indicates the need for recalibration prior to application in new settings.
Than et al.43 evaluated an ML model in a large international data set developed by Abbott diagnostics that used a very simple feature set: age, sex, 2 troponin measurements, and the time between the 2 measurements. The model had been developed using gradient boosting, had high-discrimination, and was well calibrated in the validation data set. It was not compared against other models. In a further external validation, discrimination remained high and performance metrics at thresholds remained good.44 However, the model underpredicted myocardial infarction at prediction values <50%. Again, this points to the importance of checking calibration for each cohort in which a model is likely to be applied.
Heart failure diagnosisML models have been developed for heart failure diagnosis and have been summarized in 2 systematic reviews.45,46 These reviews highlight the diverse range of both situations, in which ML is thought to be of use, and the techniques employed. For instance, convoluted neural networks are used to enhance pathologists’ reading of whole-slide biopsy images,47 various methods predict readmission but with poor discrimination,48 and deep neural networks used demographic and electrocardiogram features to identify heart failure show good discrimination, but no comparison to current methods.49
Two notable ML cardiology articles display the features of quality model development and assessment. The first, by Dana Sax et al.,50 aimed to improve 30-day adverse event prediction in patients presenting to emergency departments with acute heart failure. They compared an existing tool, STRATIFY, with their ML model made with 13 variables from STRATIFY and 58 possible additional variables. Data were divided into test (20%) and development (80%) data sets with simple imputation for missing variables and 10-fold cross validation for hyperparameter tuning. Model assessment was, overall, by the AUC, ROC and calibration curves. Precision/recall curves were also presented and, at prespecified risk thresholds, sensitivity, specificity, negative and positive likelihood ratios, PPV, NPV and F1 score. Across all thresholds net reclassification was used to compare a logistic regression model with an XGBoost model. The authors thoroughly discussed the limitations, including possible bias from its retrospective nature, and future plans around implementation. They demonstrated improvement with an ML model over STRATIFY (AUC, 0.76 cf 0.68). While using only the AUC for overall comparison is limiting, and an AUC of 0.76 may not be sufficient to precipitate a change of practice, the detailed assessment of performance at clinically relevant thresholds mitigated this limitation. The other limitation is there is no assessment of performance in key demographics.
The second, by Kuan Lee et al.,51 used research data from 14 studies and 13 countries with adjudicated outcomes to develop and validate a model to aid decision support for the diagnosis of heart failure. The data sets were identified using a systematic review methodology including assessment for risk of bias. Four ML models were developed using multiply imputed data sets. Validation involved treating each of the 14 data sets as an external data set (without imputation) and using the remaining data sets for model development. Several criteria including calibration, Brier score, AUC, and proportions of patients above and below specified probability criteria were used to judge model performance. Additionally, decision curves (published in the supplement) were produced. Diagnostic performance was assessed for a wide range of demographic subgroups. The limitations of the study were well addressed, particularly acknowledging the possibility of selection bias as 16 of the 30 studies eligible for inclusion did not participate. This was another excellent study, with few weaknesses. One, the use of NPV and PPV to compare patient subgroups, rather than sensitivity and specificity, is to be avoided because the differences in these metrics may be driven by difference in the prevalence of heart failure in each subgroup rather than true differences in model performance.
Coronary artery disease probabilityForrest et al.52 developed an ML from electronic health records to use as an in-silico marker of coronary artery disease producing a probability of coronary artery disease. Training and validation were conducted in a United States cohort, and external testing in a United Kingdom cohort. The AUC was the principal diagnostic metric. Sensitivity, specificity, accuracy, PPV and NPV were also reported, but there is no indication of the threshold used to determine these later metrics. This is an example of the difficulty with computer science language not being familiar to clinical readers, as it is commonplace within computer science to use a probability of 0.5 as a classification threshold. However, if this was the case in this article, it should have been reported. Also missing was a calibration plot. Brier scores were referred to, but these are inadequate and noninformative on their own. Not referred to in the article was a precision-recall curve and calibration plot shown in the appendix. The latter showed the algorithm overpredicted the probability of coronary artery disease for all but the highest predictions. A very positive feature of the study was the demonstration of the association of the probabilities with coronary artery stenosis and all-cause death. There was no comparison with other prediction models.
SUMMARYWhile the age of ML is upon us, it has not yet been translated into practice. This is partly because there is a learning curve among decision makers to understand what constitutes a well executed ML study. Here I have attempted to provide some translation between the language of computer science and the more familiar language of the medical statistician and have then highlighted some useful metrics and graphical tools to evaluate ML models. Finally, I identified some studies demonstrating different elements of ML in cardiology.
FUNDINGThe author is supported by charitable donations to the Christchurch Heart Institute and the Emergency Care Foundation, both of Christchurch New Zealand.
CONFLICTS OF INTERESTThe author declares no conflict of interest.