There is a paucity of data regarding the differences in the biomarker profiles of patients with obesity, metabolic syndrome, and diabetes mellitus as compared to a healthy, normal weight population. We aimed to study the biomarker profile of the metabolic risk continuum defined by the transition from normal weight to obesity, metabolic syndrome, and diabetes mellitus.
MethodsWe performed a pooled analysis of data from 7 cross-sectional Spanish population-based surveys. An extensive panel comprising 20 biomarkers related to carbohydrate metabolism, lipids, inflammation, coagulation, oxidation, hemodynamics, and myocardial damage was analyzed. We employed age- and sex-adjusted multinomial logistic regression models for the identification of those biomarkers associated with the metabolic risk continuum phenotypes: obesity, metabolic syndrome, and diabetes mellitus.
ResultsA total of 2851 subjects were included for analyses. The mean age was 57.4 (8.8) years, 1269 were men (44.5%), and 464 participants were obese, 443 had metabolic syndrome, 473 had diabetes mellitus, and 1471 had a normal weight (healthy individuals). High-sensitivity C-reactive protein, apolipoprotein B100, leptin, and insulin were positively associated with at least one of the phenotypes of interest. Apolipoprotein A1 and adiponectin were negatively associated.
ConclusionsThere are differences between the population with normal weight and that having metabolic syndrome or diabetes with respect to certain biomarkers related to the metabolic, inflammatory, and lipid profiles. The results of this study support the relevance of these mechanisms in the metabolic risk continuum. When metabolic syndrome and diabetes mellitus are compared, these differences are less marked.
Keywords
Despite the lower rates of cardiovascular morbidity and mortality found in southern Europe,1 cardiovascular disease is the leading cause of morbidity and mortality in Spain.2
Obesity,3 the metabolic syndrome (MS),4 and diabetes mellitus (DM)5 are epidemic in Spain and the industrialized countries, and are associated with morbidity and mortality.6 We are now aware of the importance of adipose tissue in metabolic homeostasis7 and of the fact that its accumulation leads to chronic inflammation and an increase in numerous adipocytokines, such as interleukin 6, monocyte chemotactic protein-1, tumor necrosis factor-α, and leptin, with a decrease in adiponectin. All these changes contribute to insulin resistance and leptin resistance8 and induce the development of dyslipidemia, hypertension, and changes in carbohydrate metabolism, which together constitute MS,9 and, finally, the onset of DM.10 The profiles of inflammatory, metabolic, and other types of biomarkers have not been studied systematically in individuals with obesity, MS, and DM, for comparison with those of healthy individuals.
The main objective of the DARIOS Inflammatory study is to characterize a broad biomarker profile (metabolic, inflammatory, hemodynamic, hemostatic, and myocardial damage) in the metabolic risk continuum defined as the transition from normal weight to obesity, MS, and DM in a Mediterranean population.
METHODSStudy Design and PopulationWe carried out a cross-sectional study based on a cluster analysis of 21 038 individuals recruited in 7 population-based studies performed in Spain from 2000 onward: the CDC (Canary Islands),11 DRECA-2 (Andalusia),12 HERMEX (Extremadura),13 RECCyL (Castile and León),14 REGICOR (Catalonia),15 RIVANA (Chartered Community of Navarre),16 and TALAVERA (CastileLa-Mancha]).17 All of these studies employed a similar methodology, which has been reported previously.5
For this study, we defined 4 phenotypes and randomly selected 464 participants with obesity (without MS or DM), 443 with MS, 473 with DM, and 1471 healthy individuals (nonobese). All of the participants were informed of the objectives and signed a consent form. The DARIOS study was approved by the Clinical Research Ethics Committee of Parc de Salut Mar in Barcelona, Spain (authorization no.: 2009/3640).
Determinations and Definition of the Phenotypes of InterestThe questionnaires used in the constituent studies were based on standardized surveys designed by the World Health Organization.18
We measured the waist circumference and determined the height and weight of all participants using calibrated scales and stadiometers. The body mass index (BMI) was calculated and obesity was defined as a BMI ≥ 30.19 Abdominal obesity was defined as a waist circumference > 102cm in men and > 88cm in women, in accordance with Adult Treatment Panel III.20
MS was diagnosed when 3 of the following 5 criteria were detected21: fasting glucose level ≥ 100mg/dL or antidiabetic therapy; systolic blood pressure ≥ 130mmHg or diastolic blood pressure ≥ 85mmHg; high-density lipoprotein cholesterol < 40mg/dL in men and < 50mg/dL in women; triglyceride levels ≥ 150mg/dL and/or a waist circumference ≥ 102cm in men and > 88cm in women. Patients with a previous diagnosis of DM were not included.
DM was defined by a previous diagnosis and the use of oral antidiabetic drugs or insulin, or by fasting glucose levels ≥ 126mg/dL.
Determination of Biomarkers: Laboratory MethodsBlood samples were collected after at least a 10h fast, and the aliquots were stored at –80°C (maintenance of the cold chain was guaranteed in every case). Determination of all the biomarkers was carried out at the IMIM (Instituto Hospital del Mar de Investigaciones Médicas) in Barcelona, Spain. We studied analytes related to carbohydrate metabolism (glucose and insulin), lipid profile (total cholesterol, high-density lipoprotein cholesterol, low-density lipoprotein cholesterol, triglycerides, and apolipoproteins A1 and B100), metabolic status (adiponectin and leptin), inflammation (high-sensitivity C-reactive protein [hs-CRP], interleukin 6, interleukin 10, tumor necrosis factor-α, interferon-γ, monocyte chemotactic protein-1), hemostasis (plasminogen activator inhibitor), oxidation (anti-oxidized low-density lipoprotein antibodies), hemodynamics (B-type natriuretic peptide), and myocardial damage (troponin I).
Glucose, total cholesterol, and triglycerides were analyzed using enzymatic methods and high-density lipoprotein cholesterol levels, with a direct method involving accelerator selective detergent (HORIBA-ABX Diagnostics, France), in a PENTRA-400 analyzer (HORIBA-ABX Diagnostics). The low-density lipoprotein cholesterol level was calculated by means of the Friedewald formula (if the triglyceride level was < 300mg/dL). The hs-CRP concentration and apolipoproteins A1 and B100 were determined by immunoturbidimetry (HORIBA-ABX, Diagnostics) in a PENTRA-400 analyzer (HORIBA-ABX Diagnostics). B-type natriuretic peptide and troponin I were analyzed using a microparticle enzyme immunoassay (Abbott, United States) in an AxSYM analyzer (Abbott). Interleukin 6, interleukin 10, tumor necrosis factor-α, interferon-γ, monocyte chemotactic protein-1, adiponectin, leptin, insulin, and plasminogen activator inhibitor-1 were analyzed in duplicate using Luminex xMAP® technology in a BioPlex system (Bio-Rad, Hercules, California, United States). Anti-oxidized low-density lipoprotein antibodies were assessed in duplicate by ELISA (Enzyme-Linked ImmunoSorbent Assay) (Biomedica, Austria). The Homeostasis Model Assessment (HOMA) index was calculated using the formula (insulin × 0.024 × glucose) / 22.5. The coefficient of variation for the immunoturbidimetric assays (apolipoproteins A1 and B100 and hs-CRP) ranged between 1.62% and 2.00% for the microparticle enzyme immunoassay, between 10.89% and 15.00% for enzyme-linked immunosorbent assay, and from 6.70% to 15.51% for the Luminex assays.
Sample Size CalculationFor the calculation of the sample size, we assumed that the percentage of healthy participants with biomarker levels below the limit of detection would not be < 15% nor >80%. With 1400 participants of normal weight and 450 in each of the other 3 metabolic risk groups (obesity, MS, and DM), the statistical power for the detection as statistically significant of an odds ratio ≥ 1.5 between any 2 of the metabolic risk groups defined here would be 80%.
Statistical AnalysisThe biomarkers analyzed here with a distribution that departed from the assumption of normality were transformed using the natural logarithm. In those with values above or below the limit of detection: a) if the proportion of participants was > 5%, they were categorized by grouping them according to the following criterion: the values beyond the limits of detection formed one group and the remaining values were grouped in tertiles or quartiles, depending on the number of participants below (or above) the limits of detection, and b) if the proportion of individuals in this group was < 5%, they were assigned a standard biomarker value, calculated as a fraction of the limits of detection: 0.99 × value of the lower limit of detection if they were lower, or 1.01 × value of the upper limit of detection if they were higher than this limit.
For the bivariate comparisons of the 4 groups, we used the chi-square test for trend for the categorical variables and the Pearson correlation for the continuous variables.
Multinomial logistic regression models were adjusted for the 4 groups, using the category “healthy” as a reference. The explanatory variables of interest were the biomarkers of the metabolic and inflammatory profiles. The models were also adjusted for age and sex. We retained only those biomarkers that had at least 1 category associated with at least 1 metabolic risk group. The level of significance was set at P = .01 to take into account multiple comparisons. The results are expressed as the odds ratio and 95% confidence interval.
We used backward elimination, introducing all the biomarkers analyzed in the model, and proceeded to eliminate those whose exclusion did not significantly modify the change in the plausibility of the model, that is, when P > .01, as was mentioned above. To ensure that we had not eliminated any important biomarker, those eliminated in the previous process were added to the final model (forward selection), retaining in the final model those with which we achieved statistical significance in terms of plausibility.
The area under the ROC (receiver operating characteristic) curve was employed to assess the discrimination.
We examined the first-order interactions between each biomarker and sex in relation to the 4 groups studied. To avoid any problems related to multiple comparisons, the P value was corrected using Bonferroni adjustment, and a value of .0033 was set as the threshold for considering statistical significance.
The analyses were carried out with R software version 3.0.1 (R Foundation for Statistical Computing; Vienna, Austria).
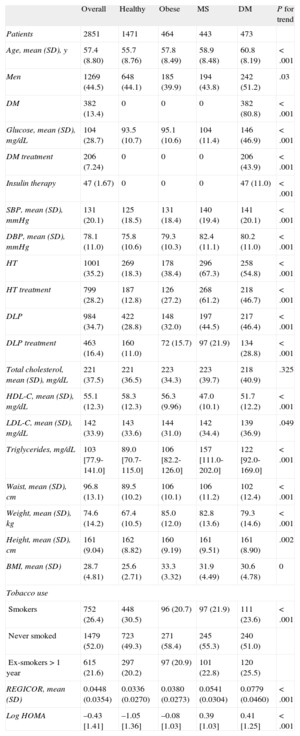
RESULTSThe study population consisted of 2851 patients, with a mean age (standard deviation) of 57.4 (8.8) years; 1269 (44.5%) of the participants were men. Table 1 shows the baseline characteristics of the patients in the 4 phenotypic groups, defined by: a) normal weight (with no evidence of MS or DM); b) obesity (with no evidence of MS or DM); c) MS, and d) DM. We observed a progressive and significant trend toward the development of more cardiovascular risk factors, except for the reduction in tobacco use, with an increase in coronary risk, according to the REGICOR equation (the Framingham equation calibrated for the Spanish population), as individuals in the healthy group entered the MS and DM groups. The general characteristics of the DARIOS Inflammatory study and of each of its components are provided in Table S1(supplementary material).
Sociodemographic and Clinical Characteristics of the Participants in the DARIOS Inflammatory Study, Divided Into Four Groups According to the Different Metabolic Disorders of Interest
| Overall | Healthy | Obese | MS | DM | P for trend | |
| Patients | 2851 | 1471 | 464 | 443 | 473 | |
| Age, mean (SD), y | 57.4 (8.80) | 55.7 (8.76) | 57.8 (8.49) | 58.9 (8.48) | 60.8 (8.19) | < .001 |
| Men | 1269 (44.5) | 648 (44.1) | 185 (39.9) | 194 (43.8) | 242 (51.2) | .03 |
| DM | 382 (13.4) | 0 | 0 | 0 | 382 (80.8) | < .001 |
| Glucose, mean (SD), mg/dL | 104 (28.7) | 93.5 (10.7) | 95.1 (10.6) | 104 (11.4) | 146 (46.9) | < .001 |
| DM treatment | 206 (7.24) | 0 | 0 | 0 | 206 (43.9) | < .001 |
| Insulin therapy | 47 (1.67) | 0 | 0 | 0 | 47 (11.0) | < .001 |
| SBP, mean (SD), mmHg | 131 (20.1) | 125 (18.5) | 131 (18.4) | 140 (19.4) | 141 (20.1) | < .001 |
| DBP, mean (SD), mmHg | 78.1 (11.0) | 75.8 (10.6) | 79.3 (10.3) | 82.4 (11.1) | 80.2 (11.0) | < .001 |
| HT | 1001 (35.2) | 269 (18.3) | 178 (38.4) | 296 (67.3) | 258 (54.8) | < .001 |
| HT treatment | 799 (28.2) | 187 (12.8) | 126 (27.2) | 268 (61.2) | 218 (46.7) | < .001 |
| DLP | 984 (34.7) | 422 (28.8) | 148 (32.0) | 197 (44.5) | 217 (46.4) | < .001 |
| DLP treatment | 463 (16.4) | 160 (11.0) | 72 (15.7) | 97 (21.9) | 134 (28.8) | < .001 |
| Total cholesterol, mean (SD), mg/dL | 221 (37.5) | 221 (36.5) | 223 (34.3) | 223 (39.7) | 218 (40.9) | .325 |
| HDL-C, mean (SD), mg/dL | 55.1 (12.3) | 58.3 (12.3) | 56.3 (9.96) | 47.0 (10.1) | 51.7 (12.2) | < .001 |
| LDL-C, mean (SD), mg/dL | 142 (33.9) | 143 (33.6) | 144 (31.0) | 142 (34.4) | 139 (36.9) | .049 |
| Triglycerides, mg/dL | 103 [77.9-141.0] | 89.0 [70.7-115.0] | 106 [82.2-126.0] | 157 [111.0-202.0] | 122 [92.0-169.0] | < .001 |
| Waist, mean (SD), cm | 96.8 (13.1) | 89.5 (10.2) | 106 (10.1) | 106 (11.2) | 102 (12.4) | < .001 |
| Weight, mean (SD), kg | 74.6 (14.2) | 67.4 (10.5) | 85.0 (12.0) | 82.8 (13.6) | 79.3 (14.6) | < .001 |
| Height, mean (SD), cm | 161 (9.04) | 162 (8.82) | 160 (9.19) | 161 (9.51) | 161 (8.90) | .002 |
| BMI, mean (SD) | 28.7 (4.81) | 25.6 (2.71) | 33.3 (3.32) | 31.9 (4.49) | 30.6 (4.78) | 0 |
| Tobacco use | ||||||
| Smokers | 752 (26.4) | 448 (30.5) | 96 (20.7) | 97 (21.9) | 111 (23.6) | < .001 |
| Never smoked | 1479 (52.0) | 723 (49.3) | 271 (58.4) | 245 (55.3) | 240 (51.0) | |
| Ex-smokers > 1 year | 615 (21.6) | 297 (20.2) | 97 (20.9) | 101 (22.8) | 120 (25.5) | |
| REGICOR, mean (SD) | 0.0448 (0.0354) | 0.0336 (0.0270) | 0.0380 (0.0273) | 0.0541 (0.0304) | 0.0779 (0.0460) | < .001 |
| Log HOMA | –0.43 [1.41] | –1.05 [1.36] | –0.08 [1.03] | 0.39 [1.03] | 0.41 [1.25] | < .001 |
BMI, body mass index; DBP, diastolic blood pressure; DLP, dyslipidemia; DM, diabetes mellitus; HDL-C, high-density lipoprotein cholesterol; HT, hypertension; LDL-C, low-density lipoprotein cholesterol; log HOMA, logarithm of Homeostasis Model Assessment; MS, metabolic syndrome; REGICOR, risk function that expresses the probability of having a coronary event over a 10-year period; SBP, systolic blood pressure, SD, standard deviation.
Unless otherwise indicated, the data are expressed as No. (%), mean (standard deviation) or median [interquartile range].
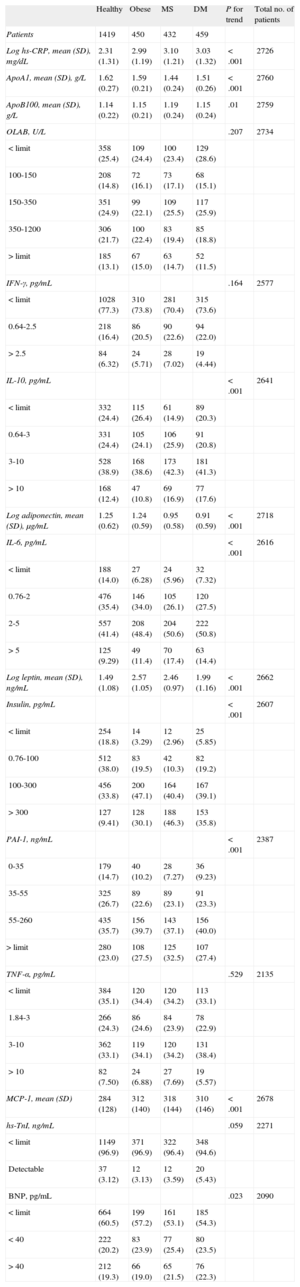
Table 2 shows the values of the different biomarkers analyzed in the 4 groups. The anti-oxidized low-density lipoprotein antibody, interferon-γ, tumor necrosis factor-α, troponin I, and B-type natriuretic peptide titers were not significantly associated with these values. The remaining biomarkers increased significantly, except in the case of adiponectin and apolipoprotein A1, which decreased in individuals who left the healthy group to enter the MS or DM group. Leptin was positively and significantly associated with all 3 disease phenotypes.
Description of the Distribution of the Different Biomarkers Analyzed in the Participants in the DARIOS Inflammatory Study, Divided Into 4 Groups According to the Different Metabolic Disorders of Interest
| Healthy | Obese | MS | DM | P for trend | Total no. of patients | |
| Patients | 1419 | 450 | 432 | 459 | ||
| Log hs-CRP, mean (SD), mg/dL | 2.31 (1.31) | 2.99 (1.19) | 3.10 (1.21) | 3.03 (1.32) | < .001 | 2726 |
| ApoA1, mean (SD), g/L | 1.62 (0.27) | 1.59 (0.21) | 1.44 (0.24) | 1.51 (0.26) | < .001 | 2760 |
| ApoB100, mean (SD), g/L | 1.14 (0.22) | 1.15 (0.21) | 1.19 (0.24) | 1.15 (0.24) | .01 | 2759 |
| OLAB, U/L | .207 | 2734 | ||||
| < limit | 358 (25.4) | 109 (24.4) | 100 (23.4) | 129 (28.6) | ||
| 100-150 | 208 (14.8) | 72 (16.1) | 73 (17.1) | 68 (15.1) | ||
| 150-350 | 351 (24.9) | 99 (22.1) | 109 (25.5) | 117 (25.9) | ||
| 350-1200 | 306 (21.7) | 100 (22.4) | 83 (19.4) | 85 (18.8) | ||
| > limit | 185 (13.1) | 67 (15.0) | 63 (14.7) | 52 (11.5) | ||
| IFN-γ, pg/mL | .164 | 2577 | ||||
| < limit | 1028 (77.3) | 310 (73.8) | 281 (70.4) | 315 (73.6) | ||
| 0.64-2.5 | 218 (16.4) | 86 (20.5) | 90 (22.6) | 94 (22.0) | ||
| > 2.5 | 84 (6.32) | 24 (5.71) | 28 (7.02) | 19 (4.44) | ||
| IL-10, pg/mL | < .001 | 2641 | ||||
| < limit | 332 (24.4) | 115 (26.4) | 61 (14.9) | 89 (20.3) | ||
| 0.64-3 | 331 (24.4) | 105 (24.1) | 106 (25.9) | 91 (20.8) | ||
| 3-10 | 528 (38.9) | 168 (38.6) | 173 (42.3) | 181 (41.3) | ||
| > 10 | 168 (12.4) | 47 (10.8) | 69 (16.9) | 77 (17.6) | ||
| Log adiponectin, mean (SD), μg/mL | 1.25 (0.62) | 1.24 (0.59) | 0.95 (0.58) | 0.91 (0.59) | < .001 | 2718 |
| IL-6, pg/mL | < .001 | 2616 | ||||
| < limit | 188 (14.0) | 27 (6.28) | 24 (5.96) | 32 (7.32) | ||
| 0.76-2 | 476 (35.4) | 146 (34.0) | 105 (26.1) | 120 (27.5) | ||
| 2-5 | 557 (41.4) | 208 (48.4) | 204 (50.6) | 222 (50.8) | ||
| > 5 | 125 (9.29) | 49 (11.4) | 70 (17.4) | 63 (14.4) | ||
| Log leptin, mean (SD), ng/mL | 1.49 (1.08) | 2.57 (1.05) | 2.46 (0.97) | 1.99 (1.16) | < .001 | 2662 |
| Insulin, pg/mL | < .001 | 2607 | ||||
| < limit | 254 (18.8) | 14 (3.29) | 12 (2.96) | 25 (5.85) | ||
| 0.76-100 | 512 (38.0) | 83 (19.5) | 42 (10.3) | 82 (19.2) | ||
| 100-300 | 456 (33.8) | 200 (47.1) | 164 (40.4) | 167 (39.1) | ||
| > 300 | 127 (9.41) | 128 (30.1) | 188 (46.3) | 153 (35.8) | ||
| PAI-1, ng/mL | < .001 | 2387 | ||||
| 0-35 | 179 (14.7) | 40 (10.2) | 28 (7.27) | 36 (9.23) | ||
| 35-55 | 325 (26.7) | 89 (22.6) | 89 (23.1) | 91 (23.3) | ||
| 55-260 | 435 (35.7) | 156 (39.7) | 143 (37.1) | 156 (40.0) | ||
| > limit | 280 (23.0) | 108 (27.5) | 125 (32.5) | 107 (27.4) | ||
| TNF-α, pg/mL | .529 | 2135 | ||||
| < limit | 384 (35.1) | 120 (34.4) | 120 (34.2) | 113 (33.1) | ||
| 1.84-3 | 266 (24.3) | 86 (24.6) | 84 (23.9) | 78 (22.9) | ||
| 3-10 | 362 (33.1) | 119 (34.1) | 120 (34.2) | 131 (38.4) | ||
| > 10 | 82 (7.50) | 24 (6.88) | 27 (7.69) | 19 (5.57) | ||
| MCP-1, mean (SD) | 284 (128) | 312 (140) | 318 (144) | 310 (146) | < .001 | 2678 |
| hs-TnI, ng/mL | .059 | 2271 | ||||
| < limit | 1149 (96.9) | 371 (96.9) | 322 (96.4) | 348 (94.6) | ||
| Detectable | 37 (3.12) | 12 (3.13) | 12 (3.59) | 20 (5.43) | ||
| BNP, pg/mL | .023 | 2090 | ||||
| < limit | 664 (60.5) | 199 (57.2) | 161 (53.1) | 185 (54.3) | ||
| < 40 | 222 (20.2) | 83 (23.9) | 77 (25.4) | 80 (23.5) | ||
| > 40 | 212 (19.3) | 66 (19.0) | 65 (21.5) | 76 (22.3) |
ApoA1: apolipoprotein A1; ApoB100: apolipoprotein B100; BNP, B-type natriuretic peptide; hs-CRP, high-sensitivity C-reactive protein; hs-TnI, high-sensitivity troponin I; IFN-γ, interferon-γ, IL: interleukin; MCP-1, monocyte chemotactic protein-1; OLAB, anti-oxidized low-density lipoprotein antibodies; PAI-1, plasminogen activator inhibitor 1; SD, standard deviation; TNF-α, tumor necrosis factor-α.
Unless otherwise indicated, the data are expressed as No. (%), or median [interquartile range].
Tables S2 and S3 in the supplementary material show the same results when obesity was defined on the basis of waist circumference. In general, the results were similar to those observed when the criterion for obesity was based on BMI.
The correlation between the different biomarkers analyzed was generally weak; the highest correlation coefficient, observed between insulin and leptin, was 0.453 (P > .001) (Table S4 in the supplementary material).
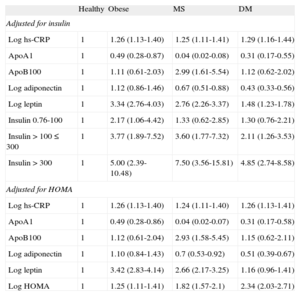
Table 3 shows the results of multinomial logistic regression analysis, taking the group of healthy individuals with normal weight as reference. The phenotype of individuals with normal weight clearly differed from the 3 disease phenotypes studied. Obesity was characterized by a significant positive association with hs-CRP, leptin, and insulin, and a significant negative association with apolipoprotein A1. MS adds to this same pattern a positive association with apolipoprotein B100, which characterizes this condition—single phenotype—and has a significant negative association with adiponectin. DM has a profile similar to that of MS, although its association with all of these same markers, with the exception of hs-CRP, is somewhat weaker.
Odds Ratio (95% Confidence Interval) Using Multinomial Logistic Regression Analysis of Each Biomarker Pertaining to a Different Metabolic Disorder of Interest, Defining Obesity on the Basis of Body Mass Index Adjusted for Age, Sex, and the Remaining Biomarkers
| Healthy | Obese | MS | DM | |
| Adjusted for insulin | ||||
| Log hs-CRP | 1 | 1.26 (1.13-1.40) | 1.25 (1.11-1.41) | 1.29 (1.16-1.44) |
| ApoA1 | 1 | 0.49 (0.28-0.87) | 0.04 (0.02-0.08) | 0.31 (0.17-0.55) |
| ApoB100 | 1 | 1.11 (0.61-2.03) | 2.99 (1.61-5.54) | 1.12 (0.62-2.02) |
| Log adiponectin | 1 | 1.12 (0.86-1.46) | 0.67 (0.51-0.88) | 0.43 (0.33-0.56) |
| Log leptin | 1 | 3.34 (2.76-4.03) | 2.76 (2.26-3.37) | 1.48 (1.23-1.78) |
| Insulin 0.76-100 | 1 | 2.17 (1.06-4.42) | 1.33 (0.62-2.85) | 1.30 (0.76-2.21) |
| Insulin > 100 ≤ 300 | 1 | 3.77 (1.89-7.52) | 3.60 (1.77-7.32) | 2.11 (1.26-3.53) |
| Insulin > 300 | 1 | 5.00 (2.39-10.48) | 7.50 (3.56-15.81) | 4.85 (2.74-8.58) |
| Adjusted for HOMA | ||||
| Log hs-CRP | 1 | 1.26 (1.13-1.40) | 1.24 (1.11-1.40) | 1.26 (1.13-1.41) |
| ApoA1 | 1 | 0.49 (0.28-0.86) | 0.04 (0.02-0.07) | 0.31 (0.17-0.58) |
| ApoB100 | 1 | 1.12 (0.61-2.04) | 2.93 (1.58-5.45) | 1.15 (0.62-2.11) |
| Log adiponectin | 1 | 1.10 (0.84-1.43) | 0.7 (0.53-0.92) | 0.51 (0.39-0.67) |
| Log leptin | 1 | 3.42 (2.83-4.14) | 2.66 (2.17-3.25) | 1.16 (0.96-1.41) |
| Log HOMA | 1 | 1.25 (1.11-1.41) | 1.82 (1.57-2.1) | 2.34 (2.03-2.71) |
ApoA1, apolipoprotein A1; ApoB100, apolipoprotein B100; DM, diabetes mellitus; HOMA, Homeostasis Model Assessment; hs-CRP, high-sensitivity C-reactive protein; MS: metabolic syndrome.
Upon adjusting the model for HOMA rather than insulin, the results were similar, with the exception of the positive association between leptin and DM, which lost its significance (Table 3). The pattern of associations observed was also similar when obesity was defined on the basis of waist circumference, except in the case of leptin, which maintained the significant positive association with DM (Table S5 in the supplementary material). The study of the interactions demonstrated a significant interaction between hs-CRP and sex, in which increases in hs-CRP were associated with a higher probability of developing obesity, MS, or DM in women than in men.
As this is a multicenter study, the models were also adjusted for the effect of clustering by using random effects models that included the variable “center”, and no statistically significant differences were observed in the associations found.
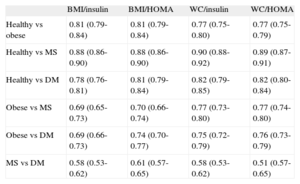
Finally, Table 4 shows the ability to discriminate between the metabolic risk groups using the biomarkers analyzed here by calculating the area under the curve of the function of Table 3, and Tables S5A and S5B in the supplementary material. In general, the biomarkers exhibited acceptable discrimination between the subgroups and their reference, except for MS vs DM. We also analyzed the calibration of the models (agreement between the probabilities estimated with the models and those actually observed) using the Hosmer-Lemeshow test, and accurate calibration was observed in all the models (except that which included HOMA index and waist circumference to estimate the probability of DM).
Table Comparing the Area Under the Receiver Operating Characteristic Curve (95% Confidence Interval) of the Polynomial Function From Table 3 and Table S5 in the Supplementary Material of the Different Obesity Phenotypes, Considering Body Mass Index and Waist Circumference Separately
| BMI/insulin | BMI/HOMA | WC/insulin | WC/HOMA | |
| Healthy vs obese | 0.81 (0.79-0.84) | 0.81 (0.79-0.84) | 0.77 (0.75-0.80) | 0.77 (0.75-0.79) |
| Healthy vs MS | 0.88 (0.86-0.90) | 0.88 (0.86-0.90) | 0.90 (0.88-0.92) | 0.89 (0.87-0.91) |
| Healthy vs DM | 0.78 (0.76-0.81) | 0.81 (0.79-0.84) | 0.82 (0.79-0.85) | 0.82 (0.80-0.84) |
| Obese vs MS | 0.69 (0.65-0.73) | 0.70 (0.66-0.74) | 0.77 (0.73-0.80) | 0.77 (0.74-0.80) |
| Obese vs DM | 0.69 (0.66-0.73) | 0.74 (0.70-0.77) | 0.75 (0.72-0.79) | 0.76 (0.73-0.79) |
| MS vs DM | 0.58 (0.53-0.62) | 0.61 (0.57-0.65) | 0.58 (0.53-0.62) | 0.51 (0.57-0.65) |
BMI, body mass index; DM, diabetes mellitus; HOMA, Homeostasis Model Assessment; MS, metabolic syndrome; WC, waist circumference.
In this study, after analyzing a panel of 20 serum biomarkers of carbohydrate metabolism, lipid profile, metabolic status, inflammation, hemostasis, oxidation, hemodynamics, and myocardial damage, we identified a small group of markers (hs-CRP, apolipoprotein A1, apolipoprotein B100, adiponectin, leptin, and insulin resistance) that were independently associated with different phenotypes of metabolic risk, such as obesity, MS, and DM. All of the biomarkers analyzed form part of some of the mechanisms present in the metabolic, inflammatory, and coagulation disorders that are activated (low-grade inflammation) in the different phenotypes studied.
Although the cross-sectional design of the study does not allow us to establish causation, this finding supports the idea that insulin resistance, inflammation, and alterations in the lipid profile play a central role in the continuum of metabolic risk that begins in the healthy individual and progresses to the development of obesity and DM.
Overeating results in adipose tissue remodeling,22 which is characterized by adipocyte hypertrophy, macrophage infiltration, and angiogenesis.23,24 This remodeling favors chronic inflammation,25,26 which can contribute to the development and progression of arteriosclerosis and a certain degree of resistance to insulin action.7,27 This association may not be causal, as occurs in the association between CRP and coronary artery disease,28 but it does indicate the relevance of inflammation in this transition from normal weight to DM. Hyperinsulinemia and insulin resistance (determined using the HOMA index) are common to all 3 phenotypes.
This increased insulin resistance is related to hypoadiponectinemia and hyperleptinemia.29,30 In our study, we also observed that insulin and leptin were the most closely correlated biomarkers, even though the correlation was moderate. It is also interesting that both were independently associated with the phenotypes defined here, which indicates that they represent independent or complementary mechanisms.
The significant positive association between hs-CRP and the phenotypes studied is clear, as is its strong interaction with obesity; the inverse relationship between CRP and adiponectin has been reported elsewhere.31 The causality of this acute phase reactant in atherosclerotic disease is still a subject of debate.32 Chen et al33 reported the presence in blood of several serum proteins that interacted with leptin, and that one of the most important ones was CRP. Thus, they suggested that this protein could contribute to leptin resistance; however, it has not been possible to reproduce these results and they have since been refuted.34
Adiponectin is associated with MS and DM. Adiponectin is a protein that enhances insulin sensitivity and prevents the accumulation of fatty acids in skeletal muscle and internal organs,35 increasing their oxidation. It has also been reported to have anti-inflammatory effects, inhibiting the expression of adhesion molecules, and its possible anti-atherosclerotic effects have also been described.36 Moreover, a number of studies have pointed out that low adiponectin titers are associated with the development of MS, DM, and cardiovascular disease.37–41 The hypoadiponectinemia observed in the majority of these phenotypes is further evidence of the inflammatory state and insulin resistance found in patients with MS or DM.7
Our study demonstrates that this negative association is not yet manifest when obesity is an individual's only diagosed medical condition. This allows us to speculate that normal concentrations of this protein could be useful in the future to identify the phenotype recently described as healthy but obese.42 We have also observed that in the groups with higher cardiovascular risk, estimated according to the REGICOR equation, the adiponectin titers were lower.
Leptin is a protein produced by adipose tissue, with the peculiarity that fat in women produces 3 times more leptin than that of men, and that its function is to prevent fatty acid deposition in nonadipose tissue, restrict food intake, and stimulate growth, fertility, and inflammation.43 In our study, leptin was positively and significantly associated with the 3 phenotypes, although this association lost significance in the diabetic patients when the diagnosis of obesity was based on the BMI and the model was adjusted for the HOMA index. The latter situation was not maintained in the context of obesity diagnosed on the basis of an increased waist circumference.
Apolipoprotein A1 was also inversely associated with all the clinical conditions dealt with here, especially with MS, probably as a consequence of the definition of this syndrome, which includes low high-density lipoprotein cholesterol level as a criterion. Moreover, a decrease in apolipoprotein A1 is also associated with obesity and DM, a circumstance that could be attributed to a more marked insulin resistance. Along these lines, some authors have proposed the use of the triglyceride/high-density lipoprotein cholesterol ratio.44,45
In our study, apolipoprotein B100 is associated only with the presence of MS and, although it is not a criterion for MS per se, it is frequently linked to the lipid abnormalities found in that syndrome. This association indicates that high low-density lipoprotein cholesterol, levels are related to MS, even though it has been observed that the levels in patients with MS may not be very high. However, these particles are small and dense and, consequently, more atherogenic.46 We found no association between the different phenotypes and the biomarkers of lipid oxidation, hemostasis, hemodynamics, or myocardial damage analyzed here. Although plasminogen activator inhibitor-1 was associated with the metabolic phenotypes in the bivariate analysis, this relationship lost statistical significance in the multivariate analysis. This lack of association could be related to the fact that the plasminogen activator inhibitor-1 concentration could not be accurately determined in 23% of the participants, as the concentrations were below the detection limit of the laboratory procedure employed.
Finally, there is a great deal of debate as to the better criterion for the definition of obesity3–47: BMI or waist circumference. In our study, we found no differences between the use of BMI and waist circumference as the criterion for obesity in terms of their association with the biomarkers analyzed here, with the exception of leptin, which lost significance after adjustment of the model for the HOMA index in the context of obesity according to BMI.
LimitationsThis study has the limitations characteristic of cross-sectional studies, which determine associations, not causality. On the other hand, in the case of certain biomarkers analyzed here, some of the subjects had values below (or above) the detection limit for the technique employed. The samples were obtained in the different participating centers from 2000 to 2009, so there is a variability factor attributed to the preanalytical procedures carried out in each study and each study period. In any case, we evaluated the conditions and procedures for sample collection and handling in the different centers in order to ensure that the comparisons would be valid. All the determinations were centralized in a single laboratory to minimize the analytical variability.
Finally, the cutoff point for BMI impeded greater precision in assessing possible effect of overweight, which was not considered in our study.
Nevertheless, given the population-based design and large sample size, this report provides an important view of biomarker profiles and their relationship to the contemporary epidemic constituted by obesity and its consequences.
CONCLUSIONSNormal weight and, to a lesser extent, obesity differ from MS and DM in their metabolic, inflammatory, and lipid profiles as analyzed by biomarkers, a fact that indicates the relevance of these mechanisms in the continuum of metabolic risk. When MS and DM are compared, these differences are less marked.
FUNDINGThis study was fully funded by an unconditional grant from AstraZeneca.
The collection of the original data from the component studies was financed by the ERDF (European Regional Development Fund)-Spanish Ministry of Science and Innovation, Instituto de Salud Carlos III (the HERACLES network RD06/0009); research funds. Spanish Interterritorial Council agreement dated 8 April, 2003; EMER07/046 RCESP C3/09); Fondo de Investigación Sanitaria (Spanish Health Care Research Fund; FIS-ERDF) (PI01/0711, PI02/1158, PI02/1179, PI02/1717, PI03/20471, PI05/2364, PI05/2751, PI07/040, PI07/0934, PI07/1213, G03-045, FIS-ETES 2007, CP06/00100, CM08/00141); Spanish Ministry of Health and Consumer Affairs, National R&D&i Plan 2004-2007, (IP071218); Agència d’Avaluació de Tecnologia i Recerca Mèdica (Agency for the Evaluation of Medical Research and Technology, Catalonia, Spain) (034/33/02); Agència de Gestió d’Ajuts Universitaris i de Recerca (Agency for the Administration of University and Research Grants) (2005SGR00577); Department of Health of the Autonomous Government of Catalonia, Spain; Fundación Canaria de Investigación y Salud (Research and Health Foundation of the Canary Islands, Spain) (45/98); Department of Health of the Government of Navarre; Autonomous Government of Castile and León; Grant for Intensified Research (INT 07/289); Subdirectorate General for the Promotion of Health and Prevention; Department of Health of the Autonomous Community of Madrid; Government of the Balearic Islands; Andalusian Health Service; Program for Community Initiatives of the European Union INTERREG IIIA (SP5.E51); Department of Health of the Autonomous Government of Andalusia, Aid for Research Projects (290/04 y 036/06); Andalusian Society of Family and Community Medicine (SAMFYC 2008); Spanish Society of Family and Community Medicine (semFYC 2009); Department of Health and Consumer Affairs of the Region of Murcia; and Department of Health and Social Welfare, Autonomous Government of Castile-La Mancha.
CIBERESP and CIBEROBEN are an initiative of the Instituto de Salud Carlos III.
CONFLICTS OF INTERESTNone declared.
We wish to thank Juan Carlos Palma, Manuel Leal, María J. Zaro, and Yolanda Morcillo for their support in the management of the project.
Supplementary material associated with this article can be found in the online version available at doi:10.1016/j.rec.2013.10.019.