A certain degree of prosthesis oversizing (OS) is recommended for the SAPIEN 3 to achieve device success. However, an increase in OS may increase permanent pacemaker implantation (PPI) rates. We therefore investigated the influence of OS on device failure and PPI.
MethodsA total of 804 patients were treated with SAPIEN 3 at 3 centers. Multislice computed tomography-derived OS was calculated and analyzed both as a continuous variable and categorized in 5% increments with −4% to 0% as reference.
ResultsDevice failure occurred in 8.8% of patients. Median OS was lower in patients with device failure vs those with device success (+4% vs +8%; P=.038). A nonlinear risk pattern was shown for OS with a significantly reduced device failure rate within 4% to +22% of OS. There was no case of paravalvular leakage II+ between +10% to +20% of OS. The overall PPI rate was 16.2% and the median OS was significantly larger in patients with PPI (PPI: +9% vs no PPI: +7%; P = .025), while implantation depth did not vary in patients with vs without PPI (6.9±1.7 mm vs 6.6±1.9 mm; P=.101). The risk of PPI increased with increasing OS and was highest in the 2 highest categories.
ConclusionsAn increase in OS reduces the risk for device failure but increases the risk for PPI. There was no ideal range of OS to minimize both device failure and PPI.
Keywords
Transcatheter aortic valve implantation (TAVI) is superior to conventional aortic valve surgery in patients with severe aortic stenosis at high operative risk1 and has recently been shown to be noninferior in intermediate risk patients.2
The development of new transcatheter heart valves, as well as increasing experience, have led to considerable improvement in clinical results.3,4 In this scenario, selection of the most suitable transcatheter heart valve size for the patient plays a crucial role. Multislice computed tomography (MSCT)-derived aortic annular area has been successfully employed for transcatheter heart valve selection.5 A certain degree of prosthesis oversizing (OS) is advised to avoid paravalvular leakage (PVL),6 but, greater OS may increase the need for new permanent pacemaker implantations (PPI).7
For the SAPIEN 3 (S3, Edwards Lifescience, Irvine, California, United States) sizing recommendations for OS are provided by the manufacturer. However, the influence of different degrees of OS on the risk of PPI and device failure is unknown. Furthermore, it is unclear if there is an ideal range of OS to minimize both device failure and need for PPI.
Therefore, in a large population of patients undergoing TAVI with the S3 at 3 centers, we evaluated the influence of OS on device failure and PPI.
METHODSPatient Population and ProceduresThis is a retrospective subanalysis of previously published, prospectively collected consecutive patients from a multicenter cohort of patients undergoing TAVI between January 2014 and January 2016.8 In total, 810 patients underwent transfemoral TAVI for symptomatic stenosis of the native aortic valve with the S3; of these, patients with incomplete or nonevaluable MSCT data (n=6) were excluded, leaving 804 patients for analysis. To assess the incidence of new PPI, patients with a prior pacemaker were excluded, leaving 709 patients for new PPI evaluation. All patients provided written informed consent for the procedure.
Multislice Computed Tomography EvaluationAortic annulus measurements were obtained in a multiple plane reconstruction of MSCT data according to the guidelines of the Society of Cardiovascular Computed Tomography9 at each participating center using dedicated Food and Drug Administration-approved software (OsiriX MDTM 3.9.4, Pixmeo, Switzerland or 3MensioTM, Pie Medical, The Netherlands). The area and perimeter of the aortic annulus were obtained at the level of the virtual annulus by direct planimetry. Calcification of the valvular apparatus was visually assessed at the height of the aortic cusps and dichotomized as none/mild vs moderate/severe.
Definition of Prosthesis OversizingAt the time of data collection, the S3 was available in 3 sizes: 23, 26 and 29 mm. OS by annular area (in percentage) was calculated for each case as previously published7 using the formula: (prosthesis nominal area/patient aortic annular area-1)*100. The physicians performing the procedure took the final decision on the implanted prosthesis size. Examples of different degrees of OS and dimensions of a nominal expanded S3 and the manufacturer's sizing recommendations are given in .
Prosthesis Depth AssessmentProsthesis implantation depth was assessed in a core laboratory (ISAResearch Center, Deutsches Herzzentrum München, Germany) using the final aortic angiogram showing the prosthesis in an orthogonal view as previously described.7 The native aortic annulus was marked by intersecting the nadir point of the sinuses of Valsalva and implantation depth (in millimeters) was defined as the distance from the aortic annulus to the distal part of the prosthesis. Food and Drug Administration-approved software QAngio XA Version 7.3 (Medis Medical Imaging Systems, Leiden, The Netherlands) with isocenter calibration was used for all measurements. Prosthesis depth was assessed for 783/804 (97.4%) patients with an evaluable postdeployment aortic angiogram. When multiple valves were deployed (n=9), the depth of the prosthesis protruding deepest into the left ventricular outflow tract was assessed.
Follow-up and Definition of EndpointsEndpoints of the study were device failure in the entire patient population (n=804) and new PPI at 30 days in patients without a pacemaker at baseline (n=709). Device failure was defined as the failure to achieve the endpoint device success proposed by the updated Valve Academic Research Consortium-2,1 which is a composite of absence of procedural mortality, correct positioning of a single prosthetic heart valve into the proper anatomical location and intended performance (no prosthesis-patient mismatch and mean aortic valve gradient<20mmHg and no moderate or severe prosthetic valve regurgitation). The decision for PPI was left at the discretion of the physicians in charge of the patients. All data were categorized according to the Valve Academic Research Consortium-2 criteria.10
Statistical AnalysisContinuous variables are expressed as the mean±standard deviation or as median [interquartile range] and were compared using the unpaired Student t-test or the Mann-Whitney U-test as appropriate. Discrete variables were compared with the chi-square test or Fisher exact test. The association of OS with device failure and PPI was assessed in univariate analysis. Further, the association of OS with each endpoint was analyzed in univariate and multivariate logistic regression models and the odds ratios (OR) and their respective 95% confidence intervals (95%CI) were calculated. Multivariable models were adjusted using variables yielding a P value of<.1 in univariate analyses.
The association of OS with both endpoints was analyzed by 2 approaches: first, the gradient of risk along the continuum of OS with both binary outcomes was analyzed using restricted cubic splines with 4 knots at percentiles 5%, 35%, 65% and 95%, as previously published.11 The ORs with the respective 95%CI of OS as a continuous variable for both endpoints were estimated. Second, OS was evaluated by 7 categories of each 5% increase in OS: (−5% and under; −4% to 0%; +1% to +5%; +6% to +10%; +11% to +15%; +16% to +20%; and over +20%). The reference was category −4% to 0% with its median −2%, representing the lowest category within the manufacturer's recommended OS range. For 2 contributors to device failure, namely, PVL II+ and elevated gradient (≥ 20mmHg), these analyses were also performed.
A 2-sided P value of<.05 was considered statistically significant for all analyses. STATA (Version 13.0, STATA Corp USA) was used for analyses.
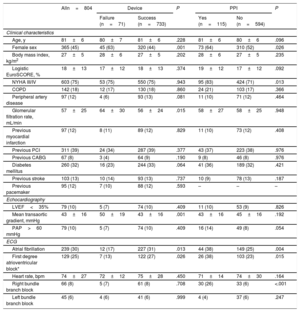
RESULTSIn total, 804 patients formed the study population and baseline clinical and MSCT characteristics are presented in Table 1 and Table 2. Mean age was 81±6 years and mean logistic EuroSCORE was 18±13%. Procedural characteristics and in-hospital events are displayed in Table 3. TAVI was performed with the patient under conscious sedation in 47% of the patients and 30-day mortality was 1.6%.
Baseline Clinical, Echocardiographic and ECG Characteristics
| Alln=804 | Device | P | PPI | P | |||
|---|---|---|---|---|---|---|---|
| Failure (n=71) | Success (n=733) | Yes (n=115) | No (n=594) | ||||
| Clinical characteristics | |||||||
| Age, y | 81±6 | 80±7 | 81±6 | .228 | 81±6 | 80±6 | .096 |
| Female sex | 365 (45) | 45 (63) | 320 (44) | .001 | 73 (64) | 310 (52) | .026 |
| Body mass index, kg/m2 | 27±5 | 28±6 | 27±5 | .202 | 28±6 | 27±5 | .235 |
| Logistic EuroSCORE, % | 18±13 | 17±12 | 18±13 | .374 | 19±12 | 17±12 | .092 |
| NYHA III/IV | 603 (75) | 53 (75) | 550 (75) | .943 | 95 (83) | 424 (71) | .013 |
| COPD | 142 (18) | 12 (17) | 130 (18) | .860 | 24 (21) | 103 (17) | .366 |
| Peripheral artery disease | 97 (12) | 4 (6) | 93 (13) | .081 | 11 (10) | 71 (12) | .464 |
| Glomerular filtration rate, mL/min | 57±25 | 64±30 | 56±24 | .015 | 58±27 | 58±25 | .948 |
| Previous myocardial infarction | 97 (12) | 8 (11) | 89 (12) | .829 | 11 (10) | 73 (12) | .408 |
| Previous PCI | 311 (39) | 24 (34) | 287 (39) | .377 | 43 (37) | 223 (38) | .976 |
| Previous CABG | 67 (8) | 3 (4) | 64 (9) | .190 | 9 (8) | 46 (8) | .976 |
| Diabetes mellitus | 260 (32) | 16 (23) | 244 (33) | .064 | 41 (36) | 189 (32) | .421 |
| Previous stroke | 103 (13) | 10 (14) | 93 (13) | .737 | 10 (9) | 78 (13) | .187 |
| Previous pacemaker | 95 (12) | 7 (10) | 88 (12) | .593 | – | – | – |
| Echocardiography | |||||||
| LVEF<35% | 79 (10) | 5 (7) | 74 (10) | .409 | 11 (10) | 53 (9) | .826 |
| Mean transaortic gradient, mmHg | 43±16 | 50±19 | 43±16 | .001 | 43±16 | 45±16 | .192 |
| PAP>60 mmHg | 79 (10) | 5 (7) | 74 (10) | .409 | 16 (14) | 49 (8) | .054 |
| ECG | |||||||
| Atrial fibrillation | 239 (30) | 12 (17) | 227 (31) | .013 | 44 (38) | 149 (25) | .004 |
| First degree atrioventricular block* | 129 (25) | 7 (13) | 122 (27) | .026 | 26 (38) | 103 (23) | .015 |
| Heart rate, bpm | 74±27 | 72±12 | 75±28 | .450 | 71±14 | 74±30 | .164 |
| Right bundle branch block | 66 (8) | 5 (7) | 61 (8) | .708 | 30 (26) | 33 (6) | <.001 |
| Left bundle branch block | 45 (6) | 4 (6) | 41 (6) | .999 | 4 (4) | 37 (6) | .247 |
CABG, coronary artery bypass graft; COPD, chronic obstructive pulmonary disease; ECG, electrocardiogram; LVEF, left ventricular ejection fraction; NYHA, New York Heart Association; PAP, pulmonary artery pressure; PCI, percutaneous coronary intervention; PPI, permanent pacemaker implantation.
Data are mean±standard deviation or No. (%).
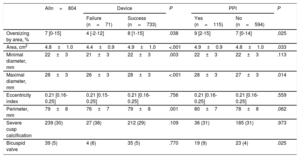
Aortic Annulus Measures on MSCT
| Alln=804 | Device | P | PPI | P | |||
|---|---|---|---|---|---|---|---|
| Failure (n=71) | Success (n=733) | Yes (n=115) | No (n=594) | ||||
| Oversizing by area, % | 7 [0-15] | 4 [-2-12] | 8 [1-15] | .038 | 9 [2-15] | 7 [0-14] | .025 |
| Area, cm2 | 4.8±1.0 | 4.4±0.9 | 4.9±1.0 | <.001 | 4.9±0.9 | 4.8±1.0 | .033 |
| Minimal diameter, mm | 22±3 | 21±3 | 22±3 | .003 | 22±3 | 22±3 | .113 |
| Maximal diameter, mm | 28±3 | 26±3 | 28±3 | <.001 | 28±3 | 27±3 | .014 |
| Eccentricity index | 0.21 [0.16-0.25] | 0.21 [0.15-0.25] | 0.21 [0.16-0.25] | .756 | 0.21 [0.16-0.25] | 0.21 [0.16-0.25] | .559 |
| Perimeter, mm | 79±8 | 76±7 | 79±8 | .001 | 80±7 | 78±8 | .062 |
| Severe cusp calcification | 239 (30) | 27 (38) | 212 (29) | .109 | 36 (31) | 185 (31) | .973 |
| Bicuspid valve | 39 (5) | 4 (6) | 35 (5) | .770 | 19 (9) | 23 (4) | .025 |
MSCT, multislice computed tomography; PPI, permanent pacemaker implantation.
Data are expressed as mean±standard deviation, No. (%) or median [interquartile range].
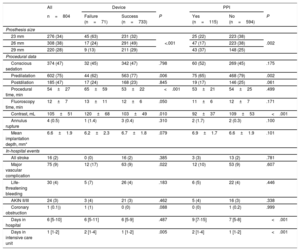
Procedural Characteristics and In-hospital Outcome
| All | Device | PPI | |||||
|---|---|---|---|---|---|---|---|
| n=804 | Failure (n=71) | Success (n=733) | P | Yes (n=115) | No (n=594) | P | |
| Prosthesis size | |||||||
| 23 mm | 276 (34) | 45 (63) | 231 (32) | <.001 | 25 (22) | 223 (38) | .002 |
| 26 mm | 308 (38) | 17 (24) | 291 (49) | 47 (17) | 223 (38) | ||
| 29 mm | 220 (28) | 9 (13) | 211 (29) | 43 (37) | 148 (25) | ||
| Procedural data | |||||||
| Conscious sedation | 374 (47) | 32 (45) | 342 (47) | .798 | 60 (52) | 269 (45) | .175 |
| Predilatation | 602 (75) | 44 (62) | 563 (77) | .006 | 75 (65) | 468 (79) | .002 |
| Postdilation | 185 (47) | 17 (24) | 168 (23) | .845 | 19 (17) | 146 (25) | .061 |
| Procedural time, min | 54±27 | 65±59 | 53±22 | <.001 | 53±21 | 54±25 | .499 |
| Fluoroscopy time, min | 12±7 | 13±11 | 12±6 | .050 | 11±6 | 12±7 | .171 |
| Contrast, mL | 105±51 | 120±68 | 103±49 | .010 | 92±37 | 109±53 | <.001 |
| Annulus rupture | 4 (0.5) | 1 (1.4) | 3 (0.4) | .310 | 2 (1.7) | 2 (0.3) | .100 |
| Mean implantation depth, mm* | 6.6±1.9 | 6.2±2.3 | 6.7±1.8 | .079 | 6.9±1.7 | 6.6±1.9 | .101 |
| In-hospital events | |||||||
| All stroke | 16 (2) | 0 (0) | 16 (2) | .385 | 3 (3) | 13 (2) | .781 |
| Major vascular complication | 75 (9) | 12 (17) | 63 (9) | .022 | 12 (10) | 53 (9) | .607 |
| Life-threatening bleeding | 30 (4) | 5 (7) | 26 (4) | .183 | 6 (5) | 22 (4) | .446 |
| AKIN II/III | 24 (3) | 3 (4) | 21 (3) | .462 | 5 (4) | 16 (3) | .338 |
| Coronary obstruction | 1 (0.1)) | 1 (1) | 0 (0) | .088 | 0 (0) | 1 (0.2) | .999 |
| Days in hospital | 6 [5-10] | 6 [5-11] | 6 [5-9] | .487 | 9 [7-15] | 7 [5-8] | <.001 |
| Days in intensive care unit | 1 [1-2] | 2 [1-4] | 1 [1-2] | .005 | 2 [1-4] | 1 [1-2] | <.001 |
AKIN, Acute Kidney Injury Classification Stage 2 or 3; PPI, permanent pacemaker implantation.
Data are expressed as mean±standard deviation, No. (%) or median [interquartile range].
*Available for 783/804 (97.4%) patients.
The 23, 26 and 29mm sizes were used in 34%, 38%, and 28% of the patients, respectively. Median OS was 7% [0% to 15%], and 80% of cases were within the range of recommended OS by the manufacturer. shows median values of OS for each category, as well as dilatation rates and prosthesis size distribution within each category.
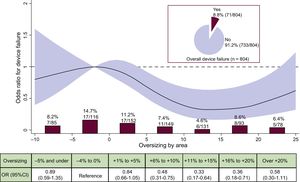
Device FailureDevice failure occurred in 8.8% of cases and the individual contributors to this endpoint are shown in . Baseline, MSCT and procedural characteristics of patients according to device failure are presented in Table 1, Table 2, and Table 3. Median OS was significantly lower in patients with device failure compared with device success (4% [–2 to 12] vs 8% [1 to 15]; P=.038).
As a continuous variable and assuming linearity of risk, there was no relationship between OS and the risk of device failure, either in the univariate (OR, 0.986; 95%CI, 0.965-1.012; P=.131, per % increase) or in the multivariable analysis (OR, 0.997; 95%CI, 0.971-1.024; P=.838, per % increase (). However, when the gradient of risk was analyzed using restricted cubic splines (Figure 1), a nonlinear association of OS with device failure was found, with a significantly reduced risk within the recommended degree of OS by the manufacturer from −5% to +20% OS when compared with the reference category. Figure 1 also shows the crude rates and ORs of device failure according to each OS categories. The rate of device failure was highest (14.7%) in the reference category (OS: −4% to 0%) and lowest in the +11% to +15% category (4.6%; OR, 0.33; 95%CI, 0.17-0.64).
 according to categories of prosthesis oversizing in percent. OR with the 95%CI (red area) of device failure according to prosthesis oversizing in percent. 95%CI, 95% confidence interval; OR, odds ratio.")
Incidence and risk of device failure according to prosthesis oversizing. Crude rate of device failure (%, n/N) according to categories of prosthesis oversizing in percent. OR with the 95%CI (red area) of device failure according to prosthesis oversizing in percent. 95%CI, 95% confidence interval; OR, odds ratio.
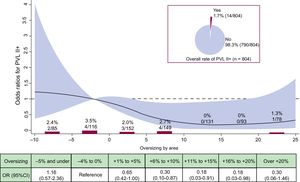
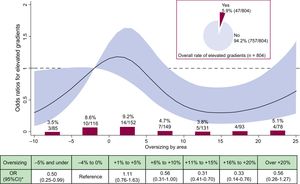
shows the individual contributors to device failure/success according to categories of OS. Figure 2 and Figure 3 detail the crude rates and risk of PVL II+ and elevated gradients (≥ 20mmHg) according to OS, respectively. Overall, PVL of II+ was detected in 1.7% of the cases. Figure 2 shows that no case of PVL II+ occurred within +11% to +20% of OS, representing the 2 largest categories within the recommended sizing range. Figure 3 shows that an increase in OS resulted in a decrease in the rate and risk of elevated gradients. Compared with the reference category, the risk for elevated gradients was significantly reduced within +9% to +21% OS.
 according to categories of prosthesis oversizing in percent. OR with the 95%CI (red area) of PVL II+ according to prosthesis oversizing in percent. 95%CI, 95% confidence interval; OR, odds ratio; PVL, paravalvular leakage.")
Incidence and risk of PVL II+ according to prosthesis oversizing. Crude rate of PVL II+ (%, n/N) according to categories of prosthesis oversizing in percent. OR with the 95%CI (red area) of PVL II+ according to prosthesis oversizing in percent. 95%CI, 95% confidence interval; OR, odds ratio; PVL, paravalvular leakage.
 according to prosthesis oversizing. Crude rate of elevated gradients (%, n/N) according to categories of prosthesis oversizing in percent. OR with the 95%CI (red area) of elevated gradients according to prosthesis oversizing in percent. 95%CI, 95% confidence interval; OR, odds ratio.")
Incidence and risk of elevated gradients (≥ 20 mmHg) according to prosthesis oversizing. Crude rate of elevated gradients (%, n/N) according to categories of prosthesis oversizing in percent. OR with the 95%CI (red area) of elevated gradients according to prosthesis oversizing in percent. 95%CI, 95% confidence interval; OR, odds ratio.
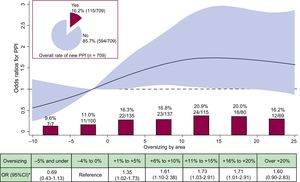
The overall incidence of new PPI at 30 days was 16.2%. Baseline clinical, MSCT variables and procedural characteristics according to PPI are displayed in Table 1, Table 2, and Table 3. The main reason for PPI was transient or persistent atrioventricular block III in 56.5% of the cases, for details see . The median degree of OS was significantly larger in patients with vs patients without PPI (9% [2 to 15] vs 7% [0 to 14]; P=.025), furthermore the risk of PPI increased significantly with increasing OS (OR, 1.021; 95%CI, 1.002-1.042; P=.039, per each % increase). There was no significant difference in implantation depth between patients with vs patients without PPI (Table 3).
In a multivariable analysis, OS persisted as an independent predictor of new PPI (per each % increase) (OR, 1.028; 95%CI, 1.005-1.051; P=.017) independently of implantation depth. shows detailed results of the multivariable analysis.
The functional form of OS for predicting PPI revealed an almost linear gradient of risk with lower risk at lower values and elevated risk within +3% to +18% compared with the reference category. No further increase in risk was found at values>15% (Figure 4). The crude rates within categories showed the lowest rates of PPI in the 2 lowest categories of OS, ie, the reference category and −5% OS and under (Figure 4). There was a stepwise increase in each step of the category of OS. Within the recommended sizing range the highest rates of PPI were found in the 2 highest categories of OS (+11% to +15% and +16% to +20%) with 20.9% and 20.0%, respectively.
 according to categories of prosthesis oversizing in percent. OR with the 95%CI (red area) of PPI according to prosthesis oversizing in percent. 95%CI, 95% confidence interval; OR, odds ratio; PPI, permanent pacemaker implantation.")
Incidence and risk of PPI according to prosthesis oversizing. Crude rate of PPI (%, n/N) according to categories of prosthesis oversizing in percent. OR with the 95%CI (red area) of PPI according to prosthesis oversizing in percent. 95%CI, 95% confidence interval; OR, odds ratio; PPI, permanent pacemaker implantation.
We evaluated the influence of prosthesis OS using the S3 on device failure and PPI in a large population of TAVI patients from 3 high-volume centers. We found that an increase in OS translates into a significant decrease in device failure. However, at the same time, the risk of PPI increases with increasing OS even within recommended sizing ranges. There was no ideal range in which the risk for both endpoints was minimized.
Prosthesis Oversizing and Device FailureThe role of MSCT-guided prosthesis sizing and OS has been investigated mainly to address PVL.6 In the case of the S3, it has been shown that less OS is required to prevent PVL compared with the predecessor, SAPIEN XT.12 An earlier study using SAPIEN XT has reported that modest OS of +5% to +10% resulted in lower rates PVL II+ compared with relative undersizing.13 Recent data using a self-expanding transcatheter heart valve, the Medtronic CoreValve, has also demonstrated that increasing OS positively influences the rate of PVL.14
In the present study, we found a nonlinear shaped response for predicting device failure with increasing OS. Concerning device failure, the ideal range of OS was found between +10% to +20% of OS. Of note, even in this large population including more than 800 contemporary cases, we found no case of PVL II+ within this range, corresponding to a significant decrease in risk. Therefore, it seems advisable to select a range of +10% to +20% OS to achieve optimal results as far as device failure and especially PVL are concerned.
Another interesting finding is that less OS is associated with a significantly higher incidence and risk of elevated residual gradients, which is another important contributor to device failure. This novel finding may point toward a certain patient-prosthesis mismatch and suggests that a certain degree of OS may be necessary to avoid residual gradients.
Permanent Pacemaker Implantations and Underlying MechanismsNew PPIs are a frequent and important complication after TAVI. Earlier investigations have found no negative effect of new PPI on outcome15; however, recent data have identified chronic pacing as an independent predictor of 1-year mortality.16,17 Moreover, PPI increases overall costs and is an important cause of prolonged hospital stay.16
After the release of the S3, first data reported an incidence of PPI between 13% and 25.5%.18–20 More recent studies demonstrated new PPI rates between 11.6%21 and 16%.7 In the present evaluation, we found comparable rates of new PPI at 30 days in 16%.
There is a paucity of data regarding the impact of MSCT-derived OS on the incidence of PPI after TAVI in general and especially for the S3 as this issue has been addressed mainly using echocardiography.22,23 A previous study, in a smaller patient population, has recently shown that out-of-range OS by MSCT was associated with an increased rate of PPI with the S3.7 Another study observed an association of OS with new or worsened conduction abnormalities after TAVI but not PPI. However, this study used postprocedural MSCT data to define OS.5 In the present study, in a large population we found a stepwise increase in PPI rate with increasing OS. This is a novel observation and interestingly, OS remained an independent predictor of PPI after adjustment for other important preprocedural predictors of PPI, including complete right bundle branch block, atrial fibrillation and implantation depth.7,24 Using restricted cubic splines, we observed that risk of PPI was significantly increased within+3% to+18% of OS, representing the major part of the recommended sizing range. Therefore, as far as risk of PPI is concerned, it appears that less OS is best with the S3.
There are other underlying mechanisms for conduction abnormalities leading to PPI in TAVI. In the case of the S3, a higher frame extending into the left ventricular outflow tract25 may play a role. The deeper positioning of the prosthesis below the aortic annulus may cause conduction abnormalities via mechanical stress and/or direct damage to the conduction system. The depth of implantation has been previously shown to influence PPI rates with the S3.7,26 In the present study, core laboratory measurement showed a mean implantation depth of 6.6 mm, which is in line with previously published data, however, there was no influence on PPI rates in the univariate or in the multivariate analysis.
Recently, using the S3, calcification at the height of noncoronary cusp was identified as an independent predictor for PPI.27 In this analysis, calcium distribution at the height of the aortic cusps was visually assessed and no correlation with PPI could be found.
Strengths and LimitationsThe main strengths of this study are the large patient number from high-volume TAVI centers, as well as a core laboratory evaluation of implantation depth. The limitations lie in the observational nature of the study without core laboratory analysis of MSCT measurements and postprocedural results. The amount of calcification of the valvular apparatus was visually graded and its impact, especially concerning device failure, may be underestimated.
CONCLUSIONSIn a large population of 3 high-volume TAVI centers, we found a nonlinear U-shaped response of device failure to increasing OS within the recommended sizing spectrum. However, the risk of PPI increased with increasing OS already at small degrees of OS. We found no ideal range of OS at which the risk for both device failure and PPI is minimized. Therefore, especially in cases of borderline ranges between 2 prosthesis sizes, our results suggest that choosing the larger valve may result in higher procedural success rates, especially in patients with a prior pacemaker. However, in patients at high risk for PPI (ie, prior complete right bundle branch block), choosing the smaller size may be justified.
CONFLICTS OF INTERESTC. Pellegrini declares minor travel grants from Edwards Lifesciences; W.-K. Kim is a proctor of Symetis S.A. and St. Jude Medical and declares speaker honoraria from Edwards Lifesciences; A.M. Kasel declares proctor fees and speaker honoraria from Edwards Lifesciences; M. Hilker declares proctor fees from Symetis S.A.; H. Möllmann declares proctor fees and speaker honoraria from Edwards Lifesciences and Symetis S.A.; C. Hengstenberg declares proctor fees and speaker honoraria from Edwards Lifesciences and Symetis S.A.; O. Husser declares minor travel grants from Edwards Lifesciences and proctor fees and speaker honoraria from Symetis S.A.
–A certain degree of prosthesis OS is recommended for the S3 to achieve device success and avoid PVL.
WHAT DOES THIS STUDY ADD?–In this analysis, we found a nonlinear U-shaped response of device failure to increasing OS within the recommended sizing spectrum. However, the risk of PPI increased with increasing OS already at small degrees of OS. There was no ideal range of OS at which the risk for both device failure and PPI is minimized. Therefore, patients at high risk for PPI might benefit from less OS while patients with a permanent pacemaker may benefit from more OS.