To analyze neuron-specific enolase (NSE) kinetics as a prognostic biomarker of neurological outcome in cardiac arrest survivors treated with targeted temperature management.
MethodsWe performed a retrospective analysis of patients resuscitated from in- or out-of-hospital cardiac arrest admitted from September 2006 to May 2018 in a single tertiary care center and cooled to 32°C to 34°C for 24 hours. Blood samples for measurement of NSE values were drawn at hospital admission and at 24, 48, and 72hours after return of spontaneous circulation (ROSC). Neurological outcome was evaluated by means of the Cerebral Performance Category (CPC) score at 3 months and was characterized as good (CPC 1-2) or poor (CPC 3-5).
ResultsOf 451 patients, 320 fulfilled the inclusion criteria and were analyzed (80.3% male, mean age 61±14.1 years). Among these, 174 patients (54.4%) survived with good neurological status. Poor outcome patients had higher median NSE values at hospital admission and at 24, 48 and 72 hours after ROSC. At 48 and 72 hours after ROSC, NSE predicted poor neurological outcome with areas under the receiver-operating characteristic curves of 0.85 (95%CI, 0.81-0.90) and 0.88 (95%CI, 0.83-0.93), respectively. In addition, delta NSE values between 72hours after ROSC and hospital admission predicted poor neurological outcome with an area under the receiver-operating characteristic curve of 0.90 (95%CI, 0.85-0.95) and was an independent predictor of unfavorable outcome on multivariate analysis (P <.001).
ConclusionsIn cardiac arrest survivors treated with targeted temperature management, delta NSE values between 72 hours after ROSC and hospital admission strongly predicted poor neurological outcome.
Keywords
Sudden cardiac arrest (CA) is one of the most common causes of death in the developed world, affecting nearly 556 000 people annually in the United States.1 Although a large proportion of CA deaths occur before or during resuscitation maneuvers, a substantial percentage of deaths occur in patients who have been successfully resuscitated and subsequently admitted to an intensive care unit. In these patients, most of initial mortality is secondary to hemodynamic failure, while brain injury accounts for most of the later deaths. In addition, withdrawal of life sustaining therapies (WLST) based on poor neurologic prognosis represents the most frequent cause of death in this subgroup.2,3 Therefore, neurological prognostication remains a significant clinical challenge in postresuscitation care and current guidelines recommend a multimodal approach combining clinical neurological examination, electrophysiological studies (somatosensory evoked potentials and electroencephalography), neuroimaging, and biomarkers, including neuron-specific enolase (NSE).4
NSE is a glycolytic enzyme involved in glucose metabolism and is mainly found in neuronal and neuroendocrine cells. Serum NSE concentrations are not affected by hypothermia and positively correlate with both the extent of anoxic-ischemic neurological injury and malignant electroencephalography changes after CA.5,6 A prospective study before the advent of targeted temperature management (TTM) reported that a serum NSE concentration higher than 33 μg/L on days 1 to 3 after CA was strongly associated with poor neurological outcome (false-positive rate [FPR] 0%)7 and the American Academy of Neurology subsequently introduced this cutoff value into the 2006 prognostication guidelines8. However, results were more variable in subsequent studies with unacceptably high FPRs being repeatedly reported when this serum NSE concentration threshold was used in patients whether they underwent TTM or not.9–11 For these reasons, and given the difficulty of finding a consistent threshold to identify patients at risk of a poor neurological outcome with a high degree of certainty, current resuscitation guidelines do not recommend any specific NSE threshold for prediction of poor neurological outcome, but instead suggest consecutive sampling at multiple time-points to establish trends in NSE levels and to reduce the risk of false-positive results due to hemolysis.4 Although the trend in serum NSE values could be more accurate than isolated values, the optimal approach, timelines and interpretation remain unclear.5
Since 2009, we have included assessment of NSE values at hospital admission and daily during the first 72hours of hospitalization as part of our acute cardiac care unit (ACCU) postcardiac arrest management protocol. The aim of this study was to analyze NSE kinetics and their correlation with neurological outcome in CA survivors treated with TTM in our ACCU.
MethodsWe performed a retrospective analysis of a prospective database that included consecutive CA survivors who were treated with TTM at the ACCU of a single tertiary care center from September 2006 to May 2018. The study population included in- and out-of-hospital CA survivors of suspected cardiac origin, irrespective of initial rhythm and cooled to 32°C to 34°C for 24hours, as previously described.12 Patients were considered eligible if there was confirmation of both persistent comatose state after ROSC and absence of contraindications for TTM. We included only patients who had at least 1 serum NSE determination during ACCU hospitalization and did not die within first 72hours after admission. The study protocol was approved by the institutional ethics committee (PI-3328).
The TTM protocol of our center consisted of implantation of either intravascular or surface cooling automatic feedback devices and cooling patients to a target temperature of 32°C to 34°C for 24hours. Rewarming was controlled at a set rate of 0.1°C to 0.2°C/h until achievement of normothermia (36.5°C-37°C) and body temperature was continuously monitored through a bladder probe. All patients underwent mechanical ventilation and were sedated with intravenous infusion of midazolam adjusted upon continuous bispectral index (BIS) monitoring. Muscular relaxation was achieved by continuous perfusion of cisatracurium until completion of rewarming. If acute coronary syndrome was suspected as the underlying cause of CA, coronary angiography was performed in a 24/7 cath-lab.
Blood samples for NSE measurement were obtained at hospital admission and daily during the first 72hours of hospitalization. Blood samples were routinely processed by the hospital's Laboratory Medicine Department and serum NSE measurement was performed using a Cobas e411 electro-chemiluminescence assay (Roche Diagnostic). The measurement range extended from 0.05 to 370 ng/mL, with a between-day precision coefficient of variation <4.4% and biological reference interval <16.3 ng/mL. All blood samples with visible hemolysis were rejected from the analysis to avoid falsely elevated values.
Once patients reached normothermia, and sedation and muscular relaxation were withdrawn, they underwent clinical neurological examination, followed by an electroencephalogram (EEG) if there was no documented response to simple commands and also taking into account BIS monitoring. Additionally, head computed tomography was performed when required by treating physicians. One week after hospitalization, if patients remained in a coma, a second EEG was performed. At this time, based on neurological examinations, biochemical markers as well as EEGs and neuroimaging findings, a multidisciplinary team established WLST, always in agreement with the patient's representatives.
The primary outcome of the study was the best neurological functional status achieved 3 months after CA determined according to the Pittsburgh Cerebral Performance Category (CPC) score and characterized for the purpose of the present analysis as good (CPC 1-2) or poor (CPC 3-5). A CPC score of 3 to 5 is equivalent to severe disability, coma, or death. Neurological status information was assessed retrospectively based on routine postcardiac arrest medical follow-up or by telephone interviews with patients and/or close family members.
StatisticsContinuous variables are presented as means±standard deviation and were compared using the Student t test for normally distributed values; otherwise, variables are described as medians and interquartile range [IQR] and differences were analyzed with the Mann-Whitney U test. The Fisher exact test was used to compare proportions. The discriminatory power of NSE to predict an unfavorable neurological outcome was determined by analysis of receiver-operating characteristics (ROC) curves. Different NSE thresholds for poor neurological outcome were provided as a compromise between sensitivity and specificity by maximizing the Youden index (defined as sensitivity+specificity -1) and by providing 95% to 100% specificity.
Multivariate analysis was performed using stepwise logistic regression analysis. All variables that were statistically significant on univariate analysis were selected as candidate variables for the predictive model. To avoid collinearity, the parameter with the highest area under the curve among NSE determinations (delta NSE value between 72hours after ROSC and hospital admission) was selected as a candidate variable. The results are expressed as odds ratios (OR) and their 95% confidence intervals (95%CI). The Hosmer-Lemeshow test was used to determine the goodness-of-fit of the model. The additional predictive power contributed by the delta NSE value was evaluated using the net reclassification index (NRI) and the integrated discrimination improvement (IDI). This model was compared with others that included different delta or absolute NSE values. In all models, missing data were excluded from the analysis using listwise deletion. The significance level was set at P <.05. All statistical analyses were performed using Stata v14.2 (StataCorp, College Station, Texas, United States).
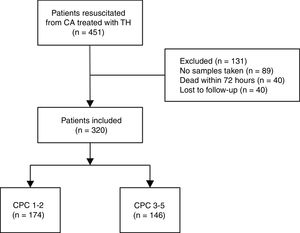
ResultsClinical characteristicsDuring the study period, a total of 451 survivors of in- or out-of-hospital CA were consecutively admitted to our ACCU and treated with TTM. Of these, 89 patients were excluded due to the absence of any NSE determinations during admission. Excluded patients were mostly part of the initial 2006 to 2009 period when NSE analysis was not part of our postresuscitation protocol. Additionally, 40 patients died within 72hours and 2 patients were lost to follow-up. Ultimately, 320 patients were included in the final statistics analysis (Figure 1).

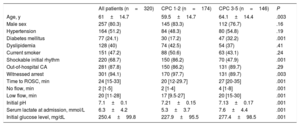
The mean age of the cohort was 61±14.1 years and 80.2% were male. In all, 281 patients (87.8%) had an out-of-hospital CA and 220 (68.7%) had an initial shockable rhythm (pulseless ventricular tachycardia or ventricular fibrillation). According to the CPC scale, 174 patients (54.4%) were assigned to the good neurological outcome group (CPC 1-2) vs 146 (45.6%) who were assigned to the poor neurological group (CPC 3-5) at 3-months’ follow-up. In the poor neurological outcome group, 9 patients were assigned to CPC 3, 1 patient to CPC 4 and 136 to CPC 5. The good neurological outcome group was younger, with shorter ROSC times (including no flow and low flow) and had a higher percentage of initial shockable rhythms and less altered pH values, serum lactate, and glucose levels at hospital admission. The clinical characteristics of all included patients in the study and according to the CPC scale are shown in Table 1.
Clinical and laboratory characteristics of the overall cohort and stratified by neurological outcome
| All patients (n=320) | CPC 1-2 (n=174) | CPC 3-5 (n=146) | P | |
|---|---|---|---|---|
| Age, y | 61±14.7 | 59.5±14.7 | 64.1±14.4 | .003 |
| Male sex | 257 (80.3) | 145 (83.3) | 112 (76.7) | .16 |
| Hypertension | 164 (51.2) | 84 (48.3) | 80 (54.8) | .19 |
| Diabetes mellitus | 77 (24.1) | 30 (17.2) | 47 (32.2) | .001 |
| Dyslipidemia | 128 (40) | 74 (42.5) | 54 (37) | .41 |
| Current smoker | 151 (47.2) | 88 (50.6) | 63 (43.1) | .24 |
| Shockable initial rhythm | 220 (68.7) | 150 (86.2) | 70 (47.9) | .001 |
| Out-of-hospital CA | 281 (87.8) | 150 (86.2) | 131 (89.7) | .29 |
| Witnessed arrest | 301 (94.1) | 170 (97.7) | 131 (89.7) | .003 |
| Time to ROSC, min | 24 [15-33] | 20 [12-29.7] | 27 [20-35] | .001 |
| No flow, min | 2 [1-5] | 2 [1-4] | 4 [1-8] | .001 |
| Low flow, min | 20 [11-28] | 17 [9.5-27] | 20 [15-30] | .001 |
| Initial pH | 7.1±0.1 | 7.21±0.15 | 7.13±0.17 | .001 |
| Serum lactate at admission, mmol/L | 6.3±4.2 | 5.3±3.7 | 7.6±4.4 | .001 |
| Initial glucose level, mg/dL | 250.4±99.8 | 227.9±95.5 | 277.4±98.5 | .001 |
CA, cardiac arrest; CPC, Cerebral Performance Category; ROSC, return of spontaneous circulation.
Data are expressed as no. (%), mean ± standard deviation or median [interquartile range].
NSE determinations were available in 202 patients at hospital admission, 289 on day 1, 287 on day 2, and 223 on day 3. Additionally, available delta NSE values were 195 between day 1 and hospital admission, 192 between day 2-admission and 152 between day 3-admission. Patients without a delta NSE value between day 3 and hospital admission had similar baseline characteristics except for a higher percentage of initial nonshockable rhythms (38.1% vs 23.6%; P=.006) and lower pH values at hospital admission (7.15 vs 7.19; P=.028). Furthermore, their NSE values were significantly higher both at 24hours (77.2 vs 50.8 ng/mL; P <.001) and at 48hours after ROSC (98.2 vs 63.9 ng/mL; P <.001), and they had a higher percentage of CPC 3-5 score at 3 months (53% vs 37.5%; P=.007). In contrast, patients with no NSE determinations during ACCU admission had higher percentages of in-hospital CA (22.4% vs 12.9%; P=.015) with a tendency to having more unwitnessed CA (12.3% vs 6.6%; P=.052) and initial nonshockable rhythms (38.2% vs 31.7%; P=.154) compared with those patients with at least 1 NSE determination. Indeed, these patients also had a worst neurological outcome at 3 months’ follow-up (CPC 3-5 65.8% vs 51.3%; P=.033).
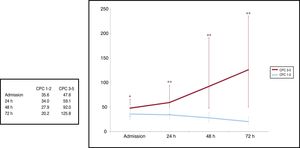
Neuron-specific enolase values and prediction of poor neurological outcomeMedian NSE values were significantly lower at admission in patients with a CPC score 1-2 in comparison with CPC 3-5: 35.6 (IQR, 23.5 to 54.6) vs 47.6 ng/mL (IQR, 29.5 to 64.1; P=.032), 24 hours: 34.0 (IQR, 25.6 to 48.6) vs 59.1 ng/mL (IQR, 35.5 to 94.0; P <.001), 48hours: 27.9 (IQR, 20 to 38.5) vs 92.0 ng/mL (IQR, 47.9 to 190.7; P<.001), and 72hours after ROSC: 20.2 (IQR, 14.8 to 30.2) vs 125.8 ng/mL (IQR, 45.9 to 235.3; P<.001) (Figure 2).

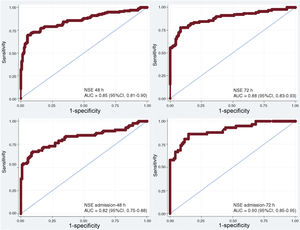
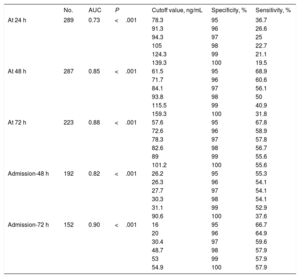
The areas under the receiver-operating characteristic curve (ROC-AUC) for NSE at 24, 48 and 72hours after ROSC for neurological outcome prediction were 0.73 (95%CI, 0.67-0.79), 0.85 (95%CI, 0.81-0.90) and 0.88 (95%CI, 0.83-0.93), respectively (P<.001). Based on the Youden index (sensitivity+specificity -1), optimal cutoff values for NSE to predict poor neurological outcome were 65.7 ng/mL on day 1 (specificity 90.7% [95%CI, 85.2-94.3], sensitivity 45.3% [95%CI, 37-53.9]), 57.7 ng/mL on day 2 (specificity 94.2% [95%CI, 89.3-96.9], sensitivity 69.7% [95%CI, 61.4-79.6]) and 45.5 ng/mL on day 3 (specificity 91.7% [95%CI, 85.8-95.3], sensitivity 77.8% [95%CI, 68.2-85.1]). Cutoff values resulting from 95%to 100% specificity in predicting poor neurological outcome are shown in Table 2.
Neuron-specific enolase cutoff values resulting from 95% to 100% specificity in predicting poor neurological outcome
| No. | AUC | P | Cutoff value, ng/mL | Specificity, % | Sensitivity, % | |
|---|---|---|---|---|---|---|
| At 24 h | 289 | 0.73 | <.001 | 78.3 | 95 | 36.7 |
| 91.3 | 96 | 26.6 | ||||
| 94.3 | 97 | 25 | ||||
| 105 | 98 | 22.7 | ||||
| 124.3 | 99 | 21.1 | ||||
| 139.3 | 100 | 19.5 | ||||
| At 48 h | 287 | 0.85 | <.001 | 61.5 | 95 | 68.9 |
| 71.7 | 96 | 60.6 | ||||
| 84.1 | 97 | 56.1 | ||||
| 93.8 | 98 | 50 | ||||
| 115.5 | 99 | 40.9 | ||||
| 159.3 | 100 | 31.8 | ||||
| At 72 h | 223 | 0.88 | <.001 | 57.6 | 95 | 67.8 |
| 72.6 | 96 | 58.9 | ||||
| 78.3 | 97 | 57.8 | ||||
| 82.6 | 98 | 56.7 | ||||
| 89 | 99 | 55.6 | ||||
| 101.2 | 100 | 55.6 | ||||
| Admission-48 h | 192 | 0.82 | <.001 | 26.2 | 95 | 55.3 |
| 26.3 | 96 | 54.1 | ||||
| 27.7 | 97 | 54.1 | ||||
| 30.3 | 98 | 54.1 | ||||
| 31.1 | 99 | 52.9 | ||||
| 90.6 | 100 | 37.6 | ||||
| Admission-72 h | 152 | 0.90 | <.001 | 16 | 95 | 66.7 |
| 20 | 96 | 64.9 | ||||
| 30.4 | 97 | 59.6 | ||||
| 48.7 | 98 | 57.9 | ||||
| 53 | 99 | 57.9 | ||||
| 54.9 | 100 | 57.9 |
AUC, area under the receiver-operating characteristic curve.
Different delta NSE values were also evaluated to analyze their discriminative ability to predict poor neurological outcome (Figure 3). Of these, delta NSE between day 2 and hospital admission and day 3-admission showed the highest ROC-AUC with 0.82 (95%CI, 0.75-0-88) and 0.90 (95%CI, 0.85-0.95) respectively (P<.001). Optimal cutoff values based on the Youden index were+8.2 ng/mL between day 2 and hospital admission (specificity 90.7% [95%CI, 83.6-94.8], sensitivity 67.1% [95%CI, 56.5-76.1]) and -1.4 ng/mL between day 3 and hospital admission (specificity 85.3% [95%CI, 76.8-91], sensitivity 86% [95%CI, 74.7-92.7]). Cutoff values with 100% specificity for poor neurological outcome were+90.6 ng/mL (sensitivity 37.6%, FPR 0%) between day 2 and hospital admission and+54.9 ng/mL (sensitivity 57.9%, FPR 0%) between day 3 and hospital admission (Table 2).

Receiver-operating characteristic curves for NSE with their areas under the curve for neurological outcome prediction according to the Cerebral Performance Category scale at 3 months. 95%CI, 95% confidence interval; AUC, area under the receiver-operating characteristic curve; NSE, neuron-specific enolase.
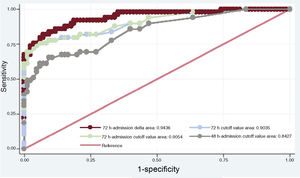
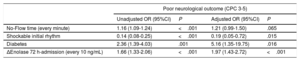
The selected predictive model using stepwise logistic regression analysis is shown in Table 3. Variables independently associated with a poor neurological outcome at 3 months’ follow-up were known diabetes mellitus (OR, 5.16; 95%CI, 1.35-19.75), initial CA rhythm (shockable rhythm; OR, 0.19; 95%CI, 0.05-0.72) and delta NSE value between 72hours after ROSC and hospital admission (every 10 ng/mL; OR, 1.97; 95%CI, 1.43-2.72). In addition, there was a tendency toward poor long-term outcome with no-flow time but this did not reach statistical significance (every minute; OR, 1.21; 95%CI, 0.99-1.50). We constructed a ROC curve (ROC-AUC of 0.94; 95%CI, 0.89-0.97) and calculated sensitivity (77.5%) and specificity (94.1%) for the prediction model, with an FPR of 5.9%. This model had a good calibration as assessed with the Hosmer-Lemeshow goodness-of-fit test (P=.62). The delta NSE value showed an NRI of 1.40 (P<.001) and IDI of 0.39 (P<.001). When this individual parameter was excluded from the multivariate model, we observed a significant decrease in the ROC-AUC (0.78; 95%CI, 0.71-0.86; P<.001). Furthermore, the selected model performed better than alternative models that included NSE as a dichotomous variable with different thresholds for the prediction of poor outcome with 100% specificity at 72hours after ROSC, delta between 48hours after ROSC and hospital admission, and delta between 72hours after ROSC and admission (Figure 4).
Variables independently associated with an unfavorable outcome at 3 months after CA*
| Poor neurological outcome (CPC 3-5) | ||||
|---|---|---|---|---|
| Unadjusted OR (95%CI) | P | Adjusted OR (95%CI) | P | |
| No-Flow time (every minute) | 1.16 (1.09-1.24) | <.001 | 1.21 (0.99-1.50) | .065 |
| Shockable initial rhythm | 0.14 (0.08-0.25) | <.001 | 0.19 (0.05-0.72) | .015 |
| Diabetes | 2.36 (1.39-4.03) | .001 | 5.16 (1.35-19.75) | .016 |
| ΔEnolase 72 h-admission (every 10 ng/mL) | 1.66 (1.33-2.06) | <.001 | 1.97 (1.43-2.72) | <.001 |
95%CI, 95% confidence interval; CA, cardiac arrest; CPC, Cerebral Performance Category; OR: odds ratio.
.")
Receiver-operating characteristic curves for different proposed models for poor neurological outcome. Among the models, the one that included the delta neuron-specific enolase value between 72 h-admission showed the highest area under the curve (0.94; 95% confidence interval, 0.89-0.97; P=.02).
The present study describes the kinetics of serum NSE in the first few days after CA in patients treated with TTM and analyzes their correlation with neurological outcome. Despite the simplicity and accessibility of this biomarker as an additional tool for neurological prognostication and the absence of an effect of sedative agents and TTM on its values or its relative low cost, NSE is still underused in routine clinical practice.13 This situation probably reflects both technical limitations and the inconclusive results of previous studies, explained by their small sample sizes and the lack of standardization in measuring techniques.14,15 It follows that the NSE threshold for prediction of poor neurological outcome with 0% FPR in TTM-treated patients varies in the literature between 25 ng/mL and 151.5 ng/mL at 48hours, and between 57.2 ng/mL and 78.9 ng/mL at 72hours after ROSC4. In our cohort, although serum NSE values after hospital admission were significantly higher in the CPC 3-5 group than in the CPC 1-2 group, there was still wide variability, especially in the poor neurological outcome group showing, at least in part, the challenge of attempting to generalize a cutoff value of this biomarker with high specificity and narrow confidence intervals (Figure 2). In line with findings of other studies,6,16 the best strategy for the use of isolated serum NSE values in our study was at 48 and 72hours after ROSC with a ROC-AUC of 0.85 and 0.88. In contrast, the predictive ability of NSE at admission and 24hours after ROSC was significantly lower (ROC-AUC of 0.62 and 0.73, respectively).
Figure 2 also shows the ascending temporal trend of NSE values in the CPC 3-5 group compared with the descending trend in the CPC 1-2 group. Most recent postcardiac arrest care guidelines4,17 state that the limited information available on NSE kinetics in the first few days after CA remains a knowledge gap, and therefore a barrier to establishing its usefulness as a prognostic biomarker. Since NSE determination has been part of our postcardiac arrest protocol for 9 years and has been quantified daily from admission to 72hours after ROSC, the strength of our study lies in the description of NSE kinetics in a large cohort of CA survivors treated with TTM and the assessment of their correlation with the best CPC score at 3 months. In addition, all blood samples from the cohort were analyzed at the same laboratory to reduce variation between different analytical methods. Because the estimated half-life of NSE in serum is approximately 24hours18 an increasing trend in serum NSE values could be explained by ongoing hypoxic brain damage and continuous release from dying neuronal cells in patients with poor neurological outcome.19
In our cohort, serum NSE changes between 72hours after ROSC and hospital admission showed the highest ROC-AUC and the cutoff value of+55 ng/mL represented 100% specificity for poor neurological outcome. In addition, delta serum NSE values were also integrated in a multivariable model in which every 10 ng/mL NSE increase between day 3 and hospital admission showed an OR of 1.97 (95%CI, 1.43-2.72) for poor neurological outcome. Although we did not include variables such as somatosensory evoked potentials, clinical examination or electroencephalogram recordings in our predictive model, the ROC-AUC of the model (0.94; 95%CI, 0.89-0.97) was higher than that of other models proposed in the literature using the recommended multimodal approach. For example, a proposed predictive model by Oddo and Rossetti20 based on a prospective cohort of 134 patients that included clinical examination, EEG, isolated NSE values, and somatosensory evoked potentials showed a ROC-AUC of 0.88 (95%CI, 0.82-0.93) for poor neurological outcome (CPC 3-5) at 3 months of follow-up. This similar prognostic accuracy compared with the isolated NSE values at 72hours after ROSC and delta NSE values between 72hours after ROSC and hospital admission in our study strengthens the position of NSE as a prognostic biomarker of neurological outcome in CA survivors. However, NSE is not specific to neuronal damage and can be produced by noncentral nervous system sources (hemolysis, neuroendocrine tumors, myenteric plexus, muscle, and adipose tissue breakdown)17 and its levels could be influenced by age, sex, and body mass index.21 For these reasons, in line with current guidelines and recent studies,6,19,22 we recommend including serum NSE kinetics as part of a multimodal approach based on the integration of different methods to increase its predictive value to identify patients with unfavorable neurological outcome.
The present study has several limitations due to its retrospective nature. First, a substantial number of patients were excluded from the analysis either because of a lack of NSE samples during ACCU admission or because their blood samples showed hemolysis. The number of patients excluded was greater due to the absence of NSE determination at hospital admission or at 72hours after ROSC, probably given the difficulty of the requirement of this biomarker in the context of an admission for CA and due to a selection bias in view of their worse CA characteristics and neurological outcome. Secondly, serum NSE values were mostly available at the time of neurological prognostication, probably influencing decision-making on WLST. Thirdly, we were not able to include in our predictive model variables such as electroencephalogram recordings, somatosensory evoked potentials, clinical examination, or neuroimaging findings. However, we feel our results represent the current daily practice of a tertiary referral center in postcardiac arrest care that included a substantial cohort of CA survivors in comparison with other studies. A cutoff value of delta NSE+55 ng/mL between 72hours after ROSC and hospital admission for poor neurological outcome should be evaluated and validated in an external prospective cohort before its implementation in current practice.
ConclusionsThe present study shows that delta NSE value between 72hours after ROSC and hospital admission has a high predictive value for poor neurological outcome. Our results support the idea that serial NSE measurements rather than isolated values should be included in a multimodal postcardiac arrest neurological prognostication strategy. In our cohort, a delta NSE cutoff value of+55 ng/mL between 72hours after ROSC and hospital admission showed 100% specificity for poor neurological outcome at 3 months of follow-up after CA.
FUNDINGFellowship for Training and Research in Acute Cardiovascular Care granted by the Working Group for Ischemic Heart Disease and Acute Cardiovascular Care of the Spanish Society Of Cardiology.
CONFLICTS OF INTERESTNone declared.
- –
A significant percentage of CA deaths occur in patients admitted into intensive care units. WLST based on a poor neurological prognosis represents the most frequent cause of death in these patients.
- –
Current resuscitation guidelines recommend basing neurological prognostication after CA on a multimodal approach, including biomarkers such as NSE.
- –
Current guidelines do not recommend any specific NSE cutoff value for poor neurological prognosis but suggest sampling this enzyme at multiple time-points to detect trends and reduce the risk of false-positive results due to hemolysis. However, the best way to interpret these trend values remains unclear.
- –
Since NSE determination has been part of our postcardiac arrest protocol for 9 years and has been quantified daily from admission to 72hours after ROSC, the strength of our study lies in the description of NSE kinetics in a large cohort of CA survivors treated with TTM and the assessment of their correlation with the best CPC score at 3 months after CA.
.
The study is funded by the Working Group for Ischemic Heart Disease and Acute Cardiovascular Care of the Spanish Society of Cardiology.