Obesity is a significant public health problem associated with an increased risk of cardiovascular risk factors (CVRF). The aim of this study was to determine the prevalence of overweight and abdominal obesity (AO) in the Spanish population aged ≥ 3 years and to analyze the influence of sociodemographic and lifestyle factors and their association with CVRF.
MethodsThe sample was drawn from the ENPE study (n=6800). The study protocol included individual anthropometric measurements, sociodemographic factors, food intake (food frequency questionnaire), physical activity, lifestyles, and health problems.
ResultsThe estimated overall prevalence of obesity (22.0%; 95%CI, 21.0-23.0) and AO (64.7%; 95%CI, 63.5-65.8) was higher in men, in persons aged ≥ 65 years, and in those with a lower socioeconomic level or from southern regions. Lifestyle pattern was significantly associated with obesity and AO (P=.011), which were less likely in people with an active lifestyle pattern (P <.0001). Obesity (OR, 1.85; 95%CI, 1.24-2.78) and AO (OR, 2.16; 95%CI, 1.1-4.24) were positively associated with CVRF. Clustering of CVRF with obesity and/or AO was higher in women (12.6%; 95%CI, 11.4-13.9) and in persons aged ≥ 65 years (32.7%; 95%CI, 30.0-35.4).
ConclusionsThe prevalence of obesity and AO in the Spanish population is high; it is higher in men, increases with age, and is inversely related to socioeconomic status. A lifestyle pattern combining a higher level of physical activity, moderate sedentariness and a Mediterranean dietary pattern is associated with a lower probability of obesity, AO, and CVRF.
Keywords
Abbreviations
Obesity is a worldwide health problem associated with an increased risk of cardiovascular disease, type 2 diabetes mellitus, chronic kidney disease, several types of cancer, musculoskeletal disorders, and body image issues.1 Since the 1980s, there has been an overall increase in the prevalence of high body mass index values (BMI = weight in kilograms divided by height in meters squared). The increase among children and adolescents is of particular concern.2 It has been estimated that 41% of deaths and 34% of disability-adjusted life years related to BMI are due to cardiovascular disease in obese individuals. Furthermore, it has been shown that obesity in childhood increases associated cardiovascular risk factors (CVRFs) in adults, and thus there is a need for adequate surveillance systems to allow early diagnosis, monitor trends, and assess the efficacy of preventive interventions.3,4
BMI has long been accepted as an indicator for estimating body weight classification for screening, and epidemiological analysis, although it has limitations and has led to some controversy.5 In the infant and juvenile population, several age- and sex-specific cutoff points have been proposed according to reference growth standards.6 In older adults, BMI values of less than 23 have been associated with an increased risk of mortality.7
Obesity has a negative effect on CVRFs, hypertension, dyslipidemia, insulin resistance, and type 2 diabetes mellitus.1,2,8 Regardless of body fat, excess visceral abdominal adipose tissue is a reliable predictor of acquiring CVRFs.9
Obesity, abdominal obesity (AO), dyslipidemia, diabetes, and hypertension are recognized as biological risk factors for cardiovascular disease. These factors often cluster and lead to increased risk.9 Associations have been found between inadequate diet, a lack of physical activity, and sedentary lifestyles and an increased risk of obesity, cardiovascular disease, and the premature onset of other chronic conditions.10
This aim of this study was to provide a general estimate of the prevalence of overweight and AO in a random sample of the Spanish population older than 3 years and to analyze the influence of sociodemographic and lifestyle factors and their association with CVRFs. Previous studies have described the distribution of anthropometric indicators and prevalence by age bracket and sex.11,12
METHODSThis analysis formed part of the ENPE study (Estudio Nutricional de la Población Española).11,12 The ENPE study was an observational cross-sectional study conducted in a representative population-based probabilistic sample (scope: persons more then 3 years of age residing in primary residences in Spain), which was selected using a random multistep procedure, with stratification of the units from the first step (census sections) according to autonomous community (k = 17) with 400 individuals per stratum (n = 6800). Second level: primary residences in each census unit. Residences were selected by random route sampling, 1 individual per household, with quotas controlled by age bracket (3-8, 9-18, 19-64, and ≥ 65 years), sex, and municipality size according to the population census (Spanish National Institute of Statistics, January 2014). Sampling error, 1.62%. The sample was weighted according to the Spanish population distribution by age bracket, sex, and municipality size. Variance was estimated by applying bootstrap techniques without correction for finite populations.
Information was collected by personal interview at the participant's home (May 2014-May 2015). The sample and the fieldwork logistics were designed and coordinated by a population studies company (SIGMA DOS).
The exclusion criteria for the anthropometric measurements were as follows: being pregnant, not being able to stand upright, or having limbs immobilized with nonremovable plaster casts. In total, 6800 individuals were included, of whom 3514 were women (51.7%).
Anthropometric measurementsIndividual anthropometric measurements were taken by highly trained professional surveyors who had received specific face-to-face training from the study authors. We followed standardized international protocols13 that had been previously tested in a pilot study. Measurements were performed with the participants standing upright, barefoot, and lightly clothed. The following instruments and procedures were used: height was measured using a Seca 213 portable height gauge (Seca, Germany: range, 0-200cm; accuracy, 0.1cm); body weight was measured using a calibrated Seca 803 digital scale (range: 0.1-150kg; accuracy, 0.1kg); waist circumference was measured in triplicate at the midpoint between lowest costal margin and iliac crest using a Seca 201 retractable tape measure (range, 0-150cm; accuracy, 0.1cm). We calculated the BMI and waist-to-height ratio, which was defined as the waist circumference (cm) divided by height (cm).
Quality controls showed that intraobserver- and interobserver-related measurement errors were less than 1% for all anthropometric parameters reported: these values were lower than those considered acceptable.13
Overweight (preobesity) and obesity were classified by BMI values of at least 25 and at least 30, respectively. In children younger than 18 years, age- and sex-specific BMI z-scores and cutoff points were used according to World Health Organization criteria.6 AO was defined as a waist-to-height ratio of more than 0.5.14
Sociodemographic factorsWe incuded the following sociodemographic factors: sex, age bracket (3-8, 9-18, 19-64, and ≥ 65 years), family socioeconomic status according to educational level and occupation (high/middle-high, middle-middle, middle-low, and low), geographic region (North-West: Galicia and Principality of Asturias; North-East: Cantabria and Basque Country; Center: Castile and León, Community of Madrid, Extremadura, and Castile-La Mancha; Center-East: Chartered Community of Navarre, La Rioja, and Aragon; East: Catalonia, Balearic Islands, and Valencian Community; South: Canary Islands, Andalusia, and Region of Murcia), and size of locality of residence (from < 5000 - > 200 000 population).
LifestyleWe included the following lifestyle factors: dietary habits, physical activity, sedentary lifestyle, hours of sleep, and smoking habits (smoker, exsmoker, nonsmoker). The habitual consumption of food and beverages was estimated using a semiquantitative food consumption frequency questionnaire that was completed by interview. Information on physical activity levels and sedentary lifestyles was collected using the International Physical Activity Questionnaire (IPAQ)15 adapted to children younger than 16 years.16
Health problemsHealth problems were assessed according the particpants’ response to the following question: “Do you have any of the following chronic health problems: high cholesterol (dyslipidemia), high blood pressure, or diabetes?” (response format: yes/no).
Data analysisWe analyzed participants older than 3 years with full information available on the variables of interest (BMI: n = 6422 [94.4%]; waist circumference and height: n = 6454 [94.9%]). We calculated the prevalence of obesity and AO and their 95% confidence intervals (95%CI) by age and sex bracket. The sample was weighted according to the distribution of the Spanish population. The estimated prevalence rates were calculated for each autonomous community using a direct method according to the Spanish population distribution. The chi-square and z-test were used to compare prevalence rates according to age and sex. Logistic regression models were used to analyze associations between sociodemographic and lifestyle factors and the prevalence of obesity and AO.
After transformation of habitual daily food consumption (g/d) into z-scores, 4 dietary patterns were identified using principal components factor analysis with varimax rotation (Kaiser-Meyer-Olkin test: 0.82). To identify lifestyle profiles in the group older than 18 years, a 2-stage cluster analysis was performed including factor scores, the usual number of daily meals, physical activity (low, moderate, high), mean sedentary time (quartiles), and usual hours of daily sleep. These profiles as well as obesity and AO adjusted for sociodemographic factors were entered into logistic regression models as independent and dependent variables, respectively.
In persons older than 18 years, logistic regression models were used to analyze the association between weight classification and AO, smoking and lifestyle profiles (independent variables) and dyslipidemia, hypertension, and diabetes (dependent variables) adjusted for sociodemographic factors. We also analyzed the association between sociodemographic factors and lifestyles (independent variables) and the clustering of 3 or more CVRFs (obesity, AO, dyslipidemia, hypertension, and diabetes) (n = 4340 individuals with valid full data). A P value of <.05% was used as a cutoff for statistical significance. The analysis took the complex design of the sample into consideration and was performed using IBM SPSS v. 24.0.
Ethical considerationsAll participants were informed of the study objectives and procedures and gave written consent to participate. The study protocol was approved by the Euskadi Clinical Research Ethics Committee (PI2015147) and performed in accordance with the World Medical Association's Declaration of Helsinki for research involving human participants. It was conducted in compliance with Organic Law 15/1999 of 13 December on the protection of personal data in all processes.
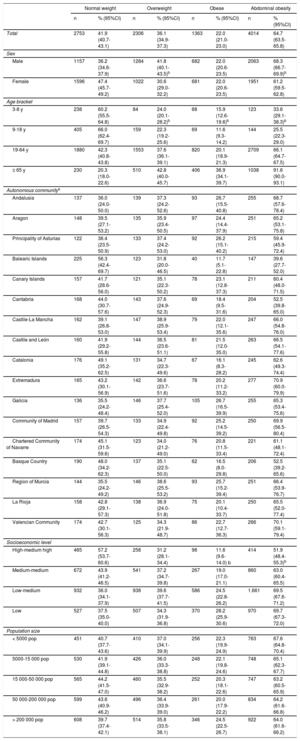
RESULTSThe overall prevalence of obesity was 22.0% (95%CI, 21.0%-23.0%) (table 1) and that of overweight was 36.1% (95%CI, 34.9%-37.3%), which was significantly higher in males (41.8%; 95%CI, 40.1%-43.5%). Overweight and obesity increased with age after the age of 19 years, with higher prevalence in the age bracket of 65 years and older. In total 15.9% (95%CI, 12.6%-19.6%) of individuals in the 3 to 8 years age bracket were obese and 11.6% (95%CI, 9.3%-14.2%) of individuals in the 9 to 18 years age bracket were obese.
Prevalence of weight classifications according to body mass index values and abdominal obesity (waist/height index) in the total sample by sex, age bracket, autonomous community, socioeconomic level, and size of locality of residence
| Normal weight | Overweight | Obese | Abdominal obesity | |||||
|---|---|---|---|---|---|---|---|---|
| n | % (95%CI) | n | % (95%CI) | n | % (95%CI) | n | % (95%CI) | |
| Total | 2753 | 41.9 (40.7-43.1) | 2306 | 36.1 (34.9-37.3) | 1363 | 22.0 (21.0-23.0) | 4014 | 64.7 (63.5-65.8) |
| Sex | ||||||||
| Male | 1157 | 36.2 (34.6-37.9) | 1284 | 41.8 (40.1-43.5)b | 682 | 22.0 (20.6-23.5) | 2063 | 68.3 (66.7-69.9)b |
| Female | 1596 | 47.4 (45.7-49.2) | 1022 | 30.6 (29.0-32.2) | 681 | 22.0 (20.6-23.5) | 1951 | 61.2 (59.5-62.8) |
| Age bracket | ||||||||
| 3-8 y | 238 | 60.2 (55.5-64.8) | 84 | 24.0 (20.1-28.2)b | 68 | 15.9 (12.6-19.6)b | 123 | 33.6 (29.1-38.3)b |
| 9-18 y | 405 | 66.0 (62.4-69.7) | 159 | 22.3 (19.2-25.6) | 69 | 11.6 (9.3-14.2) | 144 | 25.5 (22.3-29.0) |
| 19-64 y | 1880 | 42.3 (40.8-43.8) | 1553 | 37.6 (36.1-39.1) | 820 | 20.1 (18.9-21.3) | 2709 | 66.1 (64.7-67.5) |
| ≥ 65 y | 230 | 20.3 (18.0-22.6) | 510 | 42.8 (40.0-45.7) | 406 | 36.9 (34.1-39.7) | 1038 | 91.6 (90.0-93.1) |
| Autonomous communitya | ||||||||
| Andalusia | 137 | 36.0 (24.0-50.0) | 139 | 37.3 (24.2-52.6) | 93 | 26.7 (15.5-40.8) | 255 | 68.7 (57.6-78.4) |
| Aragon | 148 | 39.5 (27.1-53.2) | 135 | 35.9 (23.4-50.5) | 97 | 24.4 (14.4-37.9) | 251 | 65.2 (53.1-75.8) |
| Principality of Asturias | 122 | 36.4 (23.5-50.9) | 133 | 37.4 (24.2-53.0) | 92 | 26.2 (15.1-40.2) | 215 | 59.4 (45.9-72.4) |
| Balearic Islands | 225 | 56.3 (42.4-69.7) | 123 | 31.8 (20.0-46.5) | 40 | 11.7 (5.1-22.8) | 147 | 39.6 (27.7-52.0) |
| Canary Islands | 157 | 41.7 (28.6-56.0) | 121 | 35.1 (22.3-50.2) | 78 | 23.1 (12.8-37.3) | 211 | 60.4 (48.0-71.5) |
| Cantabria | 168 | 44.0 (30.7-57.6) | 143 | 37.6 (24.9-52.3) | 69 | 18.4 (9.5-31.6) | 204 | 52.5 (39.8-65.0) |
| Castile-La Mancha | 162 | 39.1 (26.8-53.0) | 147 | 38.9 (25.9-53.4) | 79 | 22.0 (12.1-35.6) | 247 | 66.0 (54.8-76.0) |
| Castile and León | 160 | 41.9 (29.2-55.8) | 144 | 36.5 (23.6-51.1) | 81 | 21.5 (12.0-35.0) | 263 | 66.5 (54.1-77.6) |
| Catalonia | 176 | 49.1 (35.2-62.5) | 131 | 34.7 (22.3-49.6) | 67 | 16.1 (8.3-28.2) | 245 | 62.6 (49.3-74.4) |
| Extremadura | 165 | 43.2 (30.1-56.9) | 142 | 36.6 (23.7-51.6) | 78 | 20.2 (11.2-33.2) | 277 | 70.9 (60.0-79.9) |
| Galicia | 136 | 35.5 (24.2-48.4) | 146 | 37.7 (25.4-52.0) | 105 | 26.7 (16.5-39.9) | 255 | 65.3 (53.4-75.6) |
| Community of Madrid | 157 | 39.7 (26.5-54.3) | 133 | 34.9 (22.4-49.8) | 92 | 25.2 (14.5-39.2) | 250 | 69.9 (56.5-80.4) |
| Chartered Community of Navarre | 174 | 45.1 (31.5-59.6) | 123 | 34.0 (21.2-49.0) | 76 | 20.8 (11.5-33.4) | 221 | 61.1 (48.1-72.4) |
| Basque Country | 190 | 48.0 (34.2-62.3) | 137 | 35.1 (22.5-50.0) | 62 | 16.5 (8.0-29.8) | 206 | 52.5 (39.2-65.6) |
| Region of Murcia | 144 | 35.5 (24.2-49.2) | 146 | 38.6 (25.5-53.2) | 93 | 25.7 (15.2-39.4) | 251 | 66.4 (53.9-76.7) |
| La Rioja | 158 | 42.8 (29.1-57.3) | 138 | 36.9 (24.0-51.8) | 75 | 20.1 (10.4-33.7) | 250 | 65.5 (52.0-77.4) |
| Valencian Community | 174 | 42.7 (30.1-56.3) | 125 | 34.3 (21.9-48.7) | 86 | 22.7 (12.7-36.3) | 266 | 70.1 (59.1-79.4) |
| Socioeconomic level | ||||||||
| High-medium high | 465 | 57.2 (53.7-60.6) | 258 | 31.2 (28.1-34.4) | 98 | 11.6 (9.6-14.0) b | 414 | 51.9 (48.4-55.3)b |
| Medium-medium | 672 | 43.9 (41.2-46.5) | 541 | 37.2 (34.7-39.8) | 267 | 19.0 (17.0-21.1) | 860 | 63.0 (60.4-65.5) |
| Low-medium | 932 | 36.0 (34.1-37.9) | 938 | 39.6 (37.7-41.5) | 586 | 24.5 (22.8-26.2) | 1.661 | 69.5 (67.6-71.2) |
| Low | 527 | 37.5 (35.0-40.0) | 507 | 34.3 (31.9-36.8) | 370 | 28.2 (25.9-30.6) | 970 | 69.7 (67.3-72.0) |
| Population size | ||||||||
| < 5000 pop | 451 | 40.7 (37.7-43.6) | 410 | 37.0 (34.1-39.9) | 256 | 22.3 (19.9-24.9) | 763 | 67.6 (64.8-70.4) |
| 5000-15 000 pop | 530 | 41.9 (39.1-44.8) | 426 | 36.0 (33.3-38.8) | 248 | 22.1 (19.8-24.6) | 748 | 65.1 (62.3-67.7) |
| 15 000-50 000 pop | 565 | 44.2 (41.5-47.0) | 460 | 35.5 (32.9-38.2) | 252 | 20.3 (18.1-22.6) | 747 | 63.2 (60.5-65.9) |
| 50 000-200 000 pop | 599 | 43.6 (40.9-46.2) | 496 | 36.4 (33.9-39.0) | 261 | 20.0 (17.9-22.2) | 834 | 64.2 (61.6-66.8) |
| > 200 000 pop | 608 | 39.7 (37.4-42.1) | 514 | 35.8 (33.5-38.1) | 346 | 24.5 (22.5-26.7) | 922 | 64.0 (61.6-66.2) |
95%CI, 95% confidence interval; pop, population.
The estimated prevalence of AO (64.7%; 95%CI, 63.5%-65.8%) was higher in males (68.3%; 95%CI, 66.7%-69.9%), increased with age from the age of 19 years, and reached the highest rate in the age bracket of 65 years and older (91.6%; 95%CI, 90.0%-93.1%).
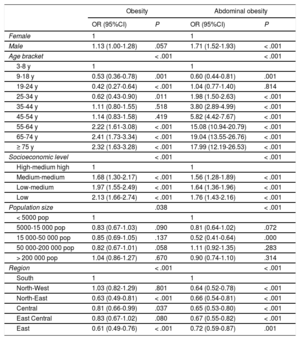
Factors associated with overweight and abdominal obesitySociodemographic factorsTable 1 shows the prevalence of each BMI category according to socioeconomic level, local population size, and autonomous community (adjusted for age). Table 2 shows the odds ratios (OR) of the prevalence of obesity and AO and their corresponding 95%CIs according to sociodemographic factors. A significant association was found between the prevalence of obesity and socioeconomic status, local population size, and geographic region. There was a lower risk of obesity in the 9 to 34 year age bracket than in the 3 to 8 year age bracket, but there was a significant increase in its risk after the age of 55 years. An inverse association was found between socioeconomic level and a lower risk of obesity in the North-Eastern, Central, and Eastern regions compared with the South.
Sociodemographic factors associated with the prevalence of obesity and abdominal obesity
| Obesity | Abdominal obesity | |||
|---|---|---|---|---|
| OR (95%CI) | P | OR (95%CI) | P | |
| Female | 1 | 1 | ||
| Male | 1.13 (1.00-1.28) | .057 | 1.71 (1.52-1.93) | < .001 |
| Age bracket | < .001 | < .001 | ||
| 3-8 y | 1 | 1 | ||
| 9-18 y | 0.53 (0.36-0.78) | .001 | 0.60 (0.44-0.81) | .001 |
| 19-24 y | 0.42 (0.27-0.64) | < .001 | 1.04 (0.77-1.40) | .814 |
| 25-34 y | 0.62 (0.43-0.90) | .011 | 1.98 (1.50-2.63) | < .001 |
| 35-44 y | 1.11 (0.80-1.55) | .518 | 3.80 (2.89-4.99) | < .001 |
| 45-54 y | 1.14 (0.83-1.58) | .419 | 5.82 (4.42-7.67) | < .001 |
| 55-64 y | 2.22 (1.61-3.08) | < .001 | 15.08 (10.94-20.79) | < .001 |
| 65-74 y | 2.41 (1.73-3.34) | < .001 | 19.04 (13.55-26.76) | < .001 |
| ≥ 75 y | 2.32 (1.63-3.28) | < .001 | 17.99 (12.19-26.53) | < .001 |
| Socioeconomic level | < .001 | < .001 | ||
| High-medium high | 1 | 1 | ||
| Medium-medium | 1.68 (1.30-2.17) | < .001 | 1.56 (1.28-1.89) | < .001 |
| Low-medium | 1.97 (1.55-2.49) | < .001 | 1.64 (1.36-1.96) | < .001 |
| Low | 2.13 (1.66-2.74) | < .001 | 1.76 (1.43-2.16) | < .001 |
| Population size | .038 | < .001 | ||
| < 5000 pop | 1 | 1 | ||
| 5000-15 000 pop | 0.83 (0.67-1.03) | .090 | 0.81 (0.64-1.02) | .072 |
| 15 000-50 000 pop | 0.85 (0.69-1.05) | .137 | 0.52 (0.41-0.64) | .000 |
| 50 000-200 000 pop | 0.82 (0.67-1.01) | .058 | 1.11 (0.92-1.35) | .283 |
| > 200 000 pop | 1.04 (0.86-1.27) | .670 | 0.90 (0.74-1.10) | .314 |
| Region | < .001 | < .001 | ||
| South | 1 | 1 | ||
| North-West | 1.03 (0.82-1.29) | .801 | 0.64 (0.52-0.78) | < .001 |
| North-East | 0.63 (0.49-0.81) | < .001 | 0.66 (0.54-0.81) | < .001 |
| Central | 0.81 (0.66-0.99) | .037 | 0.65 (0.53-0.80) | < .001 |
| East Central | 0.83 (0.67-1.02) | .080 | 0.67 (0.55-0.82) | < .001 |
| East | 0.61 (0.49-0.76) | < .001 | 0.72 (0.59-0.87) | .001 |
95%CI, 95% confidence interval; OR, odds ratio of prevalence; pop, population.
An association was found between AO and sex, age, socioeconomic level, local population size, and geographic region (table 1). The risk of AO was higher in males than in females and progressively increased with age, especially after 55 years of age. An inverse association was found between AO and socioeconomic level.
LifestyleFour dietary patterns were identified: “meat-protein-pasta” (MPP), “sweets-cakes-dairy foods” (SCM), “Mediterranean diet” (MD) with more fish, legumes, yogurt, olive oil, fruit, and vegetables, and “salty snacks-dairy desserts-sweetened beverages” (SSDDSB). In persons older than 18 years, 4 lifestyle profiles were identified, which were mainly defined by the level of physical activity and sedentary time: a) not active-moderately sedentary/ MD+pattern, moving away from he SSDDSB pattern; b) very active-moderately sedentary/higher scores on the MD++, SCM+, and SSDDSB+patterns; c) not active-very sedentary/neutral diet; and d) not active-very sedentary/higher MPP+pattern score and lower SCM-pattern score.
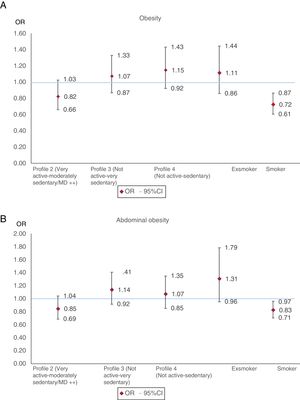
The prevalence of obesity was significantly lower (P < .0001) in the active profile (17.7%) than in the other 3 profiles (24.5%, 22.7%, and 22.2%). The prevalence of AO was also significantly lower (P < .0001) in the active profile (62.7%) than in the other 3 profiles (72.0%, 69.8%, and 72.6%). Figure 1 shows the ORs of the prevalence of obesity and AO in models adjusted for age, sex, and socioeconomic status for the lifestyle and smoking profiles of persons older than 18 years. We estimated the ORs for obesity (OR = 0.82; 95%CI, 0.66-1.03) (figure 1A) and AO (OR = 0.85; 95%CI, 0.69-1.04) (figure 1B) of the very active-moderately sedentary profile and the not active-moderately sedentary profile. The ORs for obesity (OR = 0.72; 95%CI, 0.61-0.87) and AO (OR = 0.83; 95%CI, 0.71-0.97) were significantly lower in smokers than in nonsmokers.
 and abdominal obesity (B) according to lifestyle profile and smoking. Odds ratios of prevalence adjusted for sociodemographic factors in persons older than 18 years. 95%CI, 95% confidence interval; MD, Mediterranean diet; OR, odds ratio.")
Odds ratios of the prevalence of obesity (A) and abdominal obesity (B) according to lifestyle profile and smoking. Odds ratios of prevalence adjusted for sociodemographic factors in persons older than 18 years. 95%CI, 95% confidence interval; MD, Mediterranean diet; OR, odds ratio.
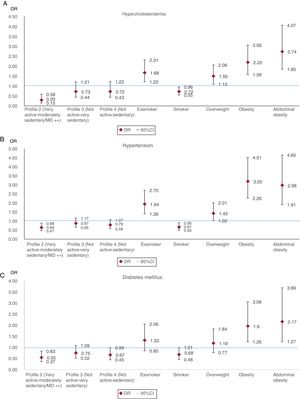
Figure 2A-C shows the ORs of the prevalence of obesity and AO in relation to the self-reported presence of dyslipidemia (hypercholesterolemia), hypertension, and diabetes in persons 18 years and older. In models adjusted for age, sex, socioeconomic status, smoking, and lifestyle profile, a postive association was found between overweight, obesity and AO and dyslipidemia (figure 2A) and hypertension (figure 2B). The risk of hypertension was lower in persons with a very active-low sedentary profile than persons with a not active-moderately sedentary profile. An association was found between obesity and AO and a higher risk of diabetes mellitus (figure 2C). The risk was lower in persons in the very active-moderately sedentary profile.
, hypertension (B), and diabetes mellitus (C) according to lifestyle profile, smoking habit, weight classification, and abdominal obesity. Odds ratios of prevalence adjusted for age, sex, socioeconomic level, smoking habit, and lifestyle profile in persons older than 18 years. 95%CI, 95% confidence interval; MD, Mediterranean diet; OR, odds ratio.")
Odds ratios of the prevalence of hypercholesterolemia (A), hypertension (B), and diabetes mellitus (C) according to lifestyle profile, smoking habit, weight classification, and abdominal obesity. Odds ratios of prevalence adjusted for age, sex, socioeconomic level, smoking habit, and lifestyle profile in persons older than 18 years. 95%CI, 95% confidence interval; MD, Mediterranean diet; OR, odds ratio.
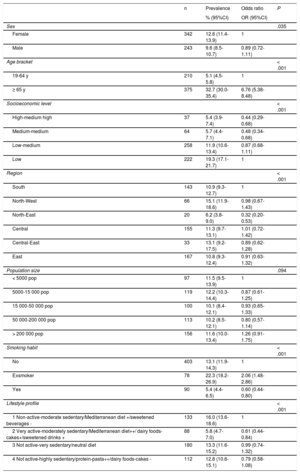
The clustering of self-reported dyslipidemia, hypertension, and diabetes and obesity or AO was significantly higher in women and in persons of 65 years of age and older (table 3). An inverse association was found between the OR for the prevalence of CVRFs and socioeconomic level; in the North-East region vs the South region, OR = 0.32 (95%CI, 0.20-0.53); in smokers vs nonsmokers, OR = 0.60 (95%CI, 0.44-0.80); and in exsmokers, OR = 2.06 (95%CI, 1.48-2.86). The risk of clustering of CVRFs was lower in the very active-moderately sedentary profile/ MD++pattern than in the nonactive-moderately sedentary profile/MD+pattern.
Prevalence of the clustering of 3 or more biological cardiovascular risk factors and the odds ratio of prevalence according to sociodemographic factors and lifestyles in the population older than 18 years
| n | Prevalence | Odds ratio | P | |
|---|---|---|---|---|
| % (95%CI) | OR (95%CI) | |||
| Sex | .035 | |||
| Female | 342 | 12.6 (11.4-13.9) | 1 | |
| Male | 243 | 9.6 (8.5-10.7) | 0.89 (0.72-1.11) | |
| Age bracket | < .001 | |||
| 19-64 y | 210 | 5.1 (4.5-5.8) | 1 | |
| ≥ 65 y | 375 | 32.7 (30.0-35.4) | 6.76 (5.38-8.48) | |
| Socioeconomic level | < .001 | |||
| High-medium high | 37 | 5.4 (3.9-7.4) | 0.44 (0.29-0.68) | |
| Medium-medium | 64 | 5.7 (4.4-7.1) | 0.48 (0.34-0.68) | |
| Low-medium | 258 | 11.9 (10.6-13.4) | 0.87 (0.68-1.11) | |
| Low | 222 | 19.3 (17.1-21.7) | 1 | |
| Region | < .001 | |||
| South | 143 | 10.9 (9.3-12.7) | 1 | |
| North-West | 66 | 15.1 (11.9-18.6) | 0.98 (0.67-1.43) | |
| North-East | 20 | 6.2 (3.8-9.0) | 0.32 (0.20-0.53) | |
| Central | 155 | 11.3 (9.7-13.1) | 1.01 (0.72-1.42) | |
| Central-East | 33 | 13.1 (9.2-17.5) | 0.89 (0.62-1.28) | |
| East | 167 | 10.8 (9.3-12.4) | 0.91 (0.63-1.32) | |
| Population size | .094 | |||
| < 5000 pop | 97 | 11.5 (9.5-13.9) | 1 | |
| 5000-15 000 pop | 119 | 12.2 (10.3-14.4) | 0.87 (0.61-1.25) | |
| 15 000-50 000 pop | 100 | 10.1 (8.4-12.1) | 0.93 (0.65-1.33) | |
| 50 000-200 000 pop | 113 | 10.2 (8.5-12.1) | 0.80 (0.57-1.14) | |
| > 200 000 pop | 156 | 11.6 (10.0-13.4) | 1.26 (0.91-1.75) | |
| Smoking habit | < .001 | |||
| No | 403 | 13.1 (11.9-14.3) | 1 | |
| Exsmoker | 78 | 22.3 (18.2-26.9) | 2.06 (1.48-2.86) | |
| Yes | 90 | 5.4 (4.4-6.5) | 0.60 (0.44-0.80) | |
| Lifestyle profile | < .001 | |||
| 1 Non-active-moderate sedentary/Mediterranean diet +/sweetened beverages - | 133 | 16.0 (13.6-18.6) | 1 | |
| 2 Very active-moderately sedentary/Mediterranean diet++/ dairy foods-cakes+/sweetened drinks + | 88 | 5.8 (4.7-7.0) | 0.61 (0.44-0.84) | |
| 3 Not active-very sedentary/neutral diet | 180 | 13.3 (11.6-15.2) | 0.99 (0.74-1.32) | |
| 4 Not active-highly sedentary/protein-pasta++/dairy foods-cakes - | 112 | 12.8 (10.6-15.1) | 0.79 (0.58-1.08) |
95%CI, 95% confidence interval; OR, odds ratio for prevalence; pop, population.
In the ENPE study sample, the estimated prevalence of overweight was 58.1% (95%CI, 56.9%-59.3%) and that of obesity was 22.0% (95%CI, 21.0%-23.0%). Overweight was higher in males and overweight and obesity increased with age after 19 years of age. The estimated prevalence of AO was 64.7% (95%CI, 63.5%-65.8%), higher in males, and increased with age after 19 years of age. These figures are similar to those reported in Ontario and Quebec (Canada) (6-79 years),17 and in Portugal (3 months-84 years).18 A study conducted in the United States (2015-2016) reported obesity prevalences of 39.6% in persons of at least 20 years.19 In the geographical area of the Organization for Economic Cooperation and Development (OECD), the estimated average of overweight was 60% and that of obesity was 25% (18.7% of persons younger than 20 years were overweight and 9.9% were obese), with obesity figures fluctuating between 3.6% (India) and 39.6% (United States).20
Recent analyses have projected a 16% increase in excess weight in Spain by 2030, with a 58% increase in direct health care costs.21
The Spanish National Health Surveys provide relevant public health information on weight, height, and health problems reported by participants. These data have been used to analyze the prevalence of obesity and associated factors in Spain22 and are of undoubted interest. However, these analyses underestimate the prevalence of obesity, with an error that has been calculated to be between 2.0 and 2.7 percentage points in men and 4.7 and 5.9 percentage points in women23 vs estimates based on measurements. The magnitude of obesity and its health, economic, and social impact necessitate a measurement-based quality surveillance system, which also includes quality information on related factors. Failing this, valuable information would be provided by well-designed population-based cross-sectional studies using well-designed protocols and individual anthropometric measurements.
The results of the present study are in line with those of previous studies, which found unequal distributions of obesity: its prevalence was higher in persons in lower socioeconomic brackets.22,24,25 Likewise, previous studies have found socioeconomic inequalities in the distribution of risk behaviors, such as poor dietary habits, low levels of physical activity, and tobacco consumption.24,25 Other studies have also found differences in the distribution of eating habits and physical activity according to autonomous community, which was mediated by the unequal distribution of educational and socioeconomic levels.26,27
A significant association was observed between the risk of obesity and AO and the size of the locality of residence. Other studies have found higher prevalences of obesity and AO in rural areas28 and have suggested social selection mechanisms as an explanation. It is important to pay attention to the urban environment in smaller localities and especially to the resources and health promotion initiatives available to reinforce nutritional literacy strategies and promote exercise together with initiatives that favor a less sedentary lifestyle in all age brackets.
Eating habits, physical activity, sedentary lifestyle, and hours of sleep have been associated with obesity.10,29 Some studies have analyzed the tendency of lifestyles to cluster30,31 and their relationship with obesity. The ENPE study identified 4 dietary patterns and 4 lifestyle profiles. Similar lifestyle patterns have been identified in studies on adults27,30 and children and adolescents.31 This type of analysis, which analyzes both lifestyle and diatetary pattern,is of particular interest because it can be used to design intervention strategies that are adjusted to the characteristics of the group under study. Risk behaviors tend to cluster, whereas higher levels of physical activity tend to cluster with better dietary profiles, although they may differ according to sociodemographic characteristics.30,31 The present study found an association between the more active-moderately sedentary profile/MD++pattern and a lower risk of obesity, dyslipidemia, hypertension, and diabetes.
Spanish studies have used objective indicators to analyze the clustering of CVRFs (obesity, AO, dyslipidemia, hypertension, diabetes).27,32,33 Our study found that there was a higher risk of clusters of 3 or more CVRFs in exsmokers than in smokers and persons with a more active-moderately sedentary lifestyle. Other studies have also found a higher prevalence of CVRF clusters in nonsmokers and former smokers.32,34 Being at increased cardiovascular risk could favor smoking cessation in smokers (exsmokers) after receiving medical advice (reverse causality). It is also known that smoking cessation is associated with weight gain, risk of obesity,34 and diabetes.35 Patients with concurrent obesity, dyslipidemia, hypertension, and a smoking habit could have refused to participate or even died and thus would not have been included in the prevalent cases.
Positive associations have been found between smoking and obesity, and even between obesity and the number of cigarettes consumed, especially in adolescents and young adults.34 It would be desirable to reinforce smoking prevention strategies and promote healthy lifestyles in adolescents and young adults. Furthermore, smoking cessation interventions should also include measures aimed at adjusting energy intake and promoting the practice of physical activity to avoid or limit weight gain.
Strengths and limitationsThe ENPE study had several strengths. It included a random sample that was representative of the Spanish population that ensured 400 interviews in each autonomous community. Anthropometric data were collected by individual measurement following a well-designed protocol, and by the careful selection and calibration of the measuring devices and thorough training of the interviewers. Quality controls were applied throughout the process. Valid measurements were obtained in more than 94% of the sample.
Among the limitations, the cross-sectional design of the study does not allow us to establish causal associations with other factors. The presence of risk factors such as dyslipidemia, hypertension, and diabetes was based on self-reports, which may lead to response bias. The target sample size was reached, although some authors of other studies have reported difficulties in the selection and participation of persons at the extremes of the socioeconomic distribution. No information is available on persons who refused participation, and so it is not possible to assess selection bias.
A previous study that provided a mathematical model of adulthood obesity as an epidemic in Spain suggested that it would only be mitigated by the implementation of prevention strategies aimed at controlling the progression from normal weight to overweight to obesity.36
CONCLUSIONSIn the Spanish population, the prevalence of obesity and AO is high, the prevalence of AO is higher in men, both conditions increase with age, and both are inversely associated with socioeconomic level. Lifestyle profiles combining a higher level of physical activity, a moderately sedentary lifestyle, and a Mediterranean dietary pattern are associated with a lower risk of obesity, AO, and CVRFs. Early intervention strategies that promote better eating habits, increased physical activity, and reducing sedentariness are key to the prevention of these problems. The prescription of dietary advice and physical exercise is also essential in the treatment of affected individuals.
FUNDINGThe ENPE study (Estudio Nutricional de la Población Española) fieldwork was funded by the Eroski Foundation through an agreement with SPRIM-España and the Spanish Society of Community Nutrition (SENC). The sponsor was not involved in the study design, data collection, analysis, interpretation of the results, writing the manuscript, or the decision to publish the results.
CONFLICTS OF INTERESTNone declared.
- –
The prevalence of obesity in Spain is high, contributes to the onset of cardiovascular and other chronic diseases, and is associated with impaired quality of life and premature mortality. This relationship may be affected by the distribution of body fat.
- –
This study provides recent data on the prevalence of obesity and AO in the general Spanish population, in a nationwide sample, based on individual anthropometric measurements. We analyzed the influence of sociodemographic factors, lifestyle patterns and their association with CVRFs. The study provides estimates that are comparable with those of other studies conducted in Spain and other countries.
The authors are grateful for technical and logistic support from SIGMA DOS, technical support from SPRIM-España, the sponsorship of the Eroski Foundation and, in particular, the work of the professional fieldworkers and the generosity of the participants.