Although guidelines recommend the use of a cutoff value of 0.60 cm2/m2 for aortic valve area (AVA) normalized to body surface area (BSA) for severe aortic stenosis, there is little evidence of its prognostic value. Our aim was to test the value of AVA normalized to body size for outcome prediction in aortic stenosis.
MethodsOne-hundred and ninety patients with at least moderate aortic stenosis (AVA <1.50 cm2) were prospectively enrolled. AVA was normalized to BSA and height. The primary endpoint was cardiovascular death under medical management. A receiver operating characteristic curve was plotted to determine the best cutoff value for predicting cardiovascular death.
ResultsAn AVA/BSA cutoff value of 0.50 had a sensitivity of 96% and specificity of 51%. An AVA/height cutoff value of 0.49 showed a sensitivity of 96% and a specificity of 52%. During a mean follow-up of 247±190 days, there were 24 cardiovascular deaths, with higher cardiovascular mortality in patients with AVA/BSA <0.50 cm2/m2 (21% vs 2.5%, P <.001) and AVA/height <0.49 cm2/m (25% vs 12%, P <.001). Two-year survival was 95±5% in patients with AVA/BSA> 0.50 cm2/m2 and was 37±5% in patients with AVA/BSA <0.50 cm2/m2 (P <.001). Cardiovascular death risk was higher in patients with AVA/BSA <0.50 cm2/m2 (adjusted 10.9 [1.2-103.7], P=.037), but cardiovascular mortality was not significantly higher in multivariate analysis for patients with AVA/height <0.49 cm2/m (2.0 [0.6-6.0], P=.22).
ConclusionsWe could identify a subgroup of patients at high risk of cardiovascular death when they were medically treated. Consequently we recommend using an AVA/BSA cutoff value of 0.50 cm2/m2 to identify a subgroup of patients with higher cardiovascular risk.
Keywords
Aortic stenosis (AS) is the most common valvular heart disease in developed countries.1 Management decisions rely on accurate assessment of AS severity in conjunction with left ventricular function and the patient's symptoms.2,3 Echocardiography is the key tool for the diagnosis and evaluation of AS. The primary hemodynamic parameters recommended for clinical evaluation of AS severity are peak velocity, mean gradient, and aortic valve area (AVA) by continuity equation.4
Because all cardiovascular structures scale with body size, it could be reasonable to normalize AVA to body surface area (AVA/ body surface area [BSA]). However, the proposed cutoff for AVA/BSA was calculated by normalizing AVA to an average adult.5 Moreover, the 0.6cm2/m2 guideline-recommended cutoff is based on studies published in the 1960s and 1970s,6,7 and the outcome of AVA/BSA has not been completely studied.
Our aim was to test the value of AVA/BSA for outcome prediction in patients with AS, and to identify the best AVA/BSA cutoff for prediction of high risk of cardiovascular events during follow-up.
METHODSPatient populationBetween January 2015 and November 2017, we prospectively enrolled 190 patients diagnosed with moderate-severe native valvular AS (AVA <1.5cm2). The exclusion criteria were concomitant moderate or severe aortic regurgitation or mitral valve disease, subvalvular or supravalvular AS (defined as velocity higher than 1.5 m/s), thoracic aortic diameter less than 25mm, children <18 years of age, congenital heart disease (except bicuspid aortic valve), history of valve repair or implantation, suboptimal acoustic window, and loss of follow-up. The study protocol was approved by the Ethics Committee of the province of Cadiz. All the participants gave their consent to participate in the study.
Clinical dataClinical data included age, sex, hypertension, diabetes, history of smoking, hypercholesterolemia, body mass index, chronic renal failure, and coronary heart disease. Medical records were carefully screened for the presence of dyspnea, angina or syncope using the New York Heart Association functional classification. Patients manifesting angina, syncope, congestive heart failure or exercise dyspnea class ≥ 2 were classified as having symptoms attributable to AS. Blood pressure was measured at the time of the echocardiographic evaluation. BSA was calculated using the Dubois formula.8
Clinical decisions on medical management were made by the referring physician based on AS severity, left ventricular function, and symptomatic status, according to guidelines.2,3
Echocardiographic examinationTwo-dimensional transthoracic echocardiographic and Doppler studies were obtained with clinical ultrasound machines equipped with 2.5 to 3.5MHz transducers (iE33 Phillips Medical Systems, The Best, The Netherlands). All tests were conducted by an experienced sonographer. The parasternal long-axis view with zoom was used to measure the aortic annulus diameter in early systole. The time-velocity integral was obtained by using the pulsed Doppler in the left ventricular outflow tract and placing the sample volume 1cm below the aortic valve. Stroke volume was then calculated assuming a circular shape of the left ventricular outflow tract. Continuous wave Doppler recording of flow through the valve was performed from different windows to record maximal instantaneous and mean pressure gradients across the aortic valve.
AVA was calculated using the continuity equation. An indexed AVA was estimated as AVA/BSA. Because of the uncertain role of acquired fatty tissue on indexed AVA, we also calculated AVA/height. The mean transvalvular pressure gradient was obtained with the use of the modified Bernoulli equation. A Doppler velocity index, a simplification of the continuity equation, was calculated as time-velocity integral of left ventricular outflow tract/time-velocity integral of aortic jet.
The systolic time intervals of flow through the aortic valve were measured using the velocity curve from the continuous wave Doppler recording: ejection time, acceleration time, and acceleration time/ejection time ratio, as previously described.9
A dobutamine stress echocardiogram was performed when AVA calculated by the continuity equation was less than 1.0cm2, the aortic transvalvular mean gradient was less than 40mmHg, and the left ventricular ejection fraction was less than 40%. Severe AS was suggested by an AS jet> 4 m/s or a mean gradient> 40mmHg and an AVA that did not exceed 1.0cm2 on stress echocardiography.
All measurements represent an average of 3 cardiac cycles for patients in sinus rhythm and at least 6 cycles if the patient was in a different rhythm than sinus rhythm. Estimation of extrasystolic beat was always avoided. Echocardiographic study was performed following the AHA guidelines.10 Doppler recordings were performed at a sweep speed of 150mm/s.
OutcomesThe primary endpoint was cardiovascular death under medical management. In patients who underwent aortic valve implantation, we used the implantation date to compute the length of follow-up, but aortic valve implantation was not part of the primary endpoint. A combined endpoint (cardiovascular death and aortic valve replacement) and global mortality were defined as secondary endpoints.
Outcomes data were obtained from patient visits or records, telephone interviews, or death certificates when applicable.
Statistical analysisData are expressed as mean±standard deviation for continuous variables and were compared using the unpaired t test. Categorical variables are expressed as percentages and were compared using chi-square analysis or the Fisher exact test. The relationship between continuous variables and the 3 groups was explored using 1-way ANOVA tests. A receiver-operator characteristic curve was plotted to determine the best AVA/BSA and AVA/height cutoff values for predicting cardiovascular death in patients with AS. This cutoff was determined as the value providing a balance between sensitivity and specificity, but we preferred to use a higher sensitivity cutoff value because of the high mortality of this disease. The area under the receiver operating characteristic curve was calculated.
Event rates were estimated according to the Kaplan-Meier method and compared with 2-sided log-rank tests. Univariate and multivariable analyses of time to events were performed using Cox proportional hazard models. The variables entered into the models were those that have demonstrated prognostic impact in AS: age, left ventricular ejection fraction, mean gradient, peak aortic velocity, symptomatic status, AVA/BSA, and indexed left ventricular mass.
Differences were considered significant at P values <.05. For data analysis, the statistical program SPSS version 17.0 (SPSS Inc., Chicago, Illinois, United States) was used.
RESULTSOverall, we included 94 women (49%) and 96 men (51%), with a mean age of 74.1±13.0 years; diabetes prevalence was 48%, hypertension 74% and coronary artery disease 30%. Degenerative calcification was the most common cause of AS (91%), followed by bicuspid aortic valve (8%) and rheumatic disease (1%). There were 125 patients (66%) with AVA <1cm2, and 65 patients (34%) with AVA between 1.5 and 1.0cm2. Overall, aortic peak velocity was 3.91±0.75 m/s, mean gradient 39.2±15.7mmHg, AVA 0.92±0.32cm2, AVA/BSA 0.50±0.17cm2/m2, and AVA/height 0.57±0.20cm2/m.
There were 29 patients (15%) with left ventricular systolic dysfunction (left ventricular ejection fraction less than 50%): 4 patients with left ventricular ejection fraction between 40% and 50%, although with high gradients, and 25 patients less than 40%: 4 with high gradients, and 17 severe AS after dobutamine echocardiography.
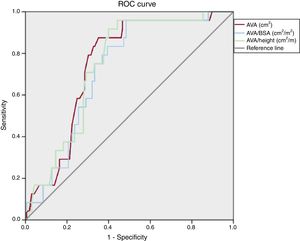
Receiver operating characteristic analysisReceiver operating characteristic analysis (figure 1) showed that both AVA/BSA and AVA/height could significantly predict cardiovascular death. The largest area under the curve was for AVA (area under the curve 0.75, P <.001), AVA/height (area under the curve 0.74, P <.001), and AVA/BSA (area under the curve 0.72, P <.001). Using a cutoff value of 0.50, AVA/BSA had a sensitivity of 96% and specificity of 51%, negative predictive value of 99% and positive predictive vale of 22%. The guideline-recommended cutoff value of 0.60cm2/m2 had a sensitivity of 97%, specificity of 25%, negative predictive value of 96%, and positive predictive value of 15%.

For AVA/height, a cutoff of 0.49, it showed a sensitivity of 96%, specificity of 52%, negative predictive value of 95% and positive predictive value of 25%. A cutoff value of 1.0cm2 for AVA showed a sensitivity of 96%, specificity of 38%, negative predictive value of 98%, and positive predictive value of 18%.
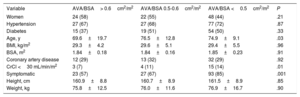
Normalized aortic valve area parametersWe divided the patients into 3 groups according to calculated (0.50cm2/m2) and guideline-recommended (0.60cm2/m2) cutoff values for AVA/BSA. Among the 190 patients included, 41 (22%) patients had AVA/BSA> 0.60cm2/m2, 40 patients (21%) between 0.50 and 0.60cm2/m2, and 109 patients (57%) had AVA/BSA less than 0.50cm2/m2. The baseline characteristics of patients are compared in table 1. Patients with AVA/BSA <0.50 showed more severe echocardiographic parameters (table 2).
Baseline characteristics according to AVA/BSA
| Variable | AVA/BSA> 0.6cm2/m2 | AVA/BSA 0.5-0.6cm2/m2 | AVA/BSA <0.5cm2/m2 | P |
|---|---|---|---|---|
| Women | 24 (58) | 22 (55) | 48 (44) | .21 |
| Hypertension | 27 (67) | 27 (68) | 77 (72) | .87 |
| Diabetes | 15 (37) | 19 (51) | 54 (50) | .33 |
| Age, y | 69.6±19.7 | 76.5±12.8 | 74.9±9.1 | .03 |
| BMI, kg/m2 | 29.3±4.2 | 29.6±5.1 | 29.4±5.5 | .96 |
| BSA, m2 | 1.84±0.18 | 1.84±0.16 | 1.85±0.23 | .91 |
| Coronary artery disease | 12 (29) | 13 (32) | 32 (29) | .92 |
| CrCl <30 mL/min/m2 | 3 (7) | 4 (11) | 15 (14) | .01 |
| Symptomatic | 23 (57) | 27 (67) | 93 (85) | .001 |
| Height, cm | 160.9±8.8 | 160.7±8.9 | 161.5±8.9 | .85 |
| Weight, kg | 75.8±12.5 | 76.0±11.6 | 76.9±16.7 | .90 |
AVA, aortic valve area; BMI, body mass index; BSA, body surface area, CrCl, creatinine clearance.
The data are presented as mean±standard deviation or No. (%).
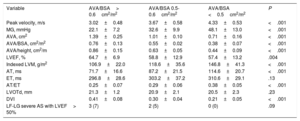
Baseline echocardiographic characteristics according to AVA/BSA
| Variable | AVA/BSA> 0.6cm2/m2 | AVA/BSA 0.5-0.6cm2/m2 | AVA/BSA <0.5cm2/m2 | P |
|---|---|---|---|---|
| Peak velocity, m/s | 3.02±0.48 | 3.67±0.58 | 4.33±0.53 | <.001 |
| MG, mmHg | 22.1±7.2 | 32.6±9.9 | 48.1±13.0 | <.001 |
| AVA, cm2 | 1.39±0.25 | 1.01±0.10 | 0.71±0.16 | <.001 |
| AVA/BSA, cm2/m2 | 0.76±0.13 | 0.55±0.02 | 0.38±0.07 | <.001 |
| AVA/height, cm2/m | 0.86±0.15 | 0.63±0.05 | 0.44±0.09 | <.001 |
| LVEF, % | 64.7±6.9 | 58.8±12.9 | 57.4±13.2 | .004 |
| Indexed LVM, g/m2 | 106.9±22.0 | 118.6±35.6 | 146.8±41.3 | <.001 |
| AT, ms | 71.7±16.6 | 87.2±21.5 | 114.6±20.7 | <.001 |
| ET, ms | 296.8±28.6 | 303.2±37.2 | 310.6±29.1 | .13 |
| AT/ET | 0.25±0.07 | 0.29±0.06 | 0.38±0.05 | <.001 |
| LVOTd, mm | 21.3±1.2 | 20.9±2.1 | 20.5±2.3 | .23 |
| DVI | 0.41±0.08 | 0.30±0.04 | 0.21±0.05 | <.001 |
| LF-LG severe AS with LVEF> 50% | 3 (7) | 2 (5) | 0 (0) | .09 |
AS, aortic stenosis; AT, acceleration time; AVA, aortic valve area; BSA, body surface area; DVI, Doppler velocity index; ET, ejection time; LF-LG, low flow-low gradient; LVEF, left ventricular ejection fraction; LVM, left ventricular mass; LVOTd, left ventricular outflow tract diameter; MG, mean gradient.
The data are presented as mean±standard deviation or No. (%).
According to AVA/height, we divided the patients into 3 groups: 73 patients (38%) with AVA/height> 0.6cm2/m, 44 patients (22%) with AVA/height between 0.49 and 0.6cm2/m, and 73 patients (38%) AVA/height <0.49cm2/m. The clinical and echocardiographic characteristics of the patients according to AVA/height are shown in table 3 and table 4.
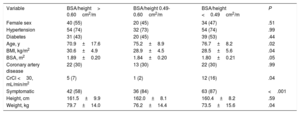
Baseline characteristics according to AVA/height
| Variable | BSA/height> 0.60cm2/m | BSA/height 0.49-0.60cm2/m | BSA/height <0.49cm2/m | P |
|---|---|---|---|---|
| Female sex | 40 (55) | 20 (45) | 34 (47) | .51 |
| Hypertension | 54 (74) | 32 (73) | 54 (74) | .99 |
| Diabetes | 31 (43) | 20 (45) | 39 (53) | .44 |
| Age, y | 70.9±17.6 | 75.2±8.9 | 76.7±8.2 | .02 |
| BMI, kg/m2 | 30.6±4.9 | 28.9±4.5 | 28.5±5.6 | .04 |
| BSA, m2 | 1.89±0.20 | 1.84±0.20 | 1.80±0.21 | .05 |
| Coronary artery disease | 22 (30) | 13 (30) | 22 (30) | .99 |
| CrCl <30, mL/min/m2 | 5 (7) | 1 (2) | 12 (16) | .04 |
| Symptomatic | 42 (58) | 36 (84) | 63 (87) | <.001 |
| Height, cm | 161.5±9.9 | 162.0±8.1 | 160.4±8.2 | .59 |
| Weight, kg | 79.7±14.0 | 76.2±14.4 | 73.5±15.6 | .04 |
AVA, aortic valve area; BMI, body mass index; BSA, body surface area, CrCl, creatinine clearance.
The data are presented as mean±standard deviation or No. (%).
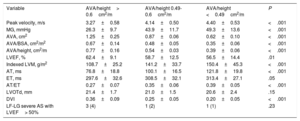
Baseline echocardiographic characteristics according to AVA/height
| Variable | AVA/height> 0.6cm2/m | AVA/height 0.49-0.6cm2/m | AVA/height <0.49cm2/m | P |
|---|---|---|---|---|
| Peak velocity, m/s | 3.27±0.58 | 4.14±0.50 | 4.40±0.53 | <.001 |
| MG, mmHg | 26.3±9.7 | 43.9±11.7 | 49.3±13.6 | <.001 |
| AVA, cm2 | 1.25±0.25 | 0.87±0.06 | 0.62±0.10 | <.001 |
| AVA/BSA, cm2/m2 | 0.67±0.14 | 0.48±0.05 | 0.35±0.06 | <.001 |
| AVA/height, cm2/m | 0.77±0.16 | 0.54±0.03 | 0.39±0.06 | <.001 |
| LVEF, % | 62.4±9.1 | 58.7±12.5 | 56.5±14.4 | .01 |
| Indexed LVM, g/m2 | 108.7±25.2 | 141.2±33.7 | 150.4±45.3 | <.001 |
| AT, ms | 76.8±18.8 | 100.1±16.5 | 121.8±19.8 | <.001 |
| ET, ms | 297.6±32.6 | 308.5±32.1 | 313.4±27.1 | .05 |
| AT/ET | 0.27±0.07 | 0.35±0.06 | 0.39±0.05 | <.001 |
| LVOTd, mm | 21.4±1.7 | 21.0±1.5 | 20.6±2.4 | .15 |
| DVI | 0.36±0.09 | 0.25±0.05 | 0.20±0.05 | <.001 |
| LF-LG severe AS with LVEF> 50% | 3 (4) | 1 (2) | 1 (1) | .23 |
AS, aortic stenosis; AT, acceleration time; AVA, aortic valve area; BSA, body surface area; DVI, Doppler velocity index; ET, ejection time; DVI, Doppler velocity index; LF-LG, low flow-low gradient; LVEF, left ventricular ejection fraction; LVM, left ventricular mass; LVOTd, left ventricular outflow tract diameter; MG, mean gradient.
The data are presented as mean±standard deviation or No. (%).
Complete follow-up was achieved in 100% of the patients. Mean follow-up was 247±190 days, without significant differences according to the AVA/BSA group (226±150 vs 245±262 vs 256±172 days, P=.70) and AVA/height group (235±220 vs 220±134 vs 275±184 days, P=.26).
There were 36 deaths during the follow-up, of which 24 were from cardiovascular causes. Aortic valve replacement was performed in 51 patients (27%). The combined endpoint was reached by 75 patients (39%).
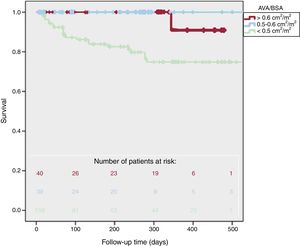
Survival according to AVA/BSA is presented in figure 2. Cardiovascular mortality was higher in patients with lower AVA/BSA (2.5% vs 0% vs 21%, P <.001). There were more cardiovascular combined events in AVA/BSA <0.50 (10% vs 12% vs 61%, P <.001) but global mortality did not reach statistical differences (7% vs 17% vs 24%, P=.07). One-year survival was 91±5% for AVA/BSA> 0.60cm2/m2, 100±0% for AVA/BSA between 0.50 and 0.60cm2/m2, and 75±5% for AVA/BSA <0.50cm2/m2 (log-rank P=.001). Moreover, 2-year survival was 95±5% in patients with AVA/BSA> 0.50cm2/m2 and 37±5% in patients with AVA/BSA ≤ 0.50cm2/m2P <.001).

We did not find different survival rates in patients with AVA/BSA> 0.6cm2/m2 and AVA/BSA between 0.5 and 0.6cm2/m2 (P=.39).
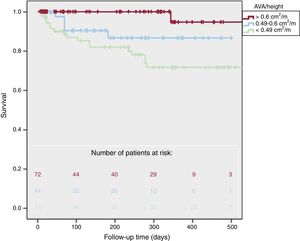
Regarding AVA/height, there were more cardiovascular deaths in patients with lower AVA/height (1% vs 11% vs 25%, P <.001), more cardiovascular events (7% vs 57% vs 62%, P <.001) and global mortality (14% vs 11% vs 29%, P=.02). One-year survival (figure 3) was 95±5% for AVA/height> 0.6cm2/m, 87±5% in patients with AVA/height between 0.6 and 0.49cm2/m, and 72±5% for AVA/height <0.49cm2/m (log-rank P=.001). Two-year survival was 91±4% in patients with AVA/height ≥ 0.49cm2/m and was 36±4% in AVA/height <0.49cm2/m (P=.001).

We also found significantly different survival rates after excluding patients with left ventricular dysfunction: 1-year survival was 81±4% in patients with AVA/BSA ≤ 0.50cm2/m2 and 94±5% in AVA/BSA> 0.5cm2/m2 (P=.003). One-year survival was also higher in AVA/height ≥ 0.49cm2/m than in <0.49cm2/m (92±4% vs 78±6%, P=.006) after exclusion of patients with left ventricular systolic dysfunction.
There were only 41 asymptomatic patients with left ventricular ejection fraction ≥ 50%, of which 1 patient had cardiovascular death (AVA/BSA <0.5cm2/m2).
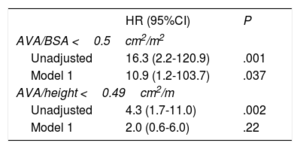
Multivariate analysisThe excess risk of cardiovascular mortality in univariate analysis for AVA/BSA <0.5cm2/m2 (HR, 16.3; 95% confidence interval [95%CI], (2.2-120.9), P=.001) was also observed after adjustment by age, sex, left ventricular ejection fraction, symptomatic status, aortic peak velocity, and indexed left ventricular mass (HR, 10.9; 95%CI, (1.2-103.7]), P=.037) (table 5). However, a higher cardiovascular mortality in univariate analysis for patients with AVA/height <0.49cm2/m (HR, 4.3; 95%CI, (1.7-11.0), P=.002) was not significant in multivariate analysis (HR, 2.0; 95%CI, (0.6-6.0), P=.22).
Relative risk of cardiovascular mortality during follow-up associated with AVA/BSA and AVA/height
| HR (95%CI) | P | |
|---|---|---|
| AVA/BSA <0.5cm2/m2 | ||
| Unadjusted | 16.3 (2.2-120.9) | .001 |
| Model 1 | 10.9 (1.2-103.7) | .037 |
| AVA/height <0.49cm2/m | ||
| Unadjusted | 4.3 (1.7-11.0) | .002 |
| Model 1 | 2.0 (0.6-6.0) | .22 |
95%CI, 95% confidence interval; AVA, aortic valve area; BSA, body surface area; HR, hazard ratio.
The data are presented as median (interquartile range).
Model 1 is adjusted for age, sex, left ventricular ejection fraction, symptomatic status, aortic peak velocity and indexed left ventricular mass.
Severe AS has a worse prognosis than moderate AS,3 so reliable assessment of severity is of vital importance. Since there is no ideal measure of AS severity because of the lack of a reference standard in this heart valve disease, we preferred to use clinical outcome, because it is recognized as the only endpoint available for defining severity.11 In addition, since patients with AS have high comorbidity, symptoms could appear even in milder stages of this disease.
Several parameters have demonstrated their prognostic value in AS: peak velocity,12–14 AVA,15,16 and therefore peak velocity> 4.0 m/s and aortic valve area <1cm2 have been appropriately adopted as severity cutoffs.
It could be reasonable to normalize AVA to body size in order to increase the diagnostic performance of AVA. However, although guidelines recommend a cutoff value of 0.6cm2/m2 for AVA/BSA,2–4 there are no morbidity and mortality studies in the western population that support that cutoff. Indeed, only the study by Saito et al.17 was able to demonstrate higher cardiovascular events in Japanese people with AVA/BSA <0.6cm2/m2, although these patients had a particularly low BSA.
In the SEAS study,18 discrepancies between AVA and mean gradient increased rather than decreased after indexation of AVA to BSA using the cutoff value of 0.6cm2/m2. It has been suggested that a lower AVA/BSA might improve diagnostic accuracy and predict cardiovascular events.19
Our main finding is that, to our knowledge, this is the first prospective study to show higher cardiovascular mortality in patients with AVA/BSA <0.5cm2/m2 under medical treatment, with a higher prognostic capacity than AVA <1cm2. This strong impact on mortality persisted even after adjustment for other variables with prognostic value, so it is possible that this subgroup of patients could benefit from early intervention despite the absence of symptoms, although this issue should be determined in future studies. Although other authors have studied the prognosis of AVA/BSA by a combined endpoint of cardiovascular death or aortic valve replacement,17,20 we preferred to use cardiovascular mortality since it reflects the natural history of the disease.
Tribouilloy et al.20 also showed that a lower cutoff value for AVA/BSA was predictive of cardiovascular outcomes, unlike Saito et al.,17 probably because of the low BSA in their sample. We chose 0.5cm2/m2 as a cutoff value for AVA/BSA because of its high sensitivity for predicting cardiovascular death in ROC analysis.
The use of normalization for BSA has been previously criticized in patients with obesity where it corrects not only by body size but also for the acquired fatty tissue. This is the reason why we assessed AVA/height in patients with AS, showing a similar predictive accuracy as AVA/BSA. However, we were not able to demonstrate independent prognostic value for AVA/height <0.49cm2/m.
The main limitation of our study is, in our view, the small sample size, which could make it difficult to obtain statistically significant differences in some subgroups. Indeed, like other studies,21 we were not able to increase the predictive accuracy compared with AVA. It would be interesting to assess whether the prognostic accuracy could differ based on body size,22 so we could predict when normalization must be used. It is probable that increasing the sample size could help us to answer this question. The continuity equation assumes a circular morphology of the left ventricular outflow tract, whereas several authors have demonstrated its elliptical shape, with underestimation of AVA.23,24 Aortic valve calcium score25 was not assessed systematically in our patients, and therefore was not available for outcome analysis. It would have been interesting to analyze cardiovascular events in asymptomatic patients, but we did not have an adequate sample size to obtain significant results. Finally, although alternative formulae for the assessment of BSA exist, calculation by the Dubois formula8 did not change the results significantly.26
CONCLUSIONSThe present study shows that normalization of AVA for BSA is useful for risk stratification, since we could identify a subgroup of patients at high risk of cardiovascular death when they were medically treated. Indeed, patients with AVA/BSA less than 0.50cm2/m2 had significantly higher cardiovascular mortality, and therefore we propose this cutoff value to identify a subgroup of patients with higher cardiovascular risk.
CONFLICTS OF INTERESTNone declared.
- -
Guidelines recommend using A cutoff value of 0.6cm2/m2 for indexed AVA in aortic stenosis, although there are no studies that show its prognostic value.
- -
Patients with indexed AVA <0.50cm2/m2 had higher cardiovascular mortality, showing a more severe stage of valvular disease.
- -
Two-year survival was 95±5% in patients with AVA/BSA> 0.50cm2/m2 vs 37±5% in those with AVA/BSA ≤ 0.50cm2/m2.