
The clinical value of electrocardiogram (ECG) repolarization parameters associated with ventricular arrhythmias (VAs) in tako-tsubo syndrome is still under debate. We aimed to evaluate ECG predictors of subacute VAs, defined as those occurring after the first 48hours from admission.
MethodsThis single-center observational study enrolled patients admitted to the cardiology department between 2012 and 2018 with a confirmed diagnosis of tako-tsubo syndrome. Data collection included a 12-lead ECG on admission and at 48hours, continuous telemetry monitoring, blood testing, transthoracic echocardiography, and coronary angiography during hospitalization. VAs events were defined as: premature ventricular contractions ≥ 2000 within a 24-hour window of telemetry monitoring, ventricular fibrillation, sustained ventricular tachycardia (VT), polymorphic VT, and non-sustained VT.
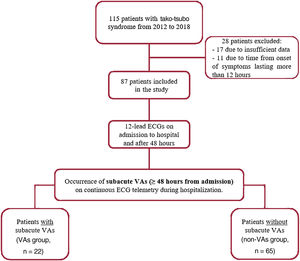
ResultsA total of 87 patients (age 72±12 years) were enrolled. During a median of 8 days of hospitalization, subacute VAs were documented in 22 patients (25%) after a median of 91hours from admission. Subacute VAs were associated with an increase in mortality during hospitalization (P=.030). The corrected global (mean of the 12-lead ECG values) Tpeak-Tend interval at 48hours from admission was an independent predictor of subacute VAs and was statistically superior to the standard corrected QT interval (Z test, P=.040). A cut-off of 108 msec for the corrected global Tpeak-Tend yielded a 71% sensitivity and 72% specificity for subacute VAs.
ConclusionsIn patients with tako-tsubo syndrome, subacute VAs are associated with repolarization alterations that can be identified on conventional ECG using the Tpeak-Tend interval.
Keywords
Tako-tsubo syndrome was initially reported as a benign condition, later showing a worse prognosis than expected and, more importantly, comparable to that of acute coronary syndromes both in the short- and long-term.1 The estimated in-hospital mortality rate ranges from 1% to 8% and is significantly higher for patients with arrhythmic complications than for those without.2 In particular, ventricular arrhythmias (VAs) constitute an important cause of morbidity and mortality in this population. Moreover, the prognostic impact of VAs is not just related to ventricular fibrillation (VF), polymorphic ventricular tachycardia (VT) and sustained monomorphic VT, but also includes non-sustained forms of arrhythmia.3,4
VAs in this syndrome are probably related to different mechanisms, depending on the clinical phase. Thus, in the first hours after admission, it has been suggested that acute catecholamines toxicity and/or myocardial ischemia might play a causative role, while in the subacute phase (48hours after hospital admission) these arrhythmias are mainly related to repolarization abnormalities.5 Based on these premises, we have come to consider tako-tsubo syndrome as a new variant of acquired long QT syndrome6,7; however, the use of the corrected QT interval (QTc) and its dispersion for risk stratification of VAs has shown inconclusive results.6–12
To overcome potential limitations related to the QT interval, which represents depolarization and repolarization global times, we propose that the Tpeak-Tend interval, measured from the peak to the end of the T-wave, might offer a widely available alternative to identify repolarization alterations associated with VAs in tako-tsubo syndrome. This premise is based on the fact that the Tpeak-Tend interval correlates with the steepness of the repolarization gradients, taking into account both the transmural and the apicobasal axes.13,14 It has also been shown that the Tpeak-Tend interval could be an appropriate risk marker for VAs events in the context of cardiac channelopathies and acute coronary syndromes.15
Here, we investigated the potential prognostic value of the Tpeak-Tend interval for risk stratification of subacute VAs, defined as those occurring after the first 48hours after hospital admission in patients with tako-tsubo syndrome.
METHODSStudy populationWe conducted a single-center retrospective study enrolling consecutive patients admitted to the Cardiovascular Department of Fondazione Policlinico Universitario “Agostino Gemelli” IRCCS between 2012 and 2018 with a diagnosis of tako-tsubo syndrome according to international tako-tsubo diagnostic criteria.1 The exclusion criteria included: patients with prior myocardial infarction, a symptom-onset-to-admission time greater than 12hours, the pre-existence of structural cardiomyopathy (such as hypertrophic, dilated, arrhythmogenic, noncompaction) or any clinically relevant heart valve disease, patients with an implanted pacemaker, patients chronically treated with drugs affecting the QT interval, or any type of congenital long QT syndrome or other cardiac channelopathies.
Based on the occurrence of subacute VAs on continuous electrocardiogram (ECG) telemetry during hospitalization, our population was classified as follows: a) VAs group, and b) non-VAs group. VAs events included any of the following: VF, polymorphic VT, sustained monomorphic VT (life-threatening VAs), non-sustained VT, and premature ventricular contractions ≥ 2000 within a 24-hour window of telemetry monitoring (non-life-threatening VAs), as defined elsewhere.16 Subacute VAs were distinguished from those recorded during the first 48hours from admission (ie, acute VAs).
For each patient, medical records were reviewed to collect clinical characteristics, medications, blood testing data, ECG data, and echocardiography parameters on admission. Blood testing and ECG findings were also obtained 48hours after admission, in the subacute phase. Coronary angiography and ventriculography data were also obtained. The study flow chart is shown in figure 1.

The study protocol was approved by the institutional review board and ethics committee of the Fondazione Policlinico Universitario “Agostino Gemelli” IRCCS. The study complies with the ethical guidelines of the Declaration of Helsinki. All patients gave written informed consent.
Analysis of the standard electrocardiogram and continuous cardiac rhythm monitoring dataA standard resting 12-lead ECG (25mm/s, 1 mV/10 mm) was recorded in all patients on admission and 48hours thereafter using an EL 280 Resting Electrocardiograph (Welch Allyn, USA). ECG traces were used to assess cardiac rhythm, atrioventricular and intraventricular conductions, any ST-segment deviation, and ventricular repolarization. Two blinded cardiologists manually annotated all 12-lead ECG measurements. The intraclass correlation coefficient was calculated for each parameter. ECG data were averaged using 5 consecutive beats during sinus rhythm, or 10 consecutive beats during atrial fibrillation.
ST-segment elevation was defined as an upward shift ≥ 0.1mV (except in V2–V3 where a ≥ 0.15mV was considered) from the J point in ≥ 2 contiguous leads. ST-segment depression was defined as a downward shift from the J point in ≥ 2 contiguous leads of at least−0.05mV in leads V2 and V3 and−0.1mV in all other leads. T-wave inversion was defined as a T-wave amplitude less than−0.1mV. If the J point was not easily identifiable, the subsequent isoelectric line between the T-wave and P-wave was conventionally used as a reference marker.17 Persistent ST-elevation was defined as ST-segment elevation at 48hours on ECG with ≤ 50% resolution from the reference ECG on admission.
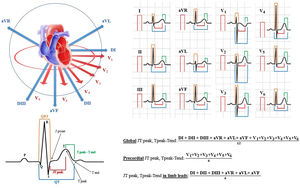
QT intervals were assessed in each of the 12 leads, measured from the beginning of the QRS complex to the end of the T-wave at the isoelectric line for each patient.17 T-waves smaller than 1mm in amplitude were not measured due to intrinsic uncertainty. The QT dispersion for each standard ECG recording was also computed as the difference between the longest and shortest QT interval.17 Furthermore, the JT peak intervals were measured in all the 12 leads from the end of the QRS complex to the peak of the T-wave (if the T-wave was positive) or to the nadir of the T-wave (if the T-wave was negative or biphasic). The Tpeak-Tend interval was measured from the peak of the T-wave to the end of the T-wave. For both the JT and Tpeak-Tend intervals, we considered the mean value of the 12 leads (global), the precordial leads only (precordial) and the peripheral leads only (limb leads) (figure 2). The JT peak and the Tpeak-Tend dispersion were defined as the difference between the longest and shortest measured interval, as appropriate.18 All the repolarization intervals were corrected for heart rate using Bazett's formula, as reported elsewhere.18
, with a schematic representation of repolarization intervals (on the bottom left) and their measurements in the 12 leads, with a description of what constitutes a “global”, “precordial” and “in limb leads” value.")
Electrocardiographic repolarization indices measurements. The 12 leads of the ECG are shown in sagittal and coronal plane (on the top left), with a schematic representation of repolarization intervals (on the bottom left) and their measurements in the 12 leads, with a description of what constitutes a “global”, “precordial” and “in limb leads” value.
Continuous 3-lead (aVF, V3, V5) ECG telemetry monitoring was recorded during the hospitalization period, starting after the diagnosis of the tako-tsubo syndrome and further maintained until hospital discharge. These data were used to identify and quantify VAs events.
Coronary angiography and left ventriculographyCoronary angiography was performed in all patients to exclude the presence of any relevant coronary artery disease. Left ventriculography was also performed to characterize the Tako-tsubo variants, as reported elsewhere.1
Transthoracic echocardiographyAfter coronary angiography, all patients underwent a transthoracic echocardiography study with a Toshiba Artida system equipped with a 3.5MHz phased array transducer. The echocardiography exam included: quantification of left ventricular volume and left ventricular ejection fraction (LVEF); assessment of wall motion; assessment of mitral diastolic function; assessment of any valvular defect; assessment of the pericardial space; and estimation of the systolic pulmonary artery pressure, all done following current recommendations.19
Statistical analysisAll data were analyzed for normality of distribution using the Kolmogorov-Smirnov test. Continuous variables are expressed as mean±standard deviation or median [interquartile range], as appropriate, and categorical variables are expressed as percentages. A parametric (T-test) or non-parametric test (Mann-Whitney U test, chi-square test) was used to assess the statistical significance of group comparisons, as appropriate. Correlation analyses were performed using the Pearson correlation coefficient method.
A multivariate binary logistic analysis was used to identify independent predictors of subacute VAs and mortality during hospitalization. Only statistically significant objective variables after univariate analysis were included in the multivariate model. Effect modification by each covariate was evaluated by testing whether including the interaction term in the multivariate logistic model significantly changed the log likelihood of the model applying stepwise logistic regression. The coefficients obtained from the logistic regression were expressed in terms of odds ratio with 95% confidence intervals.
Receiver operating characteristic curves were used to assess the sensitivity, specificity, and cut-off values of different electrocardiographic parameters for the prediction of subacute VAs. The optimal cut-off value was defined as the value yielding the maximal Youden index (max [sensitivity+specificity−1]) or the best combined sensitivity and specificity.20 Comparisons of the area under the curve with the Z test were performed using MedCalc Statistical Software v 17.2 (MedCalc Software, Belgium).
All tests were 2-sided and statistical significance was set at P<.05. The statistical analysis was performed by using the SPSS software v23.0 (IBM Corp, USA).
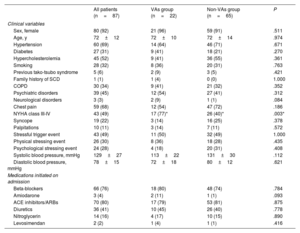
RESULTSDescriptive findings in the overall populationThe study population included 87 patients with confirmed tako-tsubo syndrome (age 72±12 years old, 92% females). Baseline clinical data and laboratory findings are reported in table 1 and , respectively. The average LVEF was 46±10% on admission, with an LVEF value ≤ 45% in 35 patients (40%). During the acute phase, cardiac arrhythmias occurred in 25 patients (29%): supraventricular arrhythmias (atrial fibrillation, atrial flutter, or supraventricular tachycardia) were detected in 11 patients (13%), while VA events occurred in 14 patients (16%) (1 polymorphic VT, 1 sustained monomorphic VT, 12 patients with premature ventricular contractions ≥ 2000 in 24hours).
Characteristics of the overall study population and comparison between VAs and non-VAs groups on admission
| All patients (n=87) | VAs group (n=22) | Non-VAs group (n=65) | P | |
|---|---|---|---|---|
| Clinical variables | ||||
| Sex, female | 80 (92) | 21 (96) | 59 (91) | .511 |
| Age, y | 72±12 | 72±10 | 72±14 | .974 |
| Hypertension | 60 (69) | 14 (64) | 46 (71) | .671 |
| Diabetes | 27 (31) | 9 (41) | 18 (21) | .270 |
| Hypercholesterolemia | 45 (52) | 9 (41) | 36 (55) | .361 |
| Smoking | 28 (32) | 8 (36) | 20 (31) | .763 |
| Previous tako-tsubo syndrome | 5 (6) | 2 (9) | 3 (5) | .421 |
| Family history of SCD | 1 (1) | 1 (4) | 0 (0) | 1.000 |
| COPD | 30 (34) | 9 (41) | 21 (32) | .352 |
| Psychiatric disorders | 39 (45) | 12 (54) | 27 (41) | .312 |
| Neurological disorders | 3 (3) | 2 (9) | 1 (1) | .084 |
| Chest pain | 59 (68) | 12 (54) | 47 (72) | .186 |
| NYHA class III-IV | 43 (49) | 17 (77)* | 26 (40)* | .003* |
| Syncope | 19 (22) | 3 (14) | 16 (25) | .378 |
| Palpitations | 10 (11) | 3 (14) | 7 (11) | .572 |
| Stressful trigger event | 43 (49) | 11 (50) | 32 (49) | 1.000 |
| Physical stressing event | 26 (30) | 8 (36) | 18 (28) | .435 |
| Psychological stressing event | 24 (28) | 4 (18) | 20 (31) | .408 |
| Systolic blood pressure, mmHg | 129±27 | 113±22 | 131±30 | .112 |
| Diastolic blood pressure, mmHg | 78±15 | 72±18 | 80±12 | .621 |
| Medications initiated on admission | ||||
| Beta-blockers | 66 (76) | 18 (80) | 48 (74) | .784 |
| Amiodarone | 3 (4) | 2 (11) | 1 (1) | .093 |
| ACE inhibitors/ARBs | 70 (80) | 17 (79) | 53 (81) | .875 |
| Diuretics | 36 (41) | 10 (45) | 26 (40) | .778 |
| Nitroglycerin | 14 (16) | 4 (17) | 10 (15) | .890 |
| Levosimendan | 2 (2) | 1 (4) | 1 (1) | .416 |
ACE, angiotensin-converting-enzyme; ARB, angiotensin-receptor blocker; COPD, chronic obstructive pulmonary disease; NYHA, New York Heart Association; SCD, sudden cardiac death; VAs, ventricular arrhythmias.
Data are expressed as No. (%) or mean±standard deviation.
During a median of 8 [5-14] days of hospitalization, subacute VAs (≥ 48hours from admission) were documented in 22 patients (25%) after a median of 91 [75-149] hours from admission. Life-threatening VAs occurred in 5 patients (6%) (1 VF, 1 polymorphic VT, and 3 sustained monomorphic VT) and non-life-threatening VAs were present in 17 patients (19%) (6 non-sustained VT and 11 patients with premature ventricular contractions ≥ 2000 in 24hours).
In the overall population, heart rate on admission was 88±21 bpm and significantly decreased at 48hours to 75±18 bpm (P=.001). The QTc interval was 450±48 msec, the corrected global JT peak interval was 232±40 msec, and both significantly increased at 48hours (470±38 msec, P=.040 and 251±38 msec, P=.001, respectively). The corrected global Tpeak-Tend did not significantly change between the ECG on admission and at 48hours (107±26 msec vs 103±26 msec, P=.863). All electrocardiographic measurements on admission and after 48hours are reported in . The intraclass correlation coefficient was superior to 0.90 for each parameter, with a mean of 1±2 ECG leads per patient not available for the analyses due to intrinsic uncertainty. Further coronary angiography and echocardiography data are also summarized in .
In-hospital mortality occurred in 6 patients: 3 related to septic shock, 1 associated with refractory VF, 1 due to cardiogenic shock, and 1 after cardiac free wall rupture (). On admission, none of ECG parameters were statistically different between patients who died and those who survived during hospitalization. However, at 48hours from admission, heart rate was significantly higher in the former than in the latter (94±16 vs 72±18 bpm, respectively, P=.004, figure 1A of the supplementary data), with moderate correlation with LVEF (34%±11% in non-survivors vs 47%±10% in survivors, P=.006; r-0.373, P=.004, figure 1B,C of the supplementary data). No other ECG parameters showed significant differences between the 2 groups. Data on clinical complications during hospitalization are summarized in .
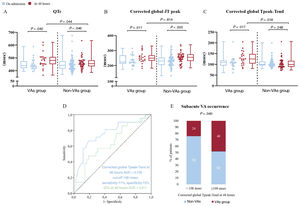
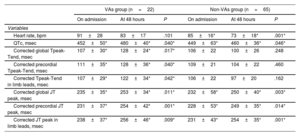
Comparisons between ventricular arrhythmias and non-ventricular arrhythmia groupsECG parameters on admission did not differ between the VAs and non-VAs groups. However, at 48hours both the QTc and corrected Tpeak-Tend interval (on global, precordial and limbs leads) showed significantly higher values in the VAs group than in the non-VAs group (all comparisons showed P<.05, figure 3A,C and). Moreover, comparisons between ECG intervals on admission and at 48hours showed that, although QTc and corrected JT peak values increased in both groups, the corrected Tpeak-Tend intervals (on global, precordial and limb leads) were only prolonged in the VAs group (all comparisons showed P<.05, figure 3 and table 2). Heart rate values significantly decreased in the non-VAs group between admission and 48 hour ECG (85±16 bpm vs 73±18 bpm, P=.001). Conversely, this decrease in heart rate was not statistically significant in the VAs group (91±28 bpm vs 83±17 bpm, P=.101). The VAs and non-VAs groups showed no differences in persistent ST-segment elevation at 48hours (7 patients [32%] and 17 [26%], respectively, P=.801). All electrocardiographic measurements and comparisons between the admission and 48-hour ECG in the VAs and non-Vas groups are reported in table 2, .
 and at 48hours (in red) in the VAs and non-VAs group and comparison between the 2 values at 48hours. B: same comparisons as in A using the corrected global JT peak interval. C: same comparisons as in A and B using the corrected global Tpeak-Tend interval. D: receiver operating characteristic curves of QTc and corrected global Tpeak-Tend at 48hours. E: distribution of subacute VAs according to the cut-off point of 108 msec for corrected global Tpeak-Tend at 48hours. AUC, area under the curve; QTc, corrected QT interval; VAs, ventricular arrhythmias.")
Differences of electrocardiographic repolarization parameters between the VAs group and non-VAs group. A: comparison between QTc on admission (in blue) and at 48hours (in red) in the VAs and non-VAs group and comparison between the 2 values at 48hours. B: same comparisons as in A using the corrected global JT peak interval. C: same comparisons as in A and B using the corrected global Tpeak-Tend interval. D: receiver operating characteristic curves of QTc and corrected global Tpeak-Tend at 48hours. E: distribution of subacute VAs according to the cut-off point of 108 msec for corrected global Tpeak-Tend at 48hours. AUC, area under the curve; QTc, corrected QT interval; VAs, ventricular arrhythmias.
Comparison of ECG parameters between admission and at 48hours between the VAs group and non-VAs group
| VAs group (n=22) | Non-VAs group (n=65) | |||||
|---|---|---|---|---|---|---|
| On admission | At 48 hours | P | On admission | At 48 hours | P | |
| Variables | ||||||
| Heart rate, bpm | 91±28 | 83±17 | .101 | 85±16* | 73±18* | .001* |
| QTc, msec | 452±50* | 480±40* | .040* | 449±63* | 460±36* | .046* |
| Corrected global Tpeak-Tend, msec | 107±30* | 128±24* | .017* | 106±22 | 100±26 | .248 |
| Corrected precordial Tpeak-Tend, msec | 111±35* | 128±36* | .040* | 109±21 | 104±22 | .460 |
| Corrected Tpeak-Tend in limb leads, msec | 107±29* | 122±34* | .042* | 106±22 | 97±20 | .162 |
| Corrected global JT peak, msec | 235±35* | 253±34* | .011* | 232±58* | 250±40* | .003* |
| Corrected precordial JT peak, msec | 231±37* | 254±42* | .001* | 228±53* | 249±35* | .014* |
| Corrected JT peak in limb leads, msec | 238±37* | 256±46* | .009* | 231±43* | 254±35* | .001* |
QTc, corrected QT interval; VAs, ventricular arrhythmias.
Data are expressed as mean±standard deviation.
Among clinical variables, acute VAs were significantly more frequent in the VAs than in the non-VAs group (11 patients [50%] vs 3 [5%]; P=.001), both considering life-threatening and non-life-threatening acute VAs (2 patients [9%] vs 0 [0%]; P=.040 and 9 patients [41%] vs 3 [5%]; P=.001, respectively). Conversely, supraventricular arrhythmias did not differ between the 2 groups during acute and subacute phases (3 patients [14%] vs 8 [12%]; P=.871 and 6 patients [27%] vs 16 [24.5%]; P=.804, respectively). The prevalence of New York Heart Association class III-IV on admission was also significantly higher in the VAs group compared with the non-VAs group (P=.003), although this was not associated with significant differences in N-terminal pro-B-type natriuretic peptide values (13 982±35 450 pg/mL vs 4847±5241 pg/mL; P=.174), LVEF (44±10% vs 47±8%, P=.789) or diastolic dysfunction (≥ 2nd degree according to current recommendations19: 9 patients out of 43 [21%] vs 14 out of 44 [32%], respectively; P=.681).
Serum potassium values on admission and at 48hours were lower in the VAs group than in the non-VAs group (3.5±0.4 mmol/L vs 3.9±0.4 mmol/L, respectively, on admission, P=.020, and 3.3±0.4 mmol/L vs 3.9±0.5 mmol/L, respectively, at 48hours, P=.003, ). Serum potassium levels showed a moderate negative correlation with prolongation of the corrected global Tpeak-Tend interval (r−0.374, P=.004). Further comparisons of other clinical, analytical, and imaging parameters are shown in table 1, .
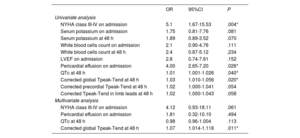
Independent predictors of subacute ventricular arrhythmiasUnivariate logistic regression analysis (table 3A) showed that New York Heart Association class III-IV on admission, the QTc interval at 48hours, corrected global Tpeak-Tend interval at 48hours and pericardial effusion on admission, were potential predictors of subacute VAs. Multivariate analysis (table 3B) further confirmed the corrected global Tpeak-Tend interval at 48hours as the only independent predictor of subacute VAs.
Regression analyses for predictors of the occurrence of subacute VAs. Univariate analysis and multivariate analysis
| OR | 95%CI | P | |
|---|---|---|---|
| Univariate analysis | |||
| NYHA class III-IV on admission | 5.1 | 1.67-15.53 | .004* |
| Serum potassium on admission | 1.75 | 0.81-7.76 | .081 |
| Serum potassium at 48 h | 1.89 | 0.89-3.52 | .070 |
| White blood cells count on admission | 2.1 | 0.90-4.76 | .111 |
| White blood cells count at 48 h | 2.4 | 0.87-5.12 | .234 |
| LVEF on admission | 2.8 | 0.74-7.61 | .152 |
| Pericardial effusion on admission | 4.00 | 2.65-7.20 | .026* |
| QTc at 48 h | 1.01 | 1.001-1.026 | .040* |
| Corrected global Tpeak-Tend at 48 h | 1.03 | 1.010-1.056 | .020* |
| Corrected precordial Tpeak-Tend at 48 h | 1.02 | 1.000-1.041 | .054 |
| Corrected Tpeak-Tend in limb leads at 48 h | 1.02 | 1.000-1.043 | .058 |
| Multivariate analysis | |||
| NYHA class III-IV on admission | 4.12 | 0.93-18.11 | .061 |
| Pericardial effusion on admission | 1.81 | 0.32-10.10 | .494 |
| QTc at 48 h | 0.98 | 0.96-1.004 | .113 |
| Corrected global Tpeak-Tend at 48 h | 1.07 | 1.014-1.118 | .011* |
95%CI, 95% confidence interval; LVEF, left ventricular ejection fraction; OR, odds ratio; QTc, corrected QT interval; VAs, ventricular arrhythmias.
Receiver operating characteristic analyses of repolarization parameters showed that the corrected global Tpeak-Tend interval at 48hours provided a significantly larger area under the curve (0.740) compared with the QTc interval at 48hours (0.611) (Z test P=.040) (figure 3D). A cut-off value of 108 msec for the corrected global Tpeak-Tend interval at 48hours showed the best combination of sensitivity and specificity (71% and 72%, respectively). Subacute VAs occurred in 48% of patients with corrected global Tpeak-Tend interval>108 msec and in 24% with values<108 msec (P=.040, figure 3E).
Ventricular arrhythmias and mortality during hospitalizationMortality rates were significantly higher in the VAs group than in the non-VAs group (n=4 [18%] vs n=2 [3%], respectively, P=.030). Further analysis showed no significant differences between life-threatening and non-life-threatening subacute VAs in such patients (1 patient with VF [20%] vs 3 patients with non-sustained VT [17.6%], P=1.0, respectively; see also ). Subacute VAs yielded an odds ratio of 7.01 after univariate logistic regression analysis (95% confidence interval, 1.1-41.3, P=.032). Acute VAs (within the first 48hours) were not significantly different between non-survivors and survivors (2 patients [33%] vs 12 [15%], P=.246, respectively).
Other relevant complications during hospitalization were similar between the VAs and non-VAs groups ().
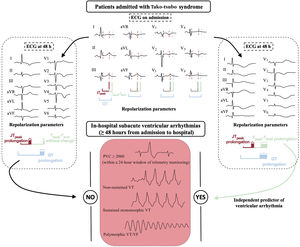
DISCUSSIONThe main results of this study show that repolarization abnormalities detected on abnormal prolongation of the corrected global Tpeak-Tend interval at 48hours from admission are independently associated with subacute VAs events (after the first 48hours of admission) in patients admitted with tako-tsubo syndrome (figure 4). Moreover, subacute VAs seem to represent an important prognostic marker as they were associated with significantly higher in-hospital mortality, which was not observed in patients with only acute VAs (during the first 48hours of admission). To the best of our knowledge, this is the first study in which the corrected global Tpeak-Tend interval, measured as the mean value of both frontal and precordial leads of the ECG, has been found to predict the risk of VAs during the subacute phase of tako-tsubo syndrome.

Central illustration. Comparison of electrocardiographic repolarization parameters in patients with tako-tsubo syndrome between 12-lead ECG on admission and at 48hours and correlation of corrected global Tpeak-Tend prolongation with the occurrence of in-hospital subacute ventricular arrhythmias. ECG, electrocardiogram; PVCs, premature ventricular contractions; VF, ventricular fibrillation; VT, ventricular tachycardia.
Dynamic cardiac repolarization alterations are a hallmark of tako-tsubo syndrome during hospitalization, which may reflect the underlying arrhythmic risk. Indeed, various electrocardiographic parameters have been investigated to evaluate their potential value for VAs risk stratification. However, the results of ECG parameters for this purpose have been inconclusive,6–12 suggesting specific features warranting further research effort. The results of this work fit into the context of new ECG-based strategies for risk stratification of subacute VAs in patients with tako-tsubo syndrome, which still represents an unresolved issue. Moreover, in our study, subacute VAs, both life-threatening and non-life-threatening, were associated with an increase of in-hospital mortality, which was not observed with acute VAs. The latter highlights the relevance of rhythm alterations beyond the first 2 days after the onset of the syndrome and stress the relevance of telemetry monitoring during hospitalization, not limited to the first 48hours.21
Overall, these results provide new prognostic insights for clinical outcomes in this subset of patients, which currently are limited and rely on clinical variables such as triggering factors, age, male sex, diabetes mellitus, LVEF, blood pressure and heart rate on admission, included in the recent InterTAK Prognostic Score.22
In patients with tako-tsubo syndrome, cardiac magnetic resonance studies have described a dynamic correlation between transmural and regional repolarization alterations and transient myocardial edema, which colocalize with regional wall motion abnormalities. Interestingly, a parallel time-course has also been described, showing maximum values after 48hours from admission (subacute phase),23–26 in the absence of ventricular signs of scarring.27,28 These seminal results have paved the way to the hypothesis that the most likely mechanism of subacute VAs in this population is re-entry, potentially around a functional intraventricular block induced by the delayed and dispersed ventricular apico-basal, interventricular and transmural repolarization gradients in the setting of an edematous myocardium. However, a delayed repolarization may also increase the risk of early afterdepolarization-induced triggered activity.5,21 It is also well recognized that the steepness of repolarization gradients is much more arrhythmogenic than the total magnitude of dispersion. Therefore, it is not surprising that our results on QTc values, representing the sum of depolarization and repolarization times, were not sufficiently specific to quantify the degree of heterogeneity of repolarization across contiguous regions of the heart and thus showed limitations to predict subacute VAs compared with the Tpeak-Tend interval. These differences in association between subacute VAs and ECG-based repolarization parameters are based on the concept that repolarization is not linearly distributed over time. Thus, the JTpeak interval represents only 25% of ventricular sites repolarized, while the Tpeak-Tend represents the remaining 75%.14 These data have also been corroborated by Xia et al.13 using endo-epicardial electroanatomical mapping, which has also demonstrated the contribution of both transmural and apicobasal repolarization gradients to the genesis of the T-wave and Tpeak-Tend.
In our study, only the Tpeak-Tend interval (but not the QTc and corrected JT peak) specifically increased from admission to 48hours afterwards in the group of patients with subacute VAs. Indeed, the Tpeak-Tend interval did not increase within the same hospitalization period in patients in the non-VAs group (table 2). This may reflect the fact that the Tpeak-Tend is a better indicator of dispersion of repolarization than the JT peak (early repolarization) or the QT interval (which also includes QRS duration) (table 3). Moreover, using the global Tpeak-Tend, as we propose in this series, may provide a more complete information of dispersion of repolarization rather than limiting the analysis to a single lead or the mean or the maximum value in precordial leads, as has been done in previous reports with conflicting results.6,7,10,29
Theoretically, measuring the Tpeak-Tend in a limited number of leads (eg, precordial leads) may be acceptable in the context of certain substrates such as the right ventricular outflow tract in Brugada syndrome.30 However, the complexity of repolarization alterations in tako-tsubo syndrome should require a more complete sampling approach using the 12 leads. In fact, our data show that only the mean value of the Tpeak-Tend in the 12 leads, not just the precordial or the limb leads, reached statistical significance as an independent predictor of subacute VAs in the multivariate analysis (table 3).
We also propose a cut-off point of 108 msec using the global corrected Tpeak-Tend interval to identify those patients at higher risk of developing subacute VAs. Interestingly, this value is almost in line with other clinical conditions which share pathophysiological elements with tako-tsubo syndrome. Thus, cut-off values of 106.3 and 109.6 msec have been reported for heart failure and ischemic heart disease, respectively, above which there is a higher risk of life-threatening VAs.15
LimitationsThe study shows some limitations. First, the relatively small size of our population and VAs events affected the statistical power, although our findings are in line with already reported results in a meta-analysis including other clinical scenarios.15 Similarly, the small number of deaths (50% due to noncardiac causes) makes it difficult to draw firm conclusions about the relationship between subacute VAs and in-hospital mortality. Second, daily 12-lead ECGs during hospitalization were not available, which limits the reconstruction of the entire dynamic trend of electrocardiographic repolarization parameters in this population, although it is has been reported that the main ECG-based repolarization time changes will happen within the first 48hours.21 Third, the identification of T-wave offset (for QT and Tpeak-Tend intervals) may be challenging when the T-wave morphology is flat or multiphasic. However, we used a recent validated approach based on experimental studies to make it consistent among cases.18,30
Finally, cardiac magnetic resonance data were available only in 19 patients out of 87 (21%), which did not allow further analysis of the correlation between inflammatory edema and repolarization alterations.
CONCLUSIONSIn patients with tako-tsubo syndrome, abnormal prolongation of the corrected and global Tpeak-Tend interval may be an effective predictor of subacute VAs events after the first 48hours of hospital admission. This widely available ECG-based approach was superior to the most commonly used QTc interval.
FUNDINGThis study did not receive any specific grant from funding agencies in the public, commercial, or not-for-profit sectors. G. La Rosa was partially supported by a fellowship program between CNIC and the Asociación del Ritmo Cardíaco de la Sociedad Española de Cardiología.
AUTHORS’ CONTRIBUTIONSG. La Rosa and G. Pelargonio contributed equally to this article. G. La Rosa conducted the statistical analyses and drafted the article. G. Pelargonio carried out the study design and is responsible for the overall content as guarantor. M.L. Narducci, G. Pinnacchio, G. Bencardino, F. Perna, F. Follesa, L. Galiuto and F. Crea made substantial contributions to the conception and design of the study. All authors contributed substantially to the acquisition of data and analysis or interpretation of the data. All authors revised the article critically for important intellectual content and approved the final version.
CONFLICTS OF INTERESTNone.
- •
Tako-tsubo syndrome has complex pathophysiologic features, hampering the identification of reliable tools for prognostic risk stratification. The Tpeak-Tend interval on conventional ECG tracings has been proven to reflect dispersion of repolarization times with prognostic implications in several clinical scenarios such as acute coronary syndromes.
- •
In patients with tako-tsubo syndrome, subacute VAs are associated with dynamic repolarization alterations that can be identified on conventional 12-lead ECG by using the corrected and global Tpeak-Tend interval at 48hours from hospital admission. This ECG-based parameter is superior to the classic QTc, which in this population highlights the arrhythmogenic potential of the steepness of repolarization dispersion along heart axes, rather than the magnitude of the heterogeneity.
Supplementary data associated with this article can be found in the online version, at https://doi.org/10.1016/j.rec.2022.12.001