Abnormal QT interval durations and dispersions have been associated with increased risk of ventricular arrhythmias. The present study examines the possible arrhythmogenic effect of inducing QT interval variations through local epicardial cooling and warming.
MethodsIn 10 isolated rabbit hearts, the temperatures of epicardial regions of the left ventricle were modified in a stepwise manner (from 22°C to 42°C) with simultaneous electrogram recording in these regions and in others of the same ventricle. QT and activation-recovery intervals were determined during sinus rhythm, whereas conduction velocity and ventricular arrhythmia induction were determined during programmed stimulation.
ResultsIn the area modified from baseline temperature (37°C), the QT (standard deviation) was prolonged with maximum hypothermia (195 [47] vs 149 [12] ms; P<.05) and shortened with hyperthermia (143 [18] vs 152 [27] ms; P<.05). The same behavior was displayed for the activation-recovery interval. The conduction velocity decreased with hypothermia and increased with hyperthermia. No changes were seen in the other unmodified area. Repetitive responses were seen in 5 experiments, but no relationship was found between their occurrence and hypothermia or hyperthermia (P>.34).
ConclusionsIn the experimental model employed, local variations in the epicardial temperature modulate the QT interval, activation-recovery interval, and conduction velocity. Induction of heterogeneities did not promote ventricular arrhythmia occurrence.
Keywords
Interest is growing in the clinical utility of electrocardiogram measurement of changes in the QT interval duration. Abnormal QT interval durations, both short and long, have been associated with increased risk of malignant ventricular arrhythmias.1–8 Future ventricular tachyarrhythmias can be predicted by ventricular repolarization heterogeneity, which may be indicated by QT dispersion.9–12 The QT dispersion is defined as the difference between the longest and shortest QT intervals obtained with 12-lead electrocardiography. This indicator can be corrected using heart rate,13 although there is some controversy regarding the benefit of using a corrected QT dispersion.
Controlled modification of the QT interval in experimental models may be useful for studying the mechanisms of cardiac arrhythmias. Cardiac electrophysiology can be affected by both physical and pharmacological agents, with temperature belonging to the first category. Thus, both hypothermia and hyperthermia can be used as tools in isolated heart studies for modifying baseline values of the QT interval, as well as those of other parameters. If the thermal modifications are localized, the local effects on the QT interval cause an increase in the QT dispersion, thereby causing purportedly arrhythmogenic situations. Prolongation of the QT interval and widening of the QRS complex on surface electrocardiogram are typical symptoms of hypothermic situations.14,15 Another sign is a slowing of the heart rate when the hypothermia is widespread, via an effect on the sinoatrial node. Few studies, including experimental models, have analyzed the effect of localized temperature variations on the QT interval. In the present study, we used a device that directly modifies the temperature of an area of the epicardial surface whose electrical activity is being recorded. The technical aspects of this method have previously been described, and preliminary use of the technique has shown its ability for locally modulating the electrophysiological substrate of the epicaridum.16
In the experimental isolated heart model, heterogeneity induced by local thermal modifications in the electrophysiological substrate of the epicardial tissue can facilitate the occurrence of repetitive responses or ventricular fibrillation. In the current work, we use the previously developed thermal modification device to evaluate the possible arrhythmogenic effect of inducing QT dispersion.
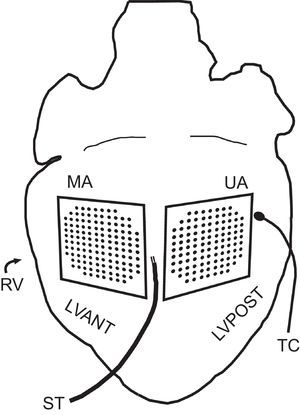
METHODSExperimental Preparation. Temperature ModificationExperiments were performed in accordance with Spanish Royal Decree 1201/2005 of the 10th of October 2005 concerning the use of animals.17 Ten New Zealand rabbits were used (mean weight [standard deviation (SD]), 2.5 [0.3] kg). Following ketamine anesthesia (intramuscular, 35mg/kg) and heparinization, the animals were killed by cervical dislocation. Hearts (mean weight, 8.9 [1.6] g) were removed and immersed in cold (4°C) Tyrode solution. Following isolation, the aorta was connected to a Langendorff system for perfusion with Tyrode solution at a pressure of 60mmHg and temperature of 37 (0.5) °C. The millimolar composition of the perfusion fluid was: 130.0 NaCl, 24.2 NaHCO3, 4.7 KCl, 2.2 CaCl2, 1.2 NaH2PO4, 0.6 MgCl2, and 12.0 glucose. Oxygenation was performed with a mix of 95% O2 and 5% CO2. A multiple electrode was situated at the anterior wall of the left ventricle (modified area) for epicardial mapping with an integrated thermoelectric system (128 unipolar electrodes; 1-mm interelectrode spacing) for temperature modification and control.16 A conventional multiple electrode was situated (103 unipolar electrodes; 1-mm interelectrode spacing) on the epicardial surface of the posterolateral wall of the same ventricle (unmodified area). The temperatures of both areas were monitored using type K thermocouple probes. The first of these was integrated into the recording surface of the thermal modification device; the second was placed in a remote area of the ventricular epicardium of the left ventricular posterior wall. A bipolar epicardial stimulating electrode was used (diameter, 0.125mm; interelectrode distance, 1mm), located between the areas covered by the 2 electrodes (Figure 1) and connected to a GRASS S88 stimulator equipped with a stimulus isolation unit. Stimuli were applied via a train of rectangular pulses 2ms in duration and at a voltage equal to double the diastolic threshold. Electrogram recordings were obtained through a cardiac electrical activity mapping system (MAPTECH; Waalre, The Netherlands). The reference electrode consisted of a 4×6mm silver plate located over the cannulated aorta. All signals were amplified with a 100Hz-300Hz gain, filtered (bandwidth, 1Hz-400Hz), multiplexed, and digitalized (resolution, 12 bits). The sampling rate was 1000Hz per channel. Thermocouple temperature was recorded with Fluke® digital thermometers (Fluke Co.; Everett, Washington, United States).
ProtocolTemperature Modification Protocol
Fifteen minutes after electrode positioning, the temperature of the modified area was reduced in 5°C steps by regulating the electrical current of the thermoelectric device. The epicardial temperature was maintained at each step for at least 2minutes (in the following order: 37, 32, 27, 22, 37, 42, and 37°C) before electrical recording and stimulation.
Electrical Stimulation ProtocolAt each of the target temperatures, a ventricular extrastimuli test was applied with a train of 10 basic stimuli, decreasing the coupling interval of the additional stimuli in 5-ms steps from the basic cycle until capture failed. The process was repeated with 1, 2, and 3 extrastimuli, in that order. In the case of 2 and 3 extrastimuli, the penultimate extrastimuli were given a value that was 15ms higher than the interval at which capture failure occurred in the preceding test. The process was performed for 2 basic cycles, 250ms and 150ms.
Data AnalyzedIn each of the 2 areas analyzed and at each temperature, the following parameters were determined during sinus rhythm: a) QT interval, measured from the initiation of activity until the end of the T wave, considering the moment in which a change occurs in the slope of the wave or the intersection with the isoelectric line18 (mean of 5 measurements), and b) activation-recovery interval (ARI), measured as the interval between the minimum derivative of the QRS complex and the maximum derivative of the T wave19 (mean of 5 measurements). The following were determined during programmed stimulation: a) number of repetitive responses, with 1 or more spontaneous depolarizations after an extrastimuli not directly produced by external stimulation or from the sinus node counted as 1 unit, and b) longitudinal conduction velocity (CV) from activation maps obtained in a basic stimulation cycle of 250ms, calculated by dividing the distance between 2 electrodes located perpendicularly to isochrones separated by at least 5mm, one of which was situated close to the stimulation site, by the difference between their activation times.20
Statistical AnalysisData are presented as mean (SD). Comparisons between 2 groups of data were performed using a Student t test for matched data, whereas comparisons among groups of data were performed using one-way analysis of variance (repeated-measures analysis of variance). Determination of the relationship among variables was performed using a chi-square test for contingency tables. Linear regressions between pairs of variables were performed using the least squares method. Differences at P<.05 were considered significant. Statistical analysis was performed by using SPSS® (SPSS Inc.) statistical analysis software and the Excel 2007 spreadsheet of Microsoft® Office.
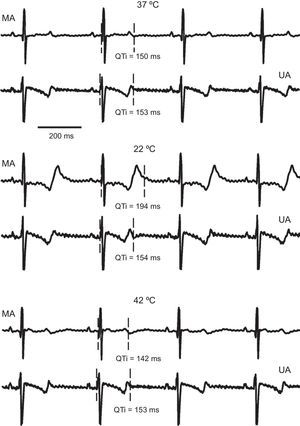
RESULTSQT IntervalThe effect of local temperature changes on the QT interval are shown in Figure 2. Epicardial signals from 1 experiment are shown, corresponding to an electrode located in the modified area and another in the unmodified area, at the perfusion temperature, maximum hypothermia, and hyperthermia. Local cooling caused a prolongation of the QT interval at the modified area, while no significant changes were seen in this parameter in the other area. Similarly, warming the area of operation reduced the QT interval, which was not seen in the remote area.
, hypothermia (22°C), and hyperthermia (42°C) conditions, corresponding to 1 of the experiments. MA, modified area; QTi, QT interval; UA, unmodified area.")
Electrogram segments simultaneously recorded in a channel of the modified area and another of the unmodified area, under control (37°C), hypothermia (22°C), and hyperthermia (42°C) conditions, corresponding to 1 of the experiments. MA, modified area; QTi, QT interval; UA, unmodified area.
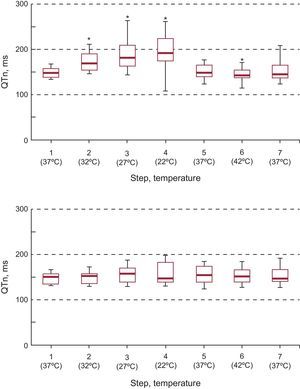
The sequence of variations in the QT interval in the modified and unmodified areas is shown in Figure 3. Localized thermal modifications produced variations in the QT from baseline. Likewise, the modifications produced differences from the remote area. The QT changes in the unmodified area were not significant (P<.92).
 in the modified area and from the unmodified area (P<.05).")
Box plots showing the evolution of the QT interval in the modified and unmodified areas at the distinct temperatures steps. QTm, QT interval in the modified area; QTu, QT interval in the unmodified area.
*Significantly different from step 1 (37°C) in the modified area and from the unmodified area (P<.05).
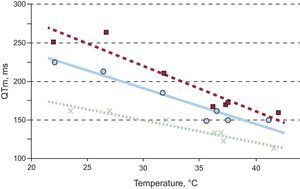
There was a linear relationship between the QT interval and the temperature in the modified area (0.80<|r|<0.97; P<.05). Regression fits of 3 of the experiments are shown in Figure 4. Applying regression analysis to the data of all experiments resulted in the following regression line: QT interval in the modified area=−2.93·temperature of the modified area+261 (r=–0.67; P<.0001).
Activation-recovery Interval
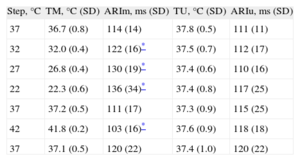
The ARI results in the modified and unmodified areas are shown in the Table, together with the temperatures reached at each step. As was the case with the QT interval, the localized thermal modifications produced variations in the ARI from baseline. Similarly, the modifications produced differences from the ARI of the remote area. The changes in the ARI from baseline in the unmodified area were not statistically significant (P<.89).
Temperatures and Activation-recovery Intervals During Sinus Rhythm (n=10)
| Step, °C | TM, °C (SD) | ARIm, ms (SD) | TU, °C (SD) | ARIu, ms (SD) |
| 37 | 36.7 (0.8) | 114 (14) | 37.8 (0.5) | 111 (11) |
| 32 | 32.0 (0.4) | 122 (16)* | 37.5 (0.7) | 112 (17) |
| 27 | 26.8 (0.4) | 130 (19)* | 37.4 (0.6) | 110 (16) |
| 22 | 22.3 (0.6) | 136 (34)* | 37.4 (0.8) | 117 (25) |
| 37 | 37.2 (0.5) | 111 (17) | 37.3 (0.9) | 115 (25) |
| 42 | 41.8 (0.2) | 103 (16)* | 37.6 (0.9) | 118 (18) |
| 37 | 37.1 (0.5) | 120 (22) | 37.4 (1.0) | 120 (22) |
ARIm, activation-recovery interval of the modified area; ARIu, activation-recovery interval of the unmodified area; SD, standard deviation; TM, temperature of the modified area; TU, temperature of the unmodified area.
In the modified area, a signification reduction in the CV was seen with hypothermia (68 [16] cm/s at 22°C vs 75 [16] cm/s at 37°C; P<.05), as well as an increase with hyperthermia (80 [18] cm/s at 42°C vs 75 [16] cm/s at 37°C; P<.05). In contrast, the changes in this parameter did not reach statistical significance in the region not subjected to thermal modifications (75 [20] vs 69 [15] cm/s; P>.22; and 76 [23] vs 69 [15] cm/s; P>.26).
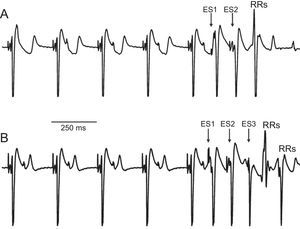
Presence of Repetitive ResponsesAnalysis of the signals obtained in all executions of the ventricular extrastimulus test after application of the experimental protocol revealed the presence of repetitive responses in 5 of the 10 hearts (Figure 5). A total of 49 repetitive responses were obtained (37 of them from just 2 experiments): 24 were produced at the baseline temperature, 16 during hypothermia, and 9 during hyperthermia. After performing the chi-square test for contingency tables, no relationship was found between the occurrence of repetitive responses and locally induced hypothermia or hyperthermia (P>.34). Programmed stimulation failed to induce ventricular fibrillation, except in 1 case (produced at 22°C). In that case, the ventricular fibrillation could not be reproduced after electric shock-induced restoration of sinus rhythm and continuation of the protocol.
DISCUSSIONElectrophysiological Parameters. B: 2 repetitive responses after 3 extrastimuli (27°C). ES, extrastimuli; RRs, repetitive responses.")
In the current study, gradual and stepwise localized cooling of the epicardium produced a progressive increase in the QT interval in the modified area. Similarly, warming of the area reduced the QT interval. In both cases, no concomitant changes were produced in the region of the same ventricle that was not subjected to temperature variations. All induced alterations disappeared upon reestablishment of the perfusion temperature, showing the reversibility of the effect. The changes observed between the 2 areas showed that the local temperature modifications applied to the modified area significantly altered the QT interval with respect to the unmodified area (Figure 3). The results at 22°C and 42°C are consistent with those obtained during the technical validation of the thermal modification device, in which effects were analyzed at only these 2 temperatures.16
The changes observed in the QT interval were accompanied by proportional changes in the ARI, which is correlated with the refractory period.21 Moreover, the CV decreased during hypothermia and increased during hyperthermia in the area of operation. This last parameter would be related with alterations in the resting potential and, thus, of phase zero of the action potential, as well as other factors.22,23 Thermically induced modifications in the refractoriness and the CV would have caused changes in the spread of activation, as seen in previous studies.22,24–26
With both hypothermia and hyperthermia, localized modification of the QT interval caused heterogeneity in the QT values of the ventricular myocardium. This heterogeneity was more pronounced the greater the thermal gradient between the areas.
Although various authors14,15 have already described temperature-induced changes in the QT interval, the flexibility of the method used here to gradually and specifically modify the temperature below and above the baseline temperature permits analysis of the relationship between the 2 parameters. A moderate correlation was seen between the QT interval of the modified area and temperature, and this relationship fit a regression line in the range analyzed (Figure 4).
Induction of Ventricular ArrhythmiasThe localized thermal action on the ventricular epicardium created closely located regions with different electrophysiological properties, causing variability in the analyzed parameters. Various studies have attributed an arrhythmogenic effect to QT interval dispersion.9,11 In the present study, a programmed stimulation protocol was used to investigate the occurrence of repetitive ventricular responses as an indicator of the arrhythmogenicity of the myocardial substrate.27,28 However, application of stimuli with a short coupling interval close to the modified area during temperature modification failed to significantly alter the production of this type of response.
Therefore, the changes introduced in the epicardium were unable to establish arrhythmogenic conditions manifesting as repetitive responses or ventricular tachycardias. This finding may be due to insufficient QT dispersion, which would be affected by limitations in the extent of the thermal variations induced in the myocardium, both in extension and in depth, an aspect that was assessed during device evaluation.16
Regarding the temperature-induced modifications in the modified area itself, the variations in the CV and refractoriness (indirectly associated with the QT interval and ARI), by acting in a simultaneous but opposed manner, could have contributed to small changes in the length of the wave. This fact, together with the limited extension of the affected region, could also explain the absence of an increase in arrhythmia inducibility due to hypothermia or hyperthermia in the model used.
In another study that used an experimental model involving local cooling of an epicardial layer isolated via cryoablation,29 ventricular tachycardias were induced via programmed stimulation with sequential pulse trains of a 300-ms basic cycle followed by up to 3 extrastimuli. During hypothermia, the generation of these polymorphic tachycardias was promoted by functional reentry circuits. This discrepancy with regard to our results could be due to their use of a bidimensional model in which ablation causes vascularization loss that potentiates the cooling effect, with a consequent impact on tissue electrophysiology. Moreover, the activation in the 1-mm layer of tissue obtained by cryoablation may substantially differ from that of the substrate in our model. Regardless, in our model of electrophysiology modification, the local thermal modifications failed to cause arrhythmogenic responses, probably due to an insufficient degree of dispersion induced in the QT.
CONCLUSIONSLocalized hypothermia induces heterogeneity in the QT by prolonging the QT interval in the modified area; this prolongation is accompanied by a similar prolongation of the ARI and a decrease in the CV. Similarly, local hyperthermia increases QT dispersion by reducing the QT interval in the modified area, shortening the ARI and increasing the CV. During hypothermia, the magnitude of the effect depends on the degree of variation achieved, and there is a linear relationship between temperature and QT in the range studied.
In our experimental model, although the local variations in the epicardial temperature significantly altered the QT interval, as well as the CV and ARI, the resulting dispersion failed to cause arrhythmogenic effects, probably due to a failure to affect a sufficiently large tissue area.
FUNDINGThis work has been funded by the following research grants: FIS PI12/00993-00407 (Instituto de Salud Carlos III), PROMETEO 2010/093 (Generalitat Valenciana), and the VLC Campus de Excelencia “Protección Cardiovascular”.
CONFLICTS OF INTERESTSNone declared.