Keywords
INTRODUCTION
Aortic valve stenosis has become a major problem for society. Treatment of advanced stages of stenosis is relatively well defined, although the earlier stages— particularly in cases in which severe stenosis is not accompanied by symptoms—are still the subject of much debate concerning management.1,2 One of the most important aspects in the assessment of a patient with aortic valve stenosis is the calculation of valve area. The most widely used method for assessing the severity of aortic valve stenosis is calculation of the effective area using the continuity equation. However, this method is not without its limitations. One of the most important is the calculation of the left ventricular outflow tract (LVOT) area, which is normally estimated with 2-dimensional echocardiography (2D-echo) by determining the diameter obtained from long-axis parasternal view. Besides the fact that this approach assumes that the LVOT is a perfectly circular structure, the standardized measurement of the area of this tract is subject to great variation according to the operator who performs the study and the limitations of the technique itself. It can therefore be inaccurate, which affects measurements as important as that of the aortic valve area.3,4
Recently, 3-dimensional echocardiography (3D-echo) has been incorporated into the routine clinical practice of many echocardiographic laboratories. The technique has many advantages in the assessment of valve disease. For example, it allows measurements to be made of different cardiac structures in any spacial plane. In view of this capability, it has proved to have a high diagnostic precision in other clinical situations such as mitral valve stenosis, subvalvular aortic valve stenosis, or determination of left ventricular volumes and function.5-12
Our objectives were the following: first, to determine whether the reproducibility of LVOT area measurement is greater with 3D-echo planimetry than with conventional 2D-echo used to measure the diameter; second, to determine the LVOT circularity index by means of 3D-echo; and, finally, to determine the usefulness of measuring the LVOT area by 3D-echo for quantifying the severity of valvular aortic stenosis.
METHODS
Study Population
Forty patients with aortic valve disease were recruited. Of these, 22 (55%) had aortic valve stenosis and 18 (45%) had aortic valve regurgitation as the underlying problem. None of these patients had any other valve disease that was more than mild in severity. All patients were informed of the diagnostic techniques to which they would be subjected and gave their informed consent. Likewise, after being informed of the nature of the study, they consented to their data being used anonymously for research ends.
Echocardiographic Study
All patients underwent a full echo-Doppler study with a Philips IE-33 device with S5-1 and X3-1 probes (Philips, Andover, Massachusetts, United States). The images were analyzed by 2 observers who performed the measurements independently; 1 of these observers repeated the measurement without knowing the result of the first.
Conventional Echocardiographic Studies
The 2-dimensional images of the LVOT were obtained from a long-axis parasternal view. The LVOT diameter was determined from these images. Continuous-spectrum Doppler traces were obtained of flow through the aortic valve during systole from an apical 5-chamber view and from a right parasternal plane. The trace with highest maximum and mean velocities was considered for subsequent analysis. In addition, traces were obtained by means of pulsed spectral Doppler techniques at the level of the LVOT during the systolic period using a 5-chamber apical view. The aortic valve area was estimated using the continuity equation.
Three-Dimensional Echocardiographic Studies
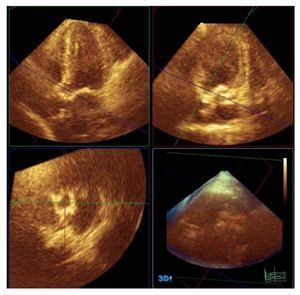
The 3D-echo studies were performed immediately after the conventional echo-Doppler study. For these measurements, a Philips X3-1 probe was used (Philips, Andover, Massachusetts, USA). This system allows for the use of the so-called "full volume" technique, a pyramid of data of 60o´60o from between 4 and 7 heartbeats; the size can be magnified or reduced depending on the morphologic characteristics of the patient. The 3-dimensional images were captured from the apical window. There were many reasons for using this window: it is the plane for image capture for full volume measurements for which we had most experience in our unit; with this window, it is possible to capture the greatest extent of cardiac structures; and, as this is a 3-dimensional technique, visualization of the study planes can be obtained from any projection. The images were stored on the central server of the imaging service of our hospital and were analyzed off-line at a workstation using Q-Lab software (Philips, Andover, Massachusetts). LVOT planimetry was undertaken using a section of the LVOT immediately before the plane of insertion of the valve leaflets and parallel thereto, during ventricular systole (Figure 1). Subsequently, measurement was taken of the long axis and the longest axis perpendicular to the long axis (referred to from now on as the short axis) of the LVOT and from this same image, the circularity index was obtained from the ratio of the long axis divided by the short one. The values used in the final analysis were the mean value of the measurements of the 2 independent observers.

Figure 1. Planimetry of the left ventricular outflow tract using 3-dimensinal echocardiography and Q-Lab software (Philips, Andover, Massachusetts, USA).
Statistical Methods
The statistics program used for the study was the SPSS 11.0 (SPSS Inc., Chicago, Illinois, USA). Quantitative data were expressed as means (SD). Qualitative data were expressed as numbers (percentage). The agreement between methods was evaluated using the intraclass correlation coefficient (ICC) and the 95% confidence intervals (CI) were calculated. In the case of categoric variables, the k statistic was used. To assess the degree of linear association between variables, a simple linear regression analysis was used. Statistical significance was established at P<05.
RESULTS
Of a total of 45 consecutive patients with aortic valve disease who were analyzed, it was impossible to carry out a correct analysis of the measurements of the LVOT in 5 patients (11%) due to a poor acoustic window, and so these patients were excluded from the study. Therefore, a total of 40 patients with aortic valve disease were included. The mean (SD) age was 65.5 (11) years. Of these, 23 (57.5%) were men. The measurements obtained by 2D-echo, 3D-echo, and pulsed Doppler and continuous Doppler techniques are shown in Table 1.

Analysis of Inter- and Intraobserver Agreement
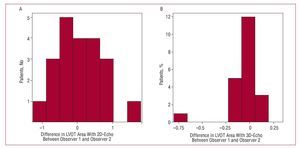
As presented in Table 2 and in Figure 2, the level of agreement, both between observers and for different measurements by the same observer, for determination of the LVOT area is much greater when measured directly using 3D-echo planimetry than when estimated from measurement of the LVOT diameter using 2D-echo.


Figure 2. Histograms representing the interobserver differences in measurements of the left ventricular outflow tract area. A: with 2-dimensional echocardiography (2D-echo). B: with 3-dimensional echocardiography (3D-echo).
Analysis of the Circularity Index
The mean values obtained for the long axis and the short axis of the LVOT were 2.68 (0.31) and 1.82 (0.28) cm, respectively. The circularity index was 1.5 (0.25) and showed a very low degree of linear association with LVOT area, and this was not statistically significant (r=-0.34; P=.47).
Impact of Using 3D-Echo for Quantifying Severity of Aortic Valve Stenosis
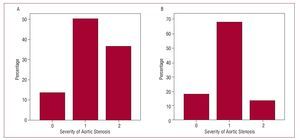
In order to assess the possible impact of the use of 3D-echo on the assessment of aortic valve stenoses, only patients diagnosed with aortic valve stenosis were considered (n=22). Two theoretical cross-sections of the valve area were then established and the patients were divided into 3 groups according to the following classification: moderate aortic valve stenosis if the valve area was greater than 1 cm2; severe if the area was between 1 and 0.75 cm2; and critical if the valve area was less than 0.75 cm2. The patients were classified as previously described using the results of the 2D-echo and the 3D-echo applied to the continuity equation (Figure 3). The k statistic for agreement between the 2 methods was only 0.36 (P=.11). Table 3 shows the results for agreement between the measurements obtained for the aortic valve area using 2D-echo and 3D-echo in patients with aortic valve stenosis (Figure 4).

Figure 3. Severity of aortic valve stenosis using the estimate of the left ventricular outflow tract area. A: with 2-dimensional echocardiography. B: with 3-dimensional echocardiography. Horizontal axis, 0: valve area >1 cm2; 1: valve area, 1-0.75 cm2; 2: valve area <0.75 cm2.


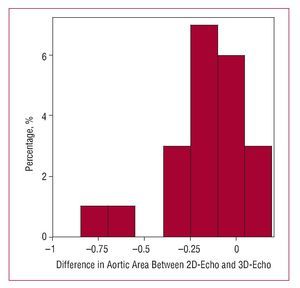
Figure 4. Histogram representing the differences in measurements of aortic valve area with 2-dimensional echocardiography (2D-echo) and 3-dimensional techniques (3D-echo).
DISCUSSION
Currently, the assessment of the severity of aortic valve stenosis is essential for an appropriate management of these patients.3,4 Although a range of methods can be used, such as measurement of peak gradients or velocities through the stenotic valve, it is always recommended to measure the valve area.13 However, this technique is not without its limitations. One of the most important is the calculation of the LVOT area, which is normally estimated using 2D-echo from the diameter obtained from a long-axis view in the parasternal plane. Besides the fact that this approach assumes that the LVOT is a perfectly circular structure, the standardized measurement of this tract varies greatly according to the operator who performs the study and the technique itself is subject to limitations. It can therefore be inaccurate, which affects quantification of the aortic valve area.3,4
Three-D-echo presents a theoretical advantage: direct planimetry of the LVOT can be obtained to provide an assessment of the anatomic reality of this structure. From a theoretical viewpoint, 3D-echo may be a useful tool for performing a precise anatomic assessment of the LVOT. This is because it is possible to reach a very precise approximation of the true opening, as we can orient the section in any spacial direction and, therefore, choose the optimal one.5,6,11 Thus, 3D-echo might be able to eliminate a serious limitation of calculation of the valve area using the continuity equation.
The results of the present study reveal some interesting findings. First, there is less inter- and intraobserver variability in the determination of the LVOT area with 3D-echo than when estimated using traditional 2D-echo methods. This suggests that this measurement might be more accurate than the one usually performed using 2D-echo. In addition, the results support the idea that the LVOT is not a circular structure but rather an elliptical one. This is another source of error in the determination of the LVOT area from the LVOT diameter. What we have called circularity index in this study shows that the morphology of the LVOT is not circular. This explains why the values for LVOT area obtained by 2D-echo are smaller than those obtained by direct planimetry with 3D-echo. Furthermore, the linear regression analysis shows that it is not LVOT area itself but rather individual variations that determine how close the morphology approaches a perfect circle and so 3D-echo may be useful regardless of the LVOT size. That is, the circularity of the outflow tract does not depend on its size but is independent of this variable and probably depends on the individual characteristics of the subject.
Finally, the data show that using 3D-echo, there are patients who can be classified in a different severity category than when 2D-echo is used. This finding could be particularly useful in the case of patients with asymptomatic aortic valve stenosis, in whom therapeutic management is particularly complicated.3,4,13,14
Limitations
The main limitation of this study is the lack of a reference measurement technique. We do not have to highlight the problems that this generates. However, studies done recently with cardiac magnetic resonance imaging and other studies with early 3D echocardiographic methods support our findings.15,16 In addition, the high reproducibility of the technique might point to some type of systematic error in the technique, a phenomenon that cannot be ruled out with the design of the present study. This study is a first approximation to the usefulness of 3D-echo in the assessment of aortic valve stenosis. The regular use of this diagnostic method in everyday clinical practice and future studies will assess the possibility of generalizing the findings of the present study to different types of patient.
CONCLUSIONS
Measurement of the LVOT area using 3D-echo is more reproducible than with 2D-echo. Therefore, this is probably a more accurate method for the evaluation of LVOT area. 3D-echo techniques show that the LVOT has an elliptical form and that its circularity does not depend on size. It may be that 3D-echo can provide a more accurate classification of the degree of severity of aortic valve stenosis than 2D-echo techniques.
ABBREVIATIONS
AoVA: aortic valve area
CI: confidence interval
2D-echo: 2-dimensional echocardiography
3D-echo: 3-dimensional echocardiography
ICC: intraclass correlation coefficient
LVOT: left ventricular outflow tract
Correspondence:
Dr. J.L. Zamorano.
Unidad de Imagen Cardiovascular. Hospital Clínico San Carlos.
Profesor Martín Lagos, s/n. 28040 Madrid. España.
E-mail: jlzamorano@vodafone.es
Manuscript received July 26, 2007.
Accepted for publication January 11, 2008.