Keywords
INTRODUCTION
A new therapeutic strategy should pass through many phases before being definitely accepted by the scientific community. The final phase provides unquestionable scientific evidence demonstrating that such a strategy leads to clinical benefit. Given that early revascularization in acute coronary syndromes and the use of beta-blockers and reninangiotensin system blocking agents have drastically reduced mortality among patients with heart disease, to demonstrate added benefit clinical trials are required that usually involve a very large number of patients, an economic cost and some important logistic difficulties. Before designing a study with these characteristics, sufficient information should be available indicating the hypothetical probability that a given therapeutic strategy will be beneficial. This information is obtained through mechanistic studies that demonstrate that the therapeutic strategy studied improves parameters associated with clinical benefit. These parameters are called surrogate end-points and are defined as parameters or physical signs used as substitutes for an endpoint with clinical meaning that measures the quality of life or mortality.1 The use of surrogate end-points has advantages and disadvantages that should be known before they are used.1
Many of the surrogate end-points used in clinical research on heart disease are parameters obtained using imaging techniques. The most frequently used end-point is left ventricular ejection fraction (LVEF). In this article, we review the rational basis for the use of ejection fraction as a surrogate endpoint, the need for imaging units able to calculate this parameter, the methodology needed to measure it in such a way that it can be used as a research tool, and the technique of choice according to the clinical context.
LEFT VENTRICULAR EJECTION FRACTION AS SURROGATE END-POINT
The term systolic left ventricular function (LVF) refers to the capacity of the left ventricle (LV) to generate force during systole. Left ventricular ejection fraction as a measure of ventricular function during systole assumes that the fraction of blood displaced from the left ventricle is proportional to the force generated. However, there are various pathological situations where LVEF does not correspond to LVF.2 Although other parameters have been proposed that more directly correlate with LVF, LVEF, and the ventricular dimensions are the ones most used in clinical trials because they are easy to apply, highly reproducible, are obtained non-invasively and, in particular, because a close relationship has been demonstrated between these parameters and clinical benefit.
Clear evidence exists on the relationship of LVEF and ventricular volumes to prognosis in patients who have had acute myocardial infarction,3 in heart failure4 and in patients who do not have a known heart disease.5 A relationship has also been demonstrated between improvements in these parameters during the patient improvement period6 or worsening as the patient's prognosis worsens.7 Finally, both LVEF and ventricular volumes are parameters that are familiar to clinicians, simple to grasp and are easy to measure with widely available techniques. Thus, the scientific community will better understand the usefulness of a therapeutic strategy if it improves LVEF or reduces ventricular volumes than if it favorably affects dP/dt or the Tei index, which are independent parameters of ventricular loading conditions, but that are less well-known or simple to grasp.
NEED FOR AN IMAGING UNIT FOR ThE QUANTITATIVE ANALYSIS OF VENTRICULAR FUNCTION
The imaging units for the centralized analysis of surrogate end-points (core laboratories or core labs) ensure blinded and impartial data analysis and thus avoid bias in favor of the proposed hypothesis. Furthermore, the conclusions based on data derived from these imaging units are very reliable. Studies conducted using echocardiographic parameters8 and angiographic parameters9 have shown that the results based on data obtained using independent imaging units corroborated the study hypotheses, whereas the results based on data from the local researchers contradicted the proposed hypothesis. Moreover, it has been demonstrated that the results obtained in centralized imaging units offer prognostic information, whereas this is not the case if the data are analyzed in the centers where the patients have been recruited.10 In contrast, by ensuring the independence of the measurements, bias in favor of the proposed hypothesis disappears, due to which a hypothesis generated in a single-center study may not be corroborated in a multicenter study where the data has been analyzed in a centralized imaging unit.
Furthermore, the use of centralized imaging units reduces inter-observer variability, which leads to substantial reductions in the number of patients needed to demonstrate or reject a hypothesis,11 given that the number of patients depends on the standard deviation of the surrogate end-point used, and that decreases as the variability of the measure decreases. On the other hand, measurement tools with a variability higher than the expected difference cannot be used. In this sense, since cell therapy studies indicate that there could be an improvement of 3%-5% in ejection fraction, there should be less variability within the imaging unit when measuring LVEF with the technique that has been used. Thus, it is essential that each imaging unit knows its own variability, and according to this the size of the sample can be established.
Of course, the measurements obtained in a unit with these characteristics are also subject to human error. The difference regarding the measurements conducted outside these units is that error within an imaging unit is smaller, predictable and does not depend on chance,12 since any image analysis unit can detect such an error and periodically calculates this.
TECHNIQUES AVAILABLE FOR CALCULATING LEFT VENTRICULAR FUNCTION
Echocardiography
Echocardiography is the most frequently used method to evaluate LVF in clinical trials. To acquire data which is very reliable and of the highest quality, several recommendations should be taken into account.13 The images should be acquired according to current guidelines after the echocardiography specialist has been trained in the laboratory, and the number of professionals conducting the measurements in clinical trials should be as few as possible to reduce variability. Furthermore, image assessment and quality control is required before initiating a clinical study and during it. In clinical practice LVF is very frequently estimated visually, and is a useful method in the hands of experts and in the clinical context, but is not advisable for multicenter clinical trials.14
M-mode echocardiography is the classic method used to measure LVF. This method is very useful for examining normal ventricles, but is not reliable for dilated or asymmetrical ventricles where the relationships between their axes are altered. Another limitation is related to alterations in the motion of the interventricular septum, as occurs in the case of complete left branch block, pacemaker rhythm or right ventricular volume overload.
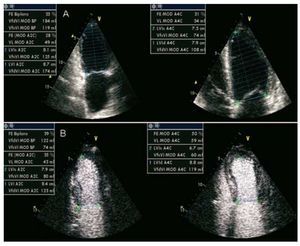
The most frequently used method to measure LVEF by two-dimensional echocardiography is the Simpson method (Figure 1). Its accuracy is not affected by dilated or asymmetrical ventricles or by alterations in wall motion. This is based on the fact that LV volume is equal to the total of the volumes of different contiguous disks perpendicular to the main LV axis and that fill the entire ventricular cavity. The edges of the LV endocardium at the end of systole and diastole and its main axis should be dealt with manually. Echocardiography software calculates the ventricular volumes and LVEF. Its main drawback is its dependency on the definition of the endocardium. To calculate this, the apical four-chamber view is used (while attempting to open both ventricles to their maximum dimension), and the apical 2-chamber view (this should not include the aorta or right ventricle). Second harmonic imaging has increased the resolution of the ventricular endocardium, thus reducing observer variability when analyzing the LVF.15 Image quality can be increased by contrast echocardiography (Figure 1B) which improves visualization of the endocardial borders while reducing observer and interobserver variability.16 If contrast enhancement is used in a research project, this should be used in all the patients because the volumes obtained with contrast enhancement are greater than those obtained without this.

Figure 1. Echocardiographic study in apical 4- and 2-chamber views. Calculation of ventricular volumes and LVEF with 2-dimensional echocardiography without intravenous echocardiographic contrast media (A) and with contrast media (B).
Three-dimensional echocardiography is a method which is not based on geometric assumptions. Several studies have shown it to be superior to the Simpson method, although these were performed with a small number of patients. In addition, image acquisition and analysis time have been considerably reduced.17 This method eliminates the problem of base-to-apex shortening during LV measurement that occurs in two-dimensional studies and more accurately determines ventricular volumes.
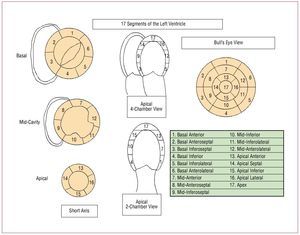
The measurement of regional LV contraction may be a better prognostic indicator than LVEF.18 Regional function is assessed using the 17-segment division agreed by consensus by several scientific societies (Figure 2).19 This division should be followed whenever a clinical trial is conducted. Each segment is scored according to its mobility (1, normal; 2, hypokinetic; 3, akinetic; 4, dyskinetic). The wall motion score index is calculated by totaling the scores of all the visualized segments divided by the number of visualized segments. Thus, it is independent of the number of segments studied. A score of 1 is normal. The higher the score the worse is regional function.

Figure 2. Classification of the 17 segments of the left ventricle in bull's-eye view, echocardiographic parasternal short axis slices, and apical 4- and 2-chamber views.
Magnetic Resonance Imaging
Quantification of the LVF by magnetic resonance imaging (MRI) is reliable, reproducible and is more accurate than that obtained by echocardiography when not subject to geometric assumptions. Its high spatial and temporal resolution and the contrast that it provides between blood and myocardium make it an excellent technique to study LVF.
Analysis of General Ventricular Function
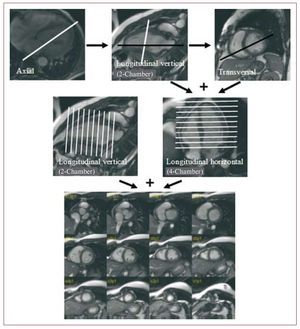
The sequences that are used to study the LVF are echo-gradient sequences in cine mode. Currently, fast echo-gradient sequences are available, called SSFP (steady-state free precession), that offer better contrast between blood and myocardium and are the ones used to study LVF. The protocol used to study the LVEF is summarized in Figure 3.

Figure 3. Scheme representing the steps to follow when conducting the left ventricular ejection fraction study using magnetic resonance imaging.
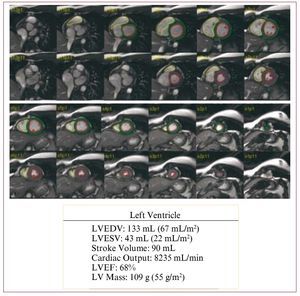
The parameters that can be quantified are LV end-diastolic volume (LVEDV), LV end-systolic volume (LVESV), stroke volume, LVEF, and mass. The Simpson method is applied to calculate ventricular volumes. To calculate the volume of a given slice, the area of the cavity (determined by the endocardial border) is multiplied by the thickness of the slice (or the thickness of the slice plus the distance between slices, if this has been used). The difference between LVEDV and LVESV is the stroke volume. The LVEF is estimated from the LVEDV and stroke volume (stroke volume [mL]/ LVEDV [mL] × 100). We can also calculate cardiac output and cardiac index by using the body surface area. All determinations are usually indexed using the body surface area. Figure 4 shows an example of the functional analysis of the LVF.

Figure 4. Functional analysis of both ventricles with magnetic resonance imaging via delimitation of the epicardial and endocardial borders in each plane in systole and diastole. LVEDV indicates left ventricular enddiastolic volume; LVEF, left ventricular ejection fraction; LVESV, left ventricular end-systolic volume; MRI, magnetic resonance imaging; LV, left ventricular.
Two practical issues can hinder the quantitative analysis. The papillary muscles should be excluded from measurements of left ventricular volume. On the other hand, it can be difficult to decide which basal slices of the LV should be included in the analysis. During systolic contraction the ventricle moves toward the apex, and thus in the most basal slices the ventricle in diastole is visible, as well as the left atrium, but not the ventricle in systole. The solution to both problems is consistency20: the same slices of the papillary muscles should be eliminated from the analysis of the diastolic and systolic phase. The basal slices where the cardiac muscle describes a complete circumference or more than 50% of this should be included in the analysis. Due to longitudinal displacement in systole there is some lag and, in general, 1 or 2 extra basal slices in enddiastole should be analyzed than in end-systole.
Analysis of Regional Ventricular Function
The parameters used to study regional function are ventricular wall thickness, systolic thickening, and longitudinal and circumferential motion or wall shortening. The centerline method is used to quantify the thickness and thickening of the ventricular wall. In short-axis images, myocardial thickness is divided by a line into 2 parts of similar thickness and equidistant to the endocardium and epicardium; multiple lines are drawn perpendicular to this line and that cover the entire myocardium at defined intervals. The length of each line indicates parietal thickness, while the relationship between the length of each line at the end of systole and diastole defines systolic thickening. A sufficient number of lines will prevent small anomalies in wall motion being overlooked.
Regional function can be analyzed by making use of myocardial tagging which consists in applying, on a standard SSPF sequence, a radiofrequency prepulse perpendicular to the plane of the image, immediately after the electrocardiogram R-wave, that appears in the image as a grid made up of parallel black linear, rectangular or radial bands superimposed on the myocardium, and that undergo deformation during systole depending on the contractility of each myocardial region.
Ventriculography
Analysis of Total Ventricular Function
Left ventriculography is performed by directly injecting contrast medium into the mid-region of the ventricular cavity using a pigtail catheter. This position completely opacifies the cavity from the basal part up to the apex, does not interfere with the mitral subvalvular apparatus, does not cause myocardial blushing, and induces little ventricular ectopic activity. The most frequently used views are 30o right anterior oblique and 60o left anterior oblique.
Initial studies appeared to obtain greater accuracy when calculating ventricular volumes using 2 views,21 although it was later shown that this was not the case, even in patients with ventricular dysfunction and alterations in regional contractility.22 For this reason, normal clinical practice employs the right anterior oblique view, since it is simpler, cheaper and involves less radiation.
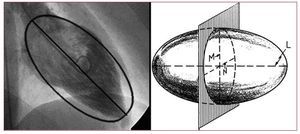
Various geometric methods have been developed that enable quantification of the ejection fraction and are based on determining ventricular volumes using mathematical models that assume that the ventricular cavity is symmetrical. After the LVESV and LVEDV have been calculated, the LVEF, ejection volume, and cardiac output are calculated. The mathematical methods used for this calculation are the disk method (Simpson's rule)23 and the Dodge-Sandler area-length method21 (Figure 5). Currently, the latter method is the one most frequently used and is based on the fact that the LV in the 30o right anterior oblique view and 60o left anterior oblique view resembles an ellipse, making the longitudinal axis of the ventricular cavity coincide with the longitudinal axis of this shape.21 By calculating the volume of the ellipsoid we obtain ventricular volume.

Figure 5. Length-area method. A: in the right anterior oblique view the left ventricle resembles an ellipse; by calculating the volume of the ellipsoid we obtain ventricular volume. B: to calculate volume of the ellipsoid, the length of the longitudinal axis (L) needs to be known as well as that of the 2 transverse axes (M and N) via planar ventriculography.
Analysis of Regional Ventricular Function
To establish alterations in contractility, ventriculography divides the LV into 5 segments in the right anterior oblique view (anterobasal, anterolateral, apical, lower or diaphragmatic, and posterobasal) and into 2 segments in the left anterior oblique view (posterolateral and septal).24 Wall motion is classified as normal, hypokinetic, akinetic, dyskinetic, or aneurysmatic. Some studies have shown that measuring regional contractility is a better prognostic indicator than LVEF.25
Regional contractility is assessed by analyzing the motion of each point on the ventricular contour. In clinical practice, the orthogonal, radial, and centerline models are the ones most often used. The orthogonal model is based on assuming that each point on the ventricular wall moves perpendicular to the longitudinal axis of the cavity. This is a simple model, but does not accurately describe the motion of the entire ventricular cavity; furthermore, it assumes a homogeneous shortening of the longitudinal axis that is not applicable in cases of ischemia. The radial model assumes that all the points on the ventricular contour move toward a single central point. This model presents the drawback that when choosing the central point the differences in thickening in different wall segments are not taken into account nor the presence of hyperkinetic regions that can create artifacts and make akinetic segments appear to be contractile.26
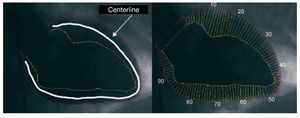
The centerline model more accurately reflects the motion of the ventricular cavity and has strong advantages compared to other systems.27,28 This type of analysis correctly distinguishes healthy subjects from patients with coronary disease29 and is directly related to the severity of coronary disease and ejection fraction.28 In this method an artificial line parallel to the diastolic and systolic ventricular border is constructed at the same distance from both borders. It is assumed that all the points move perpendicular to this line and the motion is analyzed using 100 equidistant lines drawn perpendicular to the centerline. The motion of each line is standardized according to the length of the end-diastolic perimeter and transformed into standard deviation units in relation to the normal reference population (Figure 6); thus, wall motion is quantified and can be compared between different regions of the heart and between different patients. In the right anterior oblique view, the territory irrigated by the left anterior descending artery lies between lines 10 to 66 and the territory irrigated by the right coronary artery between lines 51 to 80.27 The index of regional contractility, maximum unevenness, and hypokinetic area is calculated from the motion of these lines. The index of regional contractility of the culprit artery causing the infarction is calculated from the motion of 50% of the lines with the most depressed contractility located in the region of the culprit artery.

Figure 6. Centerline model: an artificial line parallel to the diastolic and systolic ventricular border is constructed at the same distance from both borders. This model assumes that all the points move perpendicular to this line and motion is analyzed via 100 equidistant lines drawn perpendicular to the centerline.
In the same way as general function is analyzed, regional function can be analyzed by exclusive use of the right anterior oblique view; the only drawback would be due to underestimating hypokinesia in cases of stenosis of the circumflex artery.30
Nuclear Cardiology
Nuclear medicine techniques aimed at analyzing ventricular function include first-pass radionuclide ventriculography, equilibrium radionuclide ventriculography,31 and tomographic acquisition methods (single-photon emission computed tomography [SPECT]).
First-pass radionuclide ventriculography involves quantified analysis of the detection of a radiotracer—after its intravenous injection in bolus—through the central circulation, cardiac cavities, and lungs during the first pass using a gamma camera. The most frequently used radionuclide is 99mTc in the form of the pertechnetate ion (99mTcO4), DTPA, MIBI, or tetrofosmin and that should be used at a high radioactive concentration. To quantify the LVF parameters, the selection of the cardiac cycles is made after the bolus has passed through the lungs. With a total of 4 to 9 cycles, the mean cardiac cycle is obtained where the LV area is drawn. It is essential to define the background area to subtract non-characteristic radioactivity from the ventricles. The LVEF is determined according to the end-diastolic and end-systolic activities of the representative cycle background corrected using the conventional formula: (net activity in enddiastole-net activity in end-systole/net activity in end-diastole) × 100.
Based on the average cycle, all the parameters derived from the ventricular volume curve can be calculated, wall motion in cine mode visualized or Fourier analysis applied to obtain the parametric images of the amplitude and phase of the selected ventricle. First-pass studies have low reproducibility compared to equilibrium studies due to the fact quality is performance-dependent and to the statistical error associated with the low count rate of the mean cardiac cycle.
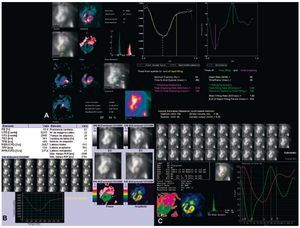
Ventriculography or equilibrium angiocardiography consists of studying the changes in activity emitted by a vascular radiotracer produced within the ventricles during the cardiac cycle. Any radioactive agent that does not spread beyond the vascular space can be employed. The most frequently used are red blood cells marked with 99mTc. Equilibrium is obtained after the marked red blood cells are homogenized with the remaining blood of the patient. After the images of the mean cardiac cycle have been consecutively presented and directly visualized (cine mode), the quantitative systolic and diastolic parameters are calculated and automatic or semiautomatic Fourier analysis performed (Figure 7). The LVEF is calculated using the formula already described. The correlation between radionuclide LVEF and that determined via cardiac catheterization is excellent and automatic analysis software programs obtain better observer and interobserver reproducibility than any other technique for the quantification of ventricular function.32

Figure 7. Calculation of left ventricular ejection fraction via equilibrium radionuclide ventriculography using different methods in a single patient. A: automatic system with initial area selection (GE ejection fraction), calculation of volumes and diastolic function parameters. B: automatic system with selection of the center of the left ventricle and calculation of diastolic function parameters (Siemens). C: totally automatic system with calculation of diastolic function (GE XT-ERNA).
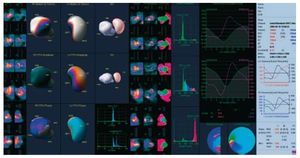
Gated-SPECT radionuclide ventriculography is performed using tomographic acquisition methods. The radioactive agents used are the same as those used for equilibrium radionuclide ventriculography. Quantitative parameters are automatically obtained after calculating the ventricular contours (Figure 8). As these calculation methods are automatic, reproducibility is very high, and any variability is due to the reconstruction process, where filtrate change, reorientation or amplification can affect subsequent calculations.

Figure 8. Calculation of left ventricular ejection fraction via gated-SPECT equilibrium radionuclide ventriculography (Cedar Sinai QBS), showing the three-dimensional images of both ventricles (left), Fourier analysis (range and phase) (center), and biventricular volume curves and quantitative systolic and diastolic parameters (right).
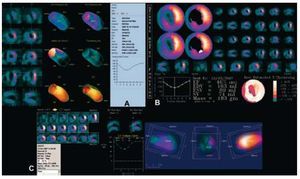
Gated myocardial perfusion SPECT makes it possible to obtain slices in the 3 cardiac axes, assess myocardial perfusion under stress and at rest, and qualitatively assess LVF. Technetium tracers are usually used (99mTc-MIBI or 99mTctetrofosmin), although the technique can also be performed with 201Tl. Several automated quantitative assessment methods are available for gated-SPECT. It should be pointed out that variability can arise when applying different methods to the same patient (Figure 9), and thus during patient follow-up the same methodology should always be adopted. Reproducibility with gated-SPECT is excellent. Finally, gated-PET offers qualitative and quantitative information on LVEF, wall motion and LV thickening. The same automatic quantification methodology is used in gated-PET studies as in gated-SPECT studies, but with the advantage that gated-PET has greater spatial and contrast resolution.33 The functional parameters that can be assessed in gated-PET studies are LVEF, ventricular volumes, and mass. In gated-PET studies, acquisition can be performed with perfusion tracers (13N ammonia, 15O water, 82Rb) and with metabolic tracers (18F fluorodeoxyglucose). The reproducibility of these studies is excellent.33

Figure 9. Methodology of the calculation of ejection fraction via gated myocardial perfusion SPECT in a single patient. A: Cedar Sinai QGS. B: Emory Cardiac Tool-box. C: 4DM-SPECT. Note the different results regarding ejection fraction (36%, 46%, and 40%, respectively) depending on the methodology used.
Multidetector Computed Tomography
Non-invasive coronary angiography can be performed using multidetector computed tomography (MDCT). Current technical limitations mean that candidate patients have to be selected mainly according to heart rate; a stable sinus rhythm and slow rates (<65 beat/min) are desirable to obtain good quality diagnostic images. Current MDCT 16-64 detector arrays visualize the main epicardial coronary arteries up to an approximate diameter of 1 mm. Temporal resolution is the greatest drawback of MDCT. Current arrays obtain a temporal resolution ranging from 150 ms to 210 ms, which are higher values than those of other techniques such as MRI (20-50 ms), and in any case are very far from that required to avoid motion artifacts in cardiac imaging (20 ms). The capacity of MDCT for synchronization enables obtaining a complete volumetric study of the heart during the cardiac cycle by appropriately postprocessing the data sets from several consecutive beats.34-36
Various quantification methods using MDCT have been described. Most of these systems are an extension of those already in use for MRI and that apply the Simpson method. Other systems have recently appeared that use growth algorithms for the target region, based on detecting contrast-enhanced blood within the ventricular cavity.
To calculate LVF parameters, the series chosen in the short-axis view are manually realigned based on the LV axes, or they can be realigned semi-automatically,36-38 and a series of slices in the short axis are generated (Figure 10). The first image is defined as the most basal image of the ventricle with more than 50% of the perimeter of the cavity covered by myocardium. Subsequently, all the consecutive images are included up to the last apical image that shows the ventricular cavity.34,36-38 The endocardial and epicardial borders of each image are outlined. The papillary muscles are included as a part of the cavity. Simpson's rule is then applied to the cavitary areas to obtain the volumes and then the beat volume and LVEF derived.

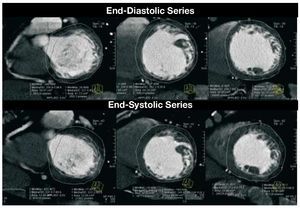
Figure 10. Composite images of 3 ventricular levels in short-axis view corresponding to the final phase of diastole (upper row) and systole (lower row), with delimited endocardiac and epicardiac borders to calculate parameters using the Simpson method. Images of a patient with ventricular dilatation and echocardiographic diagnosis of noncompaction cardiomyopathy with healthy coronary arteries, obtained by multidetector computed tomography.
Some of the drawbacks of the technique should be mentioned. Isovolumetric relaxation has an approximate duration of 40-60 ms. Minimum ventricular volume is maintained for 80-200 ms.34,35 The temporal resolution of MDCT (150-210 ms) is insufficient and includes data from the previous and later phases, which have higher volumes, and thus volume is overestimated. On the other hand, motion artifacts are more frequent during systole, hindering delimitation of the cavities. In patients with bradycardia, the maximum diastolic volume phase is maintained for a longer period and the temporal resolution comes closer to that needed to capture the volume. Furthermore, small variations in the choice of the first short-axis basal slice in MDCT can lead to significant changes in the calculation of functional parameters (up to 27 mL), since this is the slice that contains the greatest cavity area. Despite the limitations described, excellent correlation has been demonstrated between MDCT and MRI as well as acceptable concordance for all the usual LVF parameters.37
Pressure-Volume Curves
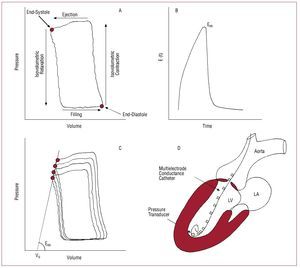
The most accurate approach to inherent LV pump properties is based on the analysis of pressure-volume curves (Figure 11).39 This methodology could not be extended to clinical practice until it became possible to instantly measure ventricular volume during the cardiac cycle. The events that take place during the cardiac cycle are represented through a phase diagram (Figure 11) that shows, following a anticlockwise pattern, the instantaneous pressure values (y axis) versus those of intraventricular volume (x axis; Figure 11A). In stable hemodynamic conditions, the pressure-volume (P-V) diagram repeats itself in a practically identical way from cycle to cycle, and the instantaneous relationship (quotient) between pressure and ventricular volume is known as elastance, which is expressed in mm Hg/mL. Thus, the function of the LV chamber is characterized by its time-dependent elastance function E(t) (Figure 11B), and the LV is interpreted as a variable pressure and volume pump, with the property of increasing its elastance very rapidly throughout systole. Surprisingly, the E(t) function follows a characteristic morphology that does not vary between different species of mammals or different diseases. Thus, the maximum elastance value at the end of systole (Emax or Ees) defines contractile capacity at the moment of maximum muscular activation and is a very precise parameter to define the systolic function of the LV chamber.

Figure 11. Building blocks for the measurement of left ventricular chamber function via pressure-volume curve analysis. A: pressure-volume diagram in a representative beat, with identification of the cardiac cycle phases. B: time-dependent LV elastance function E (t) shown for 1 heart beat. Its maximum value corresponds to elastance at end-systole (Ees). The morphology of this curve, once standardized to its maximum value, is uniform in all species of mammals and in healthy and ill subjects. C: a family of curves obtained during occlusion of the inferior vena cava. Ees is obtained as the angle of the straight line which links the isochronic end-systolic points. The value of its intercept for null pressure corresponds to V0. D: scheme of the high-fidelity pressure-conductance catheter system used to acquire pressure-volume curves in clinical practice.
In the P-V diagram the points in the upper left corner and lower right corner correspond to endsystole and end-diastole, respectively (Figure 11A). An intervention that may have an effect on loading conditions but that does not affect contractility (typically acute occlusion of the inferior vena cava) generates a family of curves whose isochronic end-systolic and end-diastolic points follow a well-defined trajectory. The end-systolic pressure-volume relationship (ESPVR) is constructed by connecting the end-systolic points of each cycle and follows a relatively linear pattern (Figure 11B); the angle of this straight line defines Ees, and the point where this value cuts the x-axis represents the volume at pressure zero (V0).40 Note that, given that Ees is defined based on acute maneuvers on ventricular filling, Ees is effectively insensitive to ventricular preload and postload conditions. This is a great advantage compared to other ejection phase indexes used to estimate LV systolic function, such as LVESV or LVEF, especially in situations in which preload or postload have extreme values.
The most typical way to obtain pressure-volume curves is by combined high fidelity pressure-conductance catheters that are retrogradely introduced into the LV via the aortic valve (Figure 11C). Acute reduction of preload is obtained by inflating a balloon catheter in the most proximal part of the inferior vena cava, and is maintained for around 10 s to avoid sympathetic reflexes that could alter contractility. Based on the family of curves obtained in this way, V0 and Emax are calculated in a postprocessing phase using a well-established iterative algorithm.41
The need for sensitive indexes to evaluate the result of new therapies in the area of heart failure has given rise to interest in P-V curves. Furthermore, in prognostic terms and as a guide to therapeutic action, the clinical efficacy of the parameters derived from P-V curve analysis has not been well established. For these reasons, P-V curve analysis is only currently used as surrogate endpoint in exploratory clinical trials and as a reference by which to compare new LVF indexes directed at clinical practice.41
TECHNIQUE OF CHOICE FOR THE ANALYSIS OF LEFT VENTRICULAR FUNCTION
When making decisions regarding which technique to use in the assessment of ventricular function in a clinical trial, the determining factor is the clinical context in which the research is going to take place. The next section presents the advantages and disadvantages of the different available techniques (Table 1) in the 3 clinical contexts in which the ejection fraction is most frequently used as a surrogate end-point, and the technique of choice is discussed (Table 2).


Available Evidence
Postrevascularization
Among the most important research challenges in this rapidly changing field are improvements in the efficacy of early reperfusion strategies, the development of treatment aimed at increasing myocardial resistance to ischemia, and the regeneration of microvascular and muscular tissue destroyed by necrosis. In this regard, the quantitative analysis of remodeling is an excellent tool for clinical research in this field. The parameters that have demonstrated a relationship with adverse remodeling include EF,42,43 LVESV,44 LVEDV,45 and the wall motion score index.46
Regarding the timing of the analysis of these parameters, although the recovery of ventricular function following myocardial stunning seems to be evident from day 14 after infarction,47 the pathogenic process of ventricular remodeling lasts for months,48 and hence it is advisable to conduct the comparative analysis well after the hospital phase. In the GISSI-3 substudy, the increase in LVEDV in the hospital phase was not a predictor of an increase at 6 months. On the contrary, the patients with greater deterioration in ventricular function during follow-up did not present, in general, an increase in LVEDV during hospitalization.
Regarding the technique to use, any advantages and disadvantages should be adapted to the type of study and the logistics involved. Magnetic resonance imaging and gated-SPECT are ideal techniques to measure small variations in ventricular function (making it possible to decrease the sample size and increase statistical power) and are irreplaceable if we wish to complement the study of ventricular function with the analysis of myocardial perfusion. Which one is used depends on availability. Echocardiography and ventriculography are the ideal techniques in multicenter studies, whenever the analyses are conducted in a single center. The advantage of the innocuousness of echocardiography is countered by the advantage of knowing the state of epicardial perfusion obtained by angiography and which contributes important information in studies that compare reperfusion strategies in infarction.
Cell Therapy
After the publication of the first results in animals49 and in humans,50,51 intermediate studies were begun using surrogate end-points to answer questions concerning the most suitable cell type, the form of administration, the time that should elapse after an acute event, and many others. Different surrogate end-points and different imaging techniques to measure them have been used in the cell therapy studies in humans. One study which provided positive results has been strongly questioned due to the use of angiography,52 a technique that involves many drawbacks for measuring LVEF.
As mentioned, sample size depends on the standard deviation of the surrogate end-point to be measured.11 This depends on variability in the laboratory where it is measured and the technique used. The higher the spatial and temporal resolution of a given technique, the smaller the variability, especially if quantification is automatic. It should be noted that variability in contrast echocardiography has been demonstrated as being similar to that of MRI when measuring LVEF,16 and so sample size is drastically reduced if contrast-enhanced echocardiography is employed. However, and despite there being no scientific evidence, most cell therapy researchers advise against the administration of contrast material during echocardiography due to the detrimental effect that contrast bubble destruction at the microvascular level may have on survival among transplanted cells.
Another key factor when designing a cell therapy study is the selection criteria. Thus, if the study is conducted in patients who have had acute myocardial infarction, it is essential to calculate infarct size, and measurements of the thickness and thickening of the infarcted wall can be a good surrogate end-point. If patients with depressed LVF are included, we should use imaging techniques that appropriately measure LVEF and ventricular volumes. Finally, if the study group consists of patients with angina resistant to therapy, imaging techniques should be employed that appropriately assesses myocardial perfusion.
Resynchronization
The benefit of cardiac resynchronization therapy has been found to be closely linked to increased LVEF or reduced left ventricular diameter and volume.53 Thus, demonstrating the reverse ventricular remodeling event is fundamental to research on cardiac resynchronization therapy, and the use of non-invasive imaging plays a key role when designing studies in this field.
The possibility of the overall assessment of structural, functional or hemodynamic changes of the heart undergoing biventricular stimulation currently makes echocardiography the technique of choice for research. However, in spite of the abundance of information on echocardiographic asynchrony parameters, preliminary results indicate that none of the echocardiographic measures in current and common use to detect mechanical asynchrony are able to improve the selection of candidates for such therapy.54
The use of MRI in the context of cardiac resynchronization has a serious drawback, since being fitted with a pacemaker or implantable cardioverter-defibrillator is a contraindication for its application,55 and this would hinder follow-up, although experimental studies with some modern pacemakers and defibrillators have demonstrated their compatibility with MRI.56
Multidetector computed tomography has a unique characteristic, and this is the possibility of assessing the suitability of the coronary venous anatomy for the implantation of the left ventricular lead in the site of latest mechanical LV activation.57 Thus, in patients where implantation is predicted to be difficult or impossible, epicardial lead implantation could be offered using a minimally invasive surgical approach.
There is little information on the usefulness of the different radionuclide techniques in the measurement of asynchrony. To this end, Fourier phase analysis of radionuclide ventriculography has been conducted, and higher correlation with mechanical asynchrony has been observed than with the QRS interval, with a potential impact on patient selection for cardiac resynchronization therapy.58
CONCLUSIONS
Given that none of the parameters of ventricular remodeling that have been used as surrogate endpoints have been demonstrated to be superior to any other, we propose establishing LVEF as the main surrogate endpoint in these types of studies, due to its universality in the scientific and clinical area and the fact that it is easily measured with widely available techniques.
Regarding revascularization studies, however, LVEF by itself does not provide additional information on the pathophysiological mechanisms associated with remodeling and ventricular dysfunction. In this sense, the development of new imaging techniques (MRI and gated-SPECT), together with the use of biochemical surrogate end-points (eg, neurohormones), make it possible to assess the myocardial and nonmyocardial event in greater depth. In our opinion, delayed enhancement MRI and gated-SPECT would be the ideal techniques. Ventriculography or contrast-enhanced echocardiography combined with the determination of biochemical markers could be another interesting option, especially in multicenter studies. The analysis of these parameters should be postponed between the third and sixth month, when ventricular remodeling is established.
Regarding clinical research on cell therapy, although no technique of choice can be proposed, gammagraphy and MRI stand out due to their capacity to assess different surrogate end-points. Although MRI has some theoretical advantages, the decision to use one technique or the other should probably depend on the experience of the clinical teams conducting the studies and on variability in the imaging unit during quantitative analysis.
Finally, in the area of resynchronization, MRI and MDCT would initially remain ruled out due to their incompatibility with the pacemakers and defibrillators that patients are often fitted with. Two-dimensional echocardiography (with the administration of contrast agents even with acceptable acoustic windows) is currently the most complete technique, while gated-SPECT continues to hold out great promise for the future in this field.
ACKNOWLEDGMENT
The authors would like to thank Berta Velasco for her dedication and excellent secretarial work in the preparation of this article.
This study was partly financed by the Red de Enfermedades Cardiovasculares (RECAVA) of the Instituto de Salud Carlos III.
ABBREVIATIONS
LV: left ventricle
LVEDV: left ventricular end-diastolic volume
LVEF: left ventricular ejection fraction
LVESV: left ventricular end-systolic volume
LVF: left ventricular function
MRI: magnetic resonance imaging
MDCT: multidetector computed tomography
Correspondence: Dr. J.A. San Román.
Servicio de Cardiología. Hospital Clínico Universitario. Avda. Ramón y Cajal, 3. 47005 Valladolid. España.
E-mail: asanroman@secardiologia.es