Red blood cell distribution width has emerged as a new prognostic biomarker in cardiovascular diseases. Its additional value in risk stratification of patients with chronic heart failure has not yet been established.
MethodsA total of 698 consecutive outpatients with chronic heart failure were studied (median age 71 years [interquartile range, 62-77], 63% male, left ventricular ejection fraction 40 [14]%). On inclusion, the red cell distribution width was measured and clinical, biochemical, and echocardiographic variables were recorded. The median follow-up period was 2.5 years [interquartile range, 1.2-3.7].
ResultsA total of 211 patients died and 206 required hospitalization for decompensated heart failure. Kaplan-Meier analysis showed an increase in the probability of death and hospitalization for heart failure with red cell distribution width quartiles (log rank, P<.001). A ROC analysis identified a red cell distribution width of 15.4% as the optimal cut-off point for a significantly higher risk of death (P<.001; hazard ratio=2.63; 95% confidence interval, 2.01-3.45) and hospitalization for heart failure (P<.001; hazard ratio=2.37; 95% confidence interval, 1.80-3.13). This predictive value was independent of other covariates, and regardless of the presence or not of anaemia. Importantly, the addition of red cell distribution width to the clinical risk model for the prediction of death or hospitalization for heart failure at 1 year had a significant integrated discrimination improvement of 33% (P<.001) and a net reclassification improvement of 10.3% (P=.001).
ConclusionsRed cell distribution width is an independent risk marker and adds prognostic information in outpatients with chronic heart failure. These findings suggest that this biological measurement should be included in the management of these patients.
Keywords
.
IntroductionThe red cell distribution width (RDW) describes the degree of heterogeneity in the size of red blood cells, and both their destruction and decreased production increase its value.1, 2 This parameter was introduced as an aid to differential diagnosis of hypochromic anemias. However, several recent studies have shown its association with increased mortality in patients with heart failure (HF),3, 4, 5, 6, 7, 8 as well as in other chronic diseases and even population cohort studies.9 The mechanisms involved in this association are not well clarified, although it has been suggested that inflammation and nutritional deficiencies, especially in iron metabolism, involve an increased RDW.10.
Only 2 studies have assessed its prognostic value in outpatient populations with chronic HF,3, 4 only one of which specifically studied its association with the risk of hospitalization for HF decompensation.3 Beyond its association with total mortality, the relationship between high RDW values and the risk of hospitalization for HF is of particular interest because we know that RDW is related to HF progression and that its clinical management has great social and public health impact, which has led to specific prevention measures such as creating HF units. Although RDW has shown a prognostic value independent of other variables, no previous study had assessed whether RDW provides additional information on other clinical variables and would therefore need to be taken into account in normal practice beyond the other clinical risk markers..
The RDW is a simple and widely available marker, and the aim of this study was to determine if it identifies a higher risk of both mortality and hospitalization for decompensated HF in a large population of outpatients with chronic HF, and if its predictive value was in addition to other clinical variables..
Methods PopulationA total of 698 consecutive outpatients were studied in a specialist HF consultation unit from January 2003 to December 2005. All demographic, clinical, and laboratory data for each patient was recorded during the visit. All patients had undergone echocardiography in the previous 3 months (Sonos 5500, Philips, Massachusetts, United States), and the measurements and recommendations were recorded.11 Patient follow-up was by outpatient visits, phone calls, medical records review, and national mortality records if required. The study was approved by the hospital ethics committee and all patients gave informed written consent. The adverse events studied were death and hospitalization due to decompensated HF. There were no losses to follow-up, and the study database was closed in May 2008. All patients were followed up at least 1 year later, with a final median follow-up of 2.5 years (interquartile range, 1.2-3.7 years). The STROBE recommendations for the design of observational studies were followed.12.
Laboratory TestsThe blood samples analyzed were obtained at the initial visit, after fasting and 10min of rest, and were processed immediately after extraction. All hematological parameters were determined using the XE-2100 automatic analyzer (Sysmex, Kobe, Japan) and all biochemical parameters using the PE modular analyzer (Roche Diagnostics, Manheim, Germany). Anemia was defined according to the World Health Organization criteria: hemoglobin <13g/dL for men and <12g/dL for women.13 Renal function data were estimated from the calculation of the glomerular filtration rate (GFR, in mL/min/1.73m2) using the Modification of Diet in Renal Disease formula.14.
Statistical AnalysisThe normal distribution of continuous variables was evaluated with the Kolmogorov-Smirnov test. Normal distribution data were expressed as mean (Standard deviation), while non-normal distribution data were expressed as median [interquartile range]. Categorical variables were expressed as percentages. The RDW differences across quartiles were assessed by the linear trend in the chi-square and ANOVA tests, as appropriate. Cumulative mortality was estimated using the Kaplan-Meier method, with the log rank test used for comparisons. The hazard ratio (HR) was calculated for each variable studied, derived from the Cox regression analysis to identify the separate factors predicting the occurrence of death and admission for HF during follow-up. The receiver-operator analysis was used to define the optimal cut-off value for the RDW in predicting events, defined as that maximizing the sum of sensitivity and specificity. To study the predictive value added by the RDW, a model (enter method) was constructed, with all the event predictor variables except RDW entered in the univariate analysis (P<.05). Secondly, the RDW was added to study the increase in the chi-square value in the model and the associated risk. The multivariate models were adjusted for potential confounding variables that showed a significant association with RDW quartiles (Table 1). This analysis was performed for the overall population and specifically for the subgroup of patients with and without anemia. In addition, to better study the value added by the RDW in risk discrimination, the improvement in the predictability of events at 1 year was studied by analyzing the integrated discrimination improvement and the net reclassification improvement (low [<15%], intermediate [15%-50%] and high [>50%]), as defined by Pencina et al.15, 16 Statistical significance was set at P<.05. Statistical analysis was performed using the SPSS version 18.0 for Windows (SPSS Inc., Chicago, Illinois, United States)..
Table 1. Baseline Characteristics of the Population by Red Cell Distribution Width Quartiles.
| Quartile 1 (n=183) | Quartile 2 (n=173) | Quartile 3 (n=175) | Quartile 4 (n=167) | P | |
| Age, years | 69 [56-77] | 70 [60-77] | 72 [65-78] | 72 [67-78] | .009 |
| Males | 132 (72) | 105 (61) | 111 (63) | 90 (54) | .001 |
| Diabetes mellitus | 84 (46) | 68 (39) | 66 (38) | 77 (46) | .903 |
| Hypertension | 103 (56) | 103 (59) | 118 (67) | 117 (70) | .003 |
| BMI, kg/m2 | 29 [26-31] | 27 [25-30] | 28 [26-31] | 27 [25-31] | .208 |
| NYHA III/IV | 46 (31) | 42 (27) | 60 (45) | 59 (50) | <.001 |
| COPD | 26 (14) | 33 (19) | 45 (26) | 40 (24) | .008 |
| Previous stroke | 23 (13) | 21 (12) | 17 (10) | 24 (14) | .812 |
| Ischemic aetiology | 88 (48) | 85 (49) | 80 (46) | 70 (42) | .201 |
| Atrial fibrillation | 52 (28) | 53 (31) | 64 (37) | 75 (45) | .001 |
| LBBB | 49 (27) | 53 (31) | 58 (33) | 64 (38) | .017 |
| Anemia | 52 (28) | 59 (34) | 82 (47) | 104 (62) | <.001 |
| Hemoglobin, g/dL | 13.57±1.70 | 13.21±1.80 | 12.80±1.85 | 11.93±1.89 | <.001 |
| MCV, fL | 90 [88-93] | 89 [87-93] | 89 [85-92] | 86 [83-91] | <.001 |
| Creatinine, mg/dL | 1.12 [0.92-1.50] | 1.10 [0.93-1.30] | 1.18 [0.93-1.50] | 1.30 [1.00-1.80] | .001 |
| GFR, mL/min/1.73m2 | 65 [52-77] | 62 [48-76] | 61 [46-76] | 54 [40-68] | <.001 |
| Urine nitrogen, mg/dL | 46 [36-62] | 47 [36-60] | 49 [36-69] | 55 [41-80] | .001 |
| Sodium, mEq/L | 138 [136-141] | 138 [136-139] | 138 [135-141] | 138 [135-140] | .724 |
| Uric acid, mg/dL | 7.2 [5.9-8.7] | 7 [5.5-8.9] | 7.2 [5.9-8.9] | 7.9 [6.5-9.7] | .019 |
| Albumin, g/dL | 3.8 [3.5-4.1] | 3.7 [3.4-3.9] | 3.8 [3.5-4.1] | 3.8 [3.4-4.2] | .150 |
| Total protein, g/dL | 6.57±0.80 | 6.48±0.57 | 6.60±0.69 | 6.60±0.86 | .744 |
| CRP, mg/dL | 0.4 [0.2-2.3] | 0.5 [0.2-1.6] | 0.6 [0.2-1.4] | 0.8 [0.3-3.7] | .354 |
| Cholesterol, mg/dL | 170 [145-199] | 161 [143-188] | 161 [138-189] | 149 [122-189] | .004 |
| LVEF, | 40 [30-50] | 37 [30-48] | 40 [30-53] | 40 [30-56] | .377 |
| LVEDD, mm | 57 [49-61] | 56 [50-66] | 55 [47-62] | 53 [46-58] | .146 |
| Left atrium, mm | 44 [40-49] | 45 [40-51] | 45 [40-52] | 48 [44-56] | .011 |
| Medication | |||||
| Antiplatelets | 119 (65) | 108 (62) | 102 (59) | 96 (58) | .108 |
| Anticoagulants | 65 (35) | 62 (36) | 69 (40) | 80 (48) | .016 |
| Beta-blockers | 111 (61) | 114 (66) | 99 (57) | 80 (48) | .006 |
| ACEI/ARB | 160 (87) | 147 (85) | 147 (84) | 127 (76) | .007 |
| Loop diuretics | 132 (72) | 123 (71) | 132 (76) | 138 (83) | .017 |
| Aldosterone antagonists | 52 (28) | 47 (27) | 49 (28) | 50 (30) | .733 |
ACEI, angiotensin-converting enzyme inhibitor; ARB, angiotensin receptor blockers; BMI, body mass index; COPD, chronic obstructive pulmonary disease; CRP, C-reactive protein; GFR, glomerular filtration rate; LBBB, left bundle branch block; LVEDD, left ventricular end-diastolic diameter; LVEF, left ventricular ejection fraction; MCV, mean corpuscular volume; NYHA, New York Heart Association.
Qualitative variables are expressed as percentages and quantitative variables as mean±standard deviation or median [interquartile range].
A total of 698 patients (median age 71 years [62-77]; 63% male; left ventricular ejection fraction, 40 [14]%) were studied, where the median RDW value was 14.8% [13.8-16]. Table 1 describes the population features distributed by RDW quartiles. The RDW value is directly associated with age, New York Heart Association functional class, greater prevalence of female sex, hypertension, chronic obstructive bronchial disease, atrial fibrillation, and left bundle branch block. In addition, there was an association between RDW and impaired renal function parameters: a reduced glomerular filtration rate and higher concentrations of creatinine, urea nitrogen, and uric acid. Cholesterol levels decreased with increasing RDW, but plasma proteins and body mass index showed no differences. As expected for hematological parameters, increased RDW was associated with increased prevalence of anemia, lower hemoglobin and lower mean corpuscular volume. Echocardiography data showed an association with left atrial dilation, with no association with ischemic etiology or the degree of systolic dysfunction in terms of ejection fraction or left ventricular end-diastolic diameter. At the therapeutic level, the use of anticoagulation and loop diuretics was higher, while the rate of beta blockers and angiotensin-converting enzyme inhibitors or angiotensin receptor blockers was lower..
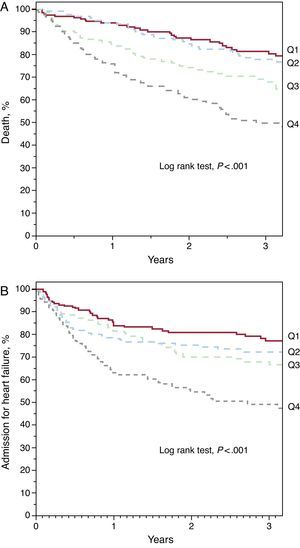
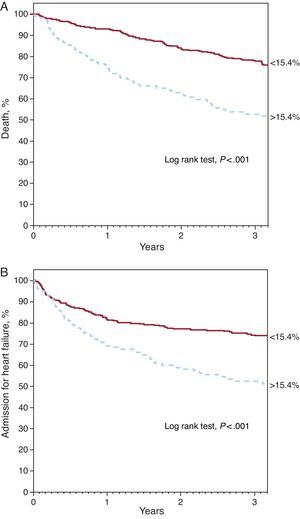
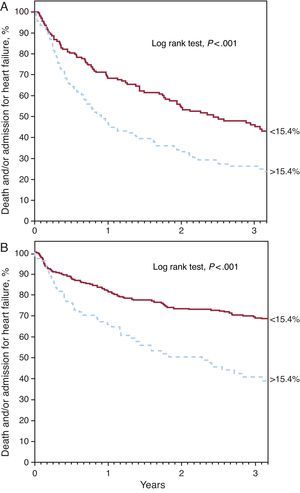
Red Cell Distribution Width and PrognosisDuring the median follow-up period of 2.5 years [1.2-3.7], 211 patients died and 206 required hospitalization for decompensated HF. Kaplan-Meier survival analysis showed an increase in both mortality and admission for heart failure across the RDW quartiles (Figure 1) (log rank test, P<.001 for both events). Analysis by quartiles also showed an increased risk compared to the first quartile (Table 2). The ROC analysis showed an area of 0.64 (95% confidence interval [95%CI], 0.61-0.67) for death and 0.59 (95%CI, 0.55-0.64, P<.001) for hospitalization for HF. The best cut-off value was 15.4% for both analyses, which separated 2 groups of patients with a significantly different evolution in the Kaplan-Meier analysis (Figure 2) (log rank test, P<.001). A RDW>15.4% was associated with an almost 3-fold increase in the risk for both events (Table 2). In addition, the RDW maintained its predictive value for both the presence and absence of anemia. Both anemic patients and nonanemic patients showed increased risk of death (per unit [%]; HR=1.163; 95%CI, 1.086-1.245; P<.001 and per unit [%]; HR=1.319; 95%CI, 1.174-1.463; P<.001, respectively) and admission for HF (per unit [%]; HR=1.167; 95%CI, 1.076-1.266; P<.001 and per unit [%]; HR=1.307; 95%CI, 1.158-1.477, P<.001, respectively). Figure 3 shows the probability of occurrence of the composite end point of death and/or hospitalization for HF, considering a value of RDW>15.4%, separately in patients with and without anemia (log rank test P<.001 for both groups)..

Figure 1. Kaplan-Meier curves for survival free of death (A) and hospitalization for heart failure (B) according to red cell distribution width quartiles (Q): Q1 (<13.8%), Q2 (13.8%-14.8%), Q3 (14.8%-16%), Q4 (>16%).
Table 2. Association Between the Value of Red Cell Distribution Width and Adverse Events in the Cox Hazard Analysis.
| Death | Admission for heart failure | |||
| HR (95%CI) | P | HR (95%CI) | P | |
| RDW, per 1% | 1.26 (1.19-1.33) | <.001 | 1.25 (1.18-1.33) | <.001 |
| RDW, quartiles | <.001 | <.001 | ||
| Q1 <13.8 | 1 | − | 1 | − |
| Q2 13.8-14.8 | 1.31 (0.83-2.06) | .246 | 1.32 (0.86-0.02) | .204 |
| Q3 14.8-16 | 2.05 (1.33-3.16) | .001 | 1.55 (1.02-2.37) | .040 |
| Q4 >16 | 3.47 (2.29-3.16) | <.001 | 2.72 (1.83-4.05) | <.001 |
| RDW>15.4% | 2.63 (2.01-3.45) | <.001 | 2.37 (1.80-3.13) | <.001 |
95%CI, 95% confidence interval; HR, hazard ratio; RDW, red cell distribution width.

Figure 2. Kaplan-Meier curves for survival free of death (A) and hospitalization for heart failure (B) according to red cell distribution width value above and below 15.4%.

Figure 3. Kaplan-Meier curves for survival free of the combined event of death and/or hospitalization for heart failure, according to red cell distribution width value above and below 15.4% in patients with anemia (A) and without anemia (B).
Additional Prognostic Value of Red Cell Distribution WidthTable 3 shows the variables significantly associated with an increased risk of death and admission for HF included in the clinical risk model. After taking into account the multivariate model, except for RDW, the inclusion in the final step of RDW was associated with a significant improvement in the predictive power of the model for both mortality and admission for HF (Table 4). In addition, an analysis was performed after 1 year to find out if RDW was associated with a further improvement in the discrimination of events. A total of 212 patients (31%) had died or been hospitalized for HF at the end of the first year of follow-up. Considering that an RDW value of 15.4% as a dichotomous variable was associated with a significant integrated discrimination improvement of 33% (P<.001) and net reclassification improvement of 10.3% (P=.001), due to better identification of patients with events (6.7%, P=.020) and without events (3.6%, P=.015). When considering only death as an adverse event (n=89), the net reclassification improvement was 15.5% (P=.006), due mainly to the better identification of events (13.8%, P=.011). However, when the event studied was hospital admission for HF (n=123), the improvement was 4.6% (P=.022), thanks to improved identification of patients without events (4%, P=.001)..
Table 3. Clinical Predictors of Adverse Events in Univariate Cox Risk.
| All-cause mortality | Admission for heart failure | |||
| HR (95%CI) | P | HR (95%CI) | P | |
| NYHA class III/IV | 2.669 (1.970-3.602) | <.001 | 2.378 (1.708-3.311) | <.001 |
| Age, years | 1.036 (1.023-1.050) | <.001 | 1.028 (1.015-1.040) | <.001 |
| Haemoglobin, g/dL | 0.730 (0.677-0.787) | <.001 | 0.747 (0.690-0.809) | .001 |
| GFR, mL/min/1.732 | 0.983 (0.977-0.990) | <.001 | 0.990 (0.984-0.996) | .002 |
| Beta-blockers | 0.576 (0.440-0.755) | <.001 | 0.696 (0.529-0.916) | .010 |
| Previous stroke | 1.748 (1.209-2.526) | .003 | 1.475 (0.969-2.245) | .070 |
| COPD | 1.415 (1.039-1.929) | .028 | 1.313 (0.954-1.808) | .095 |
| Males | 0.760 (0.577-1.001) | .051 | 0.721 (0.544-0.956) | .023 |
| Hypertension | 1.245 (0.938-1.654) | .130 | 1.657 (1.233-2.227) | .001 |
| Atrial fibrillation | 1.213 (0.914-1.610) | .182 | 1.729 (1.304-2.213) | <.001 |
| LVEF, % | 0.995 (0.985-1.005) | .323 | 1.015 (1.005-1.026) | .004 |
| Ischaemic aetiology | 0.892 (0.680-1.170) | .410 | 0.724 (0.548-0.956) | .023 |
| Diabetes mellitus | 1.100 (0.838-1.445) | .493 | 1.595 (1.213-2.097) | .001 |
95%CI, 95% confidence interval; COPD, chronic obstructive pulmonary disease; GFR, glomerular filtration rate; HR, hazard ratio; LVEF, left ventricular ejection fraction; NYHA, New York Heart Association.
The other variables studied did not reach statistical significance of P>.10: body mass index, left bundle branch block, urea nitrogen, sodium, uric acid, albumin, total protein, cholesterol, left atrial diameter, and treatment with antiplatelet agents, anticoagulants, angiotensin-converting enzyme inhibitors/angiotensin receptor blockers and loop diuretics.
Table 4. Additional Prognostic Value of Erythrocyte Distribution Width on the Best Clinical Prognosis Model in the Cox Proportional Hazard Analysis.
| Death | Admission for heart failure | |||||
| Chi-square | P | HR (95%CI) | Chi-square | P | HR (95%CI) | |
| Clinical model | 136 | 57 | ||||
| + RDW, per 1% | 158 | <.001 | 1.15 (1.07-1.22) | 72 | <.001 | 1.13 (1.06-1.21) |
| + RDW>15.4% | 155 | <.001 | 1.81 (1.38-2.42) | 67 | .003 | 1.56 (1.16-2.09) |
95%CI, 95% confidence interval; HR, hazard ratio; RDW, red cell distribution width.
The variables included in the clinical model were predictors in the univariate analysis ( Table 2 ) as well as potential confounders ( Table 1 ).
In a large population of outpatients with chronic HF, the increased value of RDW was significantly associated with a worse outcome, for both mortality and hospitalization for decompensated HF. Beyond this, RDW behaved as a predictive factor capable of providing information in addition to that of other clinical risk variables..
Since Felker et al. identified RDW as the most predictive laboratory marker in the CHARM study population,3 this simple biological measurement has gained importance as a risk marker. After this first description, our group and others have contributed to the knowledge by showing that it has prognostic value for populations hospitalized with acute HF.5, 6, 7 This predictive value is not unique to patients with HF, but has also recently been described in the general population9, 17 and in other populations with vascular diseases, such as coronary heart,18, 19, 20, 21 peripheral vascular,22 cerebrovascular,23 and pulmonary artery disease.24 After the initial description by Felker et al. for outpatients with HF,3 Allen et al.4 found that the predictive value of a high RDW persists after adjustment for other predictors in a registry of patients with chronic HF. Our study confirms RDW as an independent risk marker in outpatients with HF and, compared to these other two studies, our results show that a high RDW value provides additional prognostic information for other clinical variables. This improves the ability to discriminate between patients and reclassify them into risk categories. As regards clinical practice, this result means that, after assessing a patient during a visit, looking at the RDW value in the hemogram can improve the risk assessment..
Also important in our study was that RDW was able to predict both mortality and hospitalization due to HF decompensation. This is important because, while all-cause mortality is a complex phenomenon with underlying etiologic mechanisms that are often not modifiable, hospitalization due to decompensated HF is closely related to the evolution of disease, yielding higher costs and worse clinical outcome, but which can be modified by preventive strategies. The subanalysis of CHARM3 identified an increased risk for the composite event of death from any cause and hospitalization for HF, but did not evaluate the latter separately. Allen et al.4 evaluated hospitalization for any cause in the STAMINA-HFP registry, but did not do so specifically for HF, and neither did the other studies of acute HF. In patients with chronic coronary disease referred for coronary angiography without HF, Tonelli et al.19 and Horne et al.21 found an association between RDW and the appearance of symptomatic HF de novo or hospitalization for HF, respectively, in the follow-up. This association is strengthened by Borné et al.,25 a population cohort study which also found an association between RDW and the first hospitalization for HF. In our study, high RDW was a marker for increased risk of HF decompensation requiring hospitalization. Together with other studies, this suggests that RDW may be a good predictor for greater clinical instability and risk of decompensation requiring hospitalization..
The mechanisms underlying the association between RDW and worse outcomes are not fully understood. This study is consistent with other previous studies showing that the predictive value of RDW is independent of hemoglobin or anemia.3, 4, 5 However, this independence does not mean that the mechanisms are different, as increased RDW has been repeatedly associated with increased inflammation and impaired iron metabolism.4, 26, 27 Both aspects are also involved in the appearance of anemia; in fact, it has recently been shown that RDW predicts the development of anemia in the medium term.28 This suggests that RDW shows an increased activation of these disease mechanisms and predicts a worse outcome in both the early pre-anemia stage and later in life when it is already established, thereby adding prognostic value to both subpopulations. Supporting this hypothesis are the findings of Jankowska et al., who recently found a high prevalence of iron deficiency (functional and absolute) in patients with chronic HF with or without anemia, which was associated with a worse prognosis regardless of the presence of anemia.29 In turn, this impairment of erythropoiesis and the underlying mechanisms are reflected in increased myocardial damage, as shown by its association with cardiac troponin elevation.30 It remains to be established whether the attractive idea of treating high RDW and iron deficiency patients with hemoglobin within normal limits has an impact on the subsequent development of anemia and/or the clinical evolution of these patients..
These findings suggest that RDW is a consistent risk marker for patients with HF and should be considered in clinical practice, especially given its accessibility and low cost. In various analyses, RDW has been quantitatively related to the risk of events per unit (%) increase in value, with a stronger association at higher values. The average RDW of events in the population in the CHARM analysis3 was 15.2%, and the increased risk was significant in the top quintile with a value of >15.3% in its validation in the Duke registry. In the Allen et al. validation,4 patients with RDW≥15.5% showed significantly reduced survival and worse prognosis. In our analysis, values above 15.4% had the best predictive capability and were associated with nearly triple the risk for both death and hospitalization for HF, as well as improvement in discrimination and reclassification for these events. This cutoff value of 15.0% to 15.5% might therefore be considered the reference for risk stratification in outpatients, given that the association between RDW and risk is incremental..
LimitationsLimitations of this study are its single-center character, which makes extrapolation of the results difficult. However, the population was obtained consecutively from general HF visits and its features show no significant selection bias. Another significant limitation is the lack of adjustment for other risk factors, especially natriuretic peptides and ferrokinetic parameters. However, the peptides are not yet widely available and previous studies have shown that the RDW value is independent and additive to them.6, 7 Given the relationship between RDW and ferrokinetics, the study of absolute or functional iron deficiency could have led to a better analysis of the pathophysiological relationship between RDW and prognosis. Likewise, obtaining serial repeated measurements could have allowed an assessment of RDW value changes over time..
ConclusionsThis study shows that the RDW value is an added risk marker for the occurrence of both death and hospitalization for HF in outpatients with chronic HF. This allows improved risk discrimination, independently of other variables and the presence or absence of anemia. Therefore, it is advisable to include it in both risk models and prognosis stratification in clinical practice, with a value of 15.4% suggested as a reference for decision making..
Conflicts of interestNone declared..
Received 14 September 2011
Accepted 11 December 2011
Corresponding author: Servicio de Cardiología, Hospital Universitario Virgen de la Arrixaca, Ctra. Madrid-Cartagena s/n, 30120 El Palmar, Murcia, Spain. DomingoA.Pascual@carm.es