Keywords
INTRODUCTION
In recent years the study of myocardial perfusion and left ventricle function through single photon emission computed tomography (gated-SPECT) has become a routine procedure for the evaluation of patients in follow-up or with suspicion of ischemic heart disease.1,2
Radiotracers labeled with technetium enable image acquisition synchronized with the electrocardiogram (ECG), thus facilitating the simultaneous evaluation of ventricular volume, global systolic function and myocardial perfusion. The joint evaluation of the level of myocardial uptake and ventricular wall motion contributes to higher specificity with perfusion SPECT in the diagnosis of coronary heart disease, facilitates the detection of viable myocardium, and improves the capacity for risk stratification in patients who have suffered a myocardial infarction.3-8
In order to obtain quantitative parameters representative of ventricular function, we need methods that recognize the endocardial and epicardial outlines of the left ventricle to delimit volume variations during the cardiac cycle. There are several computer programs for calculating the volume and ejection fraction (EF) of the left ventricle.9-15 Various studies have analyzed the precision of the parameters obtained through gated-SPECT and their accuracy compared to the results obtained with other conventional techniques, such as equilibrium radionuclide ventriculography (RNV), first-pass radionuclide ventriculography, echocardiography, magnetic resonance imaging, and contrast angiography.16-31
This study was designed as a prospective trial with 99mTc-tetrofosmin in subjects with known or suspected ischemic heart disease, upon referral to a myocardial perfusion study. The aim was to evaluate the interobserver and interassay reproducibility of gated-SPECT in the calculation of EF and left ventricle volumes and compare its results with those obtained with blood pool radionuclide ventriculography.
PATIENTS AND METHODS
An open prospective study was designed for 2 nuclear cardiology units, evaluated by blinded independent observers, to assess the reproducibility of the quantitative parameters of left ventricular function: EF and ventricular volumes obtained with gated-SPECT and comparison with the EF values obtained with blood pool radionuclide ventriculography. The protocol was approved by the ethical committees of the 2 participating centers and the Agencia Española del Medicamento (Spanish Drug Agency).
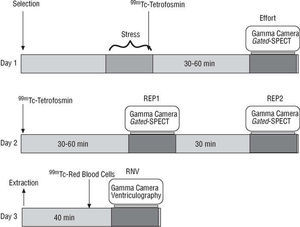
Exploratory Sequence (Figure 1)

Fig. 1. Protocol development scheme. A long protocol was used with an exercise stress test and tomographic detection on the first day. On the second day, after administration of a dose of 99mTc-tetrofosmin, 2 gated-SPECTs were done with an interval of 30 min between the 2, during which the patient rested beyond the range of the gamma camera. On the third day, radionuclide ventriculography was done after labeling the autologous red blood cells. Gated-SPECT indicates single photon emission computed tomography synchronized with electrocardiogram; REP1, first resting gated-SPECT study; REP2, second resting gated-SPECT study; RNV, equilibrium radionuclide ventriculography.
Day 1: a post-exercise study that included an exercise stress test and a gated-SPECT study (dose 800 MBq).
Day 2: gated-SPECT approximately 30 min after injection of 800 MBq 99mTc-tetrofosmin at rest (REP1). The patient returned to the waiting room and 1 hour later a new gated-SPECT was carried out without the dose (REP2).
Day 3: RNV, at a maximum interval of 10 days.
Population
Patients with suspected ischemic heart disease or with confirmed coronary disease were included. They had been referred by their cardiologist to a myocardial perfusion study. The characteristics of the population are presented in Table 1. Patients were only included after having obtained informed written consent.
Exercise Stress Test
An exercise stress test restricted by symptoms was done with an ergometric bicycle with an initial workload of 50 W increasing stepwise by 25 W every 3 min.
The test was interrupted if the patient presented symptoms that prevented him/her from continuing the effort (angina, dizziness, dyspnea, or muscular fatigue), decrease in systolic blood pressure or ST segment depression greater than 2 mm.
Patients who could not reach an accelerated heart rate upon effort equal to or higher than 80% of the theoretical maximum frequency for their age, without angina, with negative ECG and without medical contraindication, were given 0.56 mg/kg of intravenous dipyridamole over 4 min, while the ergometric test was maintained at the maximum workload the patient could tolerate The radioactive drug was given 4 min after ending dipyridamole infusion.
Gated-SPECT
The following gamma cameras and computer equipment were used:
Center 1: gamma camera: Siemens dual-head ECAM 90°; software: ICON.
Center 2: gamma camera: ADAC dual-head Vertex bonus; software: PEGASIS.
The following acquisition parameters were used to obtain conventional images: energy window: 15%, symmetric around 140 KeV; collimator: low energy, high resolution, 180° non-circular orbit with 64 stops, step-and-shoot mode, 20 s per projection from left posterior oblique 45° to right anterior oblique 45°.
Ungated reconstruction was carried out with filtered backprojection, using a Butterworth filter, order 5, cut-off frequency 0.5, without attenuation correction. The synchronized images were reconstructed with the same type of filter with a cut-off frequency 0.4.
Each processing included reconstruction and reorientation of the stops and measurement of the ventricular function through the automatic QGS software10 to obtain left ventricle EF values and ventricular volumes in the REP1 and REP2 studies.
Equilibrium Radionuclide Ventriculography
The following gamma cameras and computer equipment were used:
Center 1: Elscint GE SP4 gamma camera.
Center 2: Orbiter gamma camera.
Both instruments were provided with a low energy, general purpose collimator. Energy window, 20%. Thirty-two images were acquired per cycle up to a total of 8 million.
All studies were processed on an SP1 computer with an automatic program for delimiting ventricular outline and the generation of background areas previously validated for obtaining EF.32
Evaluation
The REP1 and REP2 studies for each patient were randomly coded separately (numerical allocation with a computer program). Two specialists in nuclear medicine with long experience in nuclear cardiology, and without knowledge of the results of either study, randomly reprocessed each gated-SPECT. Interassay variability was obtained by comparing the results of REP1 and REP2. Interobservador variability was analyzed via the results obtained by processing REP1 a second time. Equilibrium blood pool radionuclide ventriculography was evaluated by an independent expert.
Each gated-SPECT was visually analyzed for the global quality of the images and myocardial uptake of the segment. End-diastolic volume (EDV), end-systolic volume (ESV), and left ventricle EF were obtained with QGS software.10
Statistical Analysis
The results are expressed as mean ± standard deviation. Variability between the different measurements was expressed in absolute values by calculating the mean difference between pairs of values and their standard deviation.33 Ejection fraction and volumes were compared with Pearson's product moment correlation coefficient (r) and the standard error of the estimation. Significance was obtained through Fisher's z transformation. The Bland-Altman plot was used to assess the systematic differences between the comparative series of paired results,34 showing the scatter of the differences between the pairs of values regarding the line of equality. Confidence intervals (95% CI) were obtained for the correlation and Bland-Altman analysis. Student's t test was used for paired data to compare the values of the groups studied. A P<.05 was considered statistically significant. Data was processed with SPSS 10.0. statistical software.
RESULTS
Gated-SPECT, REP1, and REP2 were done in 55 patients (37 males; mean age, 61.3 years), and RNV in 49 patients. Fifty percent of the patients were referred to the unit for diagnosis and the other 50% for prognosis.
No adverse effect occurred during the trial. No study was discarded due to poor image quality because all the gated-SPECT and the ventriculography studies were classified as good or very good quality.
The clinical characteristics of the population studied are presented in Table 1. In 19 (32.2%) patients defects were observed in the anteroseptal region (12 total or partially reversible, 7 irreversible), 5 patients (8.5%) presented defects in the lateral region (4 total or partially reversible, 1 non-reversible), and 22 (37.3%) presented them in the lower region (10 total or partially reversible and 12 non-reversible).

Interobserver Reproducibility
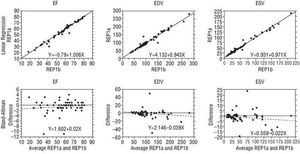
The results obtained from processing the REP1 studies twice are shown in Table 2. The mean variability was 0.5±2.6 points for EF. Mean variability was 1.9±10.7 ml for EDV and 0.5±5.4 ml for ESV. Figure 2 shows the correlation for each of the 3 variables analyzed. The correlation coefficient between the 2 measurements for EF was 0.99 (95% CI, 0.98-0.90), without noteworthy biases in the high or low values of the series in the Bland-Altman analysis with a standard error of the estimations of 2.56%. For EDV, variability was 1.9±10.7 mL and the correlation coefficient was 0.98 (95% CI, 0.97-0.99). For ESV variability was 0.5±5.4 mL (r=0.99; 95% CI, 0.99-1), without systematic biases in the distribution of the differences (standard error, 10.61 mL and 5.4 mL, respectively).


Fig. 2. Interobserver reproducibility. Upper row: the regression values of the ejection fraction (EF), end-diastolic volume (EDV), and end-systolic volume (ESV) obtained by observer A (REP1a) and those obtained by observer B (REP1b). Lower row: analysis of the Bland-Altman scatter plot showing the differences obtained by the 2 observers over the range of the average values.
Interassay Reproducibility
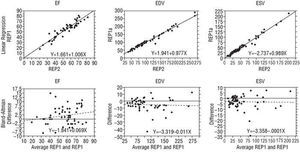
The mean values of the EF obtained in REP1 and REP2 was 56.5%±15 and 54.5%±14 (P=NS), respectively. Mean variability was 2±5.1 points for EF (Table 3). For the EF the correlation coefficient between the 2 measurements was 0.94 (95% CI, 0.90-0.97), without noteworthy biases in the high or low values of the series in the Bland-Altman analysis (standard error =5.13%). Mean variability was 4.5±8.6 ml and the correlation coefficient 0.99 (95% CI, 0.98-0.99) for EDV. For ESV variability was 3.4±6.6 ml (r=0.99; 95% CI, 0.98-0.99), without systematic bias in the distribution of the differences (standard error, 8.71% and 6.7%, respectively) (Figure 3).


Fig. 3. Interassay reproducibility. Upper row: the regression values of the ejection fraction (EF), end-diastolic volume (EDV), and end-systolic volume (ESV) obtained during the first resting perfusion SPECT (REP1) and those obtained during the second (REP2). Lower row: analysis of the Bland-Altman scatter plot showing the differences obtained between the results of the 2 studies over the range of the average values.
Comparison With Blood Pool Radionuclide Ventriculography
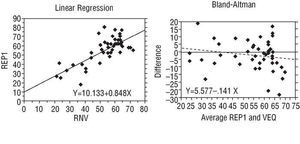
The mean of the values for EF obtained with RNV was 4.5% lower than the one obtained with gated-SPECT (53.0 vs 55.1%, respectively), although no statistically significant differences (P=.139) were found when Student's t test for paired data was applied. The correlation coefficient between the 2 sets of the values was 0.75 (95% CI, 0.59-0.85). The scatter of the differences of values is shown graphically in Figure 4, and does not present biases associated with the high or low range. Greater scatter in the high values can be seen, but this can be attributed to the fact that most of the results are concentrated in the upper part of the graph.

Fig. 4. Regression analysis and Bland-Altman scatter plot of the differences between the value of the ejection fraction obtained through radionuclide ventriculography and the first resting gated-SPECT (REP1). RNV indicates equilibrium radionuclide ventriculography.
The Bland-Altman analysis confirmed that there is no relationship between the differences and the value for EF, without biases over the range of values (standard error =9.52%). There were no differences in standard deviation (9.5%) for all the degrees of low uptake when the differences of the EF were analyzed regarding the presence and severity of perfusion defects.
DISCUSSION
Software for the quantification of ventricular volume and EF through gated-SPECT are widespread and their limitations have been studied in previous works.1,20,23,31,33,35 Nevertheless, there are few studies aimed at assessing interobserver variability and, in particular, interassay variability of a methodology that can be used to assess evolutionary changes in the patients.
When the interobserver reproducibility of gated-SPECT is assessed, the only thing being analyzed is the impact of the process of three-dimensional cardiac reconstruction, since both the position of the patient, the images and the ECG are the same and the rest of the processing for the evaluation of the ventricular outlines is automatic. Thus, this is one of the first studies in which reproducibility has been evaluated between two totally different studies, acquired by repositioning the patient after some minutes, thus obtaining new images and a new ECG.
Liu et al15 obtained a coefficient of variation of 3.45%±3.23% between 2 measurements obtained in 2 consecutive studies without repositioning the patient between studies.6 Chua et al21 studied the interobserver variability of the QGS method with excellent results (r=0.99; standard error =1.84%). In a study by Hyun et al17 interobserver and interassay variability were also very low. The variability for EF was 2.3% and 2.1 mL for EDV and 2.7 mL for ESV when 2 consecutive studies were compared, although without repositioning the patient. In the same series the reproducibility of 2 gated-SPECT studies obtained with 201Tl was analyzed, and slightly higher variabilities were obtained: EF, 5.2%; EDV, 3.2 ml, and ESV, 3.5 ml. Our data agree with previous research in the sense that the evaluation of ventricular volume and EF of the left ventricle through gated-SPECT with technetium radiotracers has very high interassay reproducibility (mean variability, 2±5.1 points for EF). This high reproducibility is in line with that obtained through blood pool planar radionuclide ventriculography with automatic calculation of the ventricular outline, where the interassay coefficient of variation was 6.2% for EF. However, in other series manual delimitation methods show interobserver variabilities ranging from 9.1% to 10.7%, and semiautomatic methods range from 7.5% to 8.4%.32 We did not encounter any loss of reproducibility in the evaluations of EF and ventricular volume with gated-SPECT in relation to that obtained using blood pool planar radionuclide ventriculography. We believe that, taken together, this validates the use of this method for following up the evolution of ventricular function.
Differences were observed in EF values when comparing the results between gated-SPECT and radionuclide ventriculography. In previous studies with radionuclide ventriculography, normal EF values for the left ventricle (62.8%±7.8%) were obtained which are very close to our results with gated-SPECT: normal value for EF: 59.7%±5.9%.32 However, although in this study the correlation between the 2 methods was reasonably good, the standard error of the estimation of the differences was 9.6%. Bland-Altman analysis showed broad scatter with discrepancies of up to 20 points in some values, in both the high and low range of the EF. This indicates that the 2 methods cannot be used interchangeably because the EF variations obtained in each case might be due to methodological differences.
Chua et al21 compared gated-SPECT with blood pool planar radionuclide ventriculography and obtained a high correlation (r=0.94) with a standard error of 6.3% and a mean difference of 1.3%. In the subgroup of patients with regions of extensive myocardial infarction, there was good correlation between the 2 techniques (r=0.89; standard error =6.48%). In our series, the mean difference for EF with ventriculography was -2.06% and the results were not as good due to the presence of scatter in the high values of the series (Figure 4). In other studies comparing gated-SPECT and blood pool planar radionuclide ventriculography, significant differences have been found in the EF values determined with the two techniques, with degrees of correlation similar to those we have obtained.13,19 It seems clear that the profound methodological differences between the planar method, which bases calculation of the EF on the variations in activity of the labeled red blood cells, and the tomographic method, which determines the endocardial outline based on the uptake of the ventricular wall, gives rise to a disparity between the results similar to that obtained when comparing any of the other measurement modalities for ventricular function.
When compared with other techniques, gated-SPECT has shown good correspondence with magnetic resonance imaging,13,29,30 contrast angiography,26 echocardiography,24 and contrast ventriculography.28 Nevertheless, the studies that use QGS have confirmed a tendency to underestimate EF values compared to the ones obtained with magnetic resonance imaging.13,20 The recent metaanalysis conducted by Ioannidis et al31 shows a high correlation between magnetic resonance imaging and gated-SPECT for EF, EDV, and ESV; however, the size of the discrepancies observed in specific cases means that the values are not interchangeable between the 2 techniques. In general, it can be stated that there is a correlation between the different measurement methods for ventricular function. However, the methodological differences mean that there is no equivalence of values that would permit reliable follow-up of its evolution if different techniques are used.
CONCLUSION
Gated-SPECT has demonstrated high interassay reproducibility in the measurement of left ventricle EF and ventricle volumes, and can be used for measuring the evolution of changes in patients. Although there is significant correlation between gated-SPECT and the radionuclide ventriculography, in some cases the differences found are important. This means that the 2 techniques cannot be used interchangeably for follow-up of left ventricular function.
ACKNOWLEDGEMENTS
To Dr. Elena Barcina and Dr. Emilio Moreno of Amersham Health for their assistance in the design and statistical analysis of the study.
Study funded by a research grant from Amersham Health.
Correspondence: Dr. J. Castell-Conesa.
Servicio de Medicina Nuclear. Hospital Universitari Vall d'Hebron.
Pg. Vall d'Hebron, 119-129. 08029 Barcelona. España.
E-mail: jcastell@vhebron.net