
Transcatheter aortic valve implantation (TAVI) using the cusp overlap technique (COT) has shown a lower pacemaker implantation rate at 30 days. The objective of this study was to compare electrocardiogram changes and clinical outcomes between COT and the traditional technique (TT) at 1 year of follow-up.
MethodsObservational, retrospective, nonrandomized study of consecutive patients undergoing TAVI between January 2015 and January 2021. Patients were matched using a propensity score and the TT was compared with COT. The primary endpoints were electrocardiogram changes and a combined endpoint including pacemaker implantation, hospitalization, or cardiovascular death at 1 year.
ResultsWe included 254 patients. After propensity score matching, 184 patients (92 per group) remained. There were no statistically significant differences in baseline characteristics. At 1 year, COT patients showed a significant reduction in new onset left bundle branch block (49% vs 27%, P=.002) and less P wave (13.1±21.0 msec vs 5.47±12.5 msec; P=.003) and QRS prolongation (29.77±27.0 msec vs 16.38±25.4 msec, P <.001). COT was associated with a significant reduction in the occurrence of the primary endpoint (SHR, 0.39 [IC95%, 0.21-0.76]; P=.005).
ConclusionsAt 1 year of follow-up, COT reduced the incidence of new onset left bundle branch block and diminished QRS and P wave widening compared with the TT. COT was also associated with a statistically significant reduction in the occurrence of the combined primary cardiovascular endpoint.
Keywords
Transcatheter aortic valve implantation (TAVI) has become the standard treatment for severe aortic stenosis (AS) in high-risk and inoperable patients. Following the publication of the latest recommendations of the European Society of Cardiology, its indications have been extended to all patients older than 75 years.1 In recent years, procedural complications have been reduced and success rates have increased due to technological advances in valve design and delivery systems.
Following TAVI, changes take place that favor complete atrioventricular block (AVB), especially in patients who already have baseline intraventricular conduction disturbances.2 Electrocardiographic changes are the most frequent complication of TAVI.3 The cusp overlap technique (COT) has been shown to optimize implantation depth and reduce the need for pacing at 30 days.4,5 This technique uses fluoroscopy to isolate the noncoronary cusp and overlap the right and left cusp to achieve shallower implants with less negative impact on the conduction system. Although most studies have been based on the study of new-onset left bundle branch block or complete AVB,6 there are few detailed studies on the components of baseline, postimplantation, and 1-year electrocardiograms. Furthermore, there are no studies on the impact of implantation using COT on clinical events.
The aim of this study was to compare electrocardiographic changes and clinical outcomes between COT and the traditional 3-cusp coplanar implantation technique (TT) at 1 year of follow-up.
METHODSStudy designObservational single-center nonrandomized study of consecutive patients undergoing TAVI.
Study populationThe study included patients undergoing TAVI with self-expandable valves between January 1, 2015 and January 31, 2021, after their selection by a multidisciplinary heart team in accordance with clinical practice guidelines.1 The following patients were excluded from the study: patients with permanent pacemakers, bicuspid aortic valve disease, with unreadable electrocardiograms (ECG) prior to TAVI, atrial fibrillation (AF) (because AF precludes P-wave analysis), and patients who had undergone previous valve-in-valve TAVI. Patients with unreadable follow-up ECGs were excluded from ECG analysis.
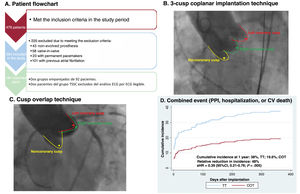
Of 478 patients, 254 met the inclusion/exclusion criteria (figure 1A). Previous studies have reported improved implant depth by modifying its projection7,8: thus, from February 1, 2019 onward, TT was changed to COT to optimize implant depth. Our study took advantage of this modification of standard practice to compare 2 groups of consecutive patients: group A, 162 consecutive patients (January 1, 2015-February 1, 2019) undergoing TT; and group B, 92 consecutive patients (February 2, 2019-January 31, 2021) undergoing COT. The study was approved by the ethics committee (approval 2022.296) and all patients signed informed consent.

Central illustration. A: Study flowchart. B: Aortography at the time of prosthesis release using TT. C: Aortography at the time of prosthesis release using COT. D: Kaplan-Meier plot for the primary outcome of the combined cardiovascular event. 95%CI, 95% confidence interval; CV, cardiovascular; PPI, permanent pacemaker implantation; sHR, Fine-Gray subhazard ratio; COT, cusp overlap technique; TT, traditional 3-cusp coplanar implantation technique.
We recorded the patients’ baseline characteristics, procedure-related variables, and follow-up variables. We performed clinical follow-up over 1 year and recorded the following cardiovascular events: need for permanent pacemaker, hospitalization, or death (both cardiovascular and all-cause).
Transvalvular aortic prosthesis implantation techniqueAll patients selected for TAVI underwent contrast-enhanced multislice computed tomography synchronized with ECG to obtain high-quality images of the aortic valvular plane, followed by postprocessing with 3Mensio StructuralHeart software package (Pie Medical Imaging, The Netherlands) to determine measurements and working projections. The COT is characterized by isolating the noncoronary cusp and overlapping the left and right cusps, whereas TT is characterized by aligning the 3 cusps in the same plane (figure 1B,C). A previous study has described the implantation procedure and the technique for measuring the depth of the implanted valves.4 The size of the prosthesis was selected for each patient based on the perimeter of the aortic annulus according to the manufacturer's recommendations. The use of rapid pacing, predilatation, or postdilatation was left to the discretion of the interventional cardiologist.
Primary and secondary outcomesThe primary outcomes were ECG changes and a combined outcome of permanent pacemaker implantation, hospitalization, or cardiovascular death. Secondary outcomes were the individual components of the combined outcome and hospitalization or all-cause death.
Electrocardiogram analysisElectrocardiograms were taken from all patients at 24 hours preimplantation, 24 hours postimplantation, and 1-year of follow-up. Conduction disturbances were classified according to current clinical practice guidelines.9 Electrocardiographic data were recorded and the morphology and duration (in milliseconds) of the waves and segments were determined. Comparisons were made of ECGs 24 hours pre-TAVI, ECGs 24 hours post-TAVI, and ECGs at 1 year. Comparisons were also made of ECGs 24 hours post-TAVI and ECGs at 1 year. To avoid interobserver bias, a single investigator was responsible for the detailed ECG analysis using the digital measurement tool of the IntelliSpace ECG software package (Koninklijke Philips, The Netherlands) with up to ×25 magnification without loss of resolution. Measurements were determined of the duration in milliseconds of P-wave, QRS, T-wave, PR interval, and QT interval. The QT interval was corrected (QTc) using the Bazzet formula.
Statistical analysisContinuous variables are expressed as mean±standard deviation. Qualitative variables are expressed as absolute frequency (percentage). Given the observational nature of this study, propensity matching was used to control for potentially unbalanced baseline characteristics. The parameters used were nearest-neighbor, 1:1, without replacement, at a caliper of 0.05. Table 1 shows the 24 variables that were included in the propensity score. Since the P-value depends on sample size, baseline characteristics were also compared using the standardized mean difference. Absolute values of 0.1 (synonymous with 10% of the standard deviation of this variable) are considered to indicate relevant differences.
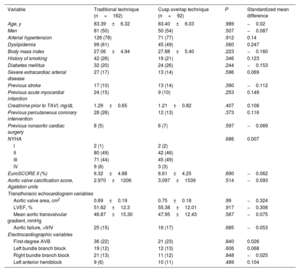
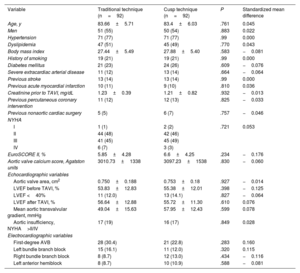
Baseline characteristics of the patients included in the study prior to propensity score matching
| Variable | Traditional technique (n=162) | Cusp overlap technique (n=92) | P | Standardized mean difference |
|---|---|---|---|---|
| Age, y | 83.39±6.32 | 83.40±6.03 | .989 | −0.02 |
| Men | 81 (50) | 50 (54) | .507 | −0.087 |
| Arterial hypertension | 126 (78) | 71 (77) | .912 | 0.14 |
| Dyslipidemia | 99 (61) | 45 (49) | .060 | 0.247 |
| Body mass index | 27.06±4.94 | 27.88±5.40 | .223 | −0.160 |
| History of smoking | 42 (26) | 19 (21) | .346 | 0.123 |
| Diabetes mellitus | 32 (20) | 24 (26) | .244 | −0.153 |
| Severe extracardiac arterial disease | 27 (17) | 13 (14) | .596 | 0.069 |
| Previous stroke | 17 (10) | 13 (14) | .390 | −0.112 |
| Previous acute myocardial infarction | 24 (15) | 9 (10) | .253 | 0.149 |
| Creatinine prior to TAVI, mg/dL | 1.29±0.65 | 1.21±0.82 | .407 | 0.108 |
| Previous percutaneous coronary intervention | 28 (26) | 12 (13) | .373 | 0.116 |
| Previous nonaortic cardiac surgery | 8 (5) | 6 (7) | .597 | −0.069 |
| NYHA | .686 | 0.007 | ||
| I | 2 (1) | 2 (2) | ||
| II | 80 (49) | 42 (46) | ||
| III | 71 (44) | 45 (49) | ||
| IV | 9 (6) | 3 (3) | ||
| EuroSCORE II (%) | 6.32±4.88 | 6.61±4.25 | .690 | −0.062 |
| Aortic valve calcification score, Agatston units | 2.970±1206 | 3.097±1539 | .514 | −0.093 |
| Transthoracic echocardiogram variables | ||||
| Aortic valve area, cm2 | 0.69±0.19 | 0.75±0.18 | .99 | −0.324 |
| LVEF, % | 51.62±12.3 | 55.38±12.01 | .917 | −0.306 |
| Mean aortic transvalvular gradient, mmHg | 46.87±15.30 | 47.95±12.43 | .567 | −0.075 |
| Aortic failure, >II/IV | 25 (15) | 16 (17) | .685 | −0.053 |
| Electrocardiographic variables | ||||
| First-degree AVB | 36 (22) | 21 (23) | .840 | 0.026 |
| Left bundle branch block | 19 (12) | 12 (13) | .606 | 0.068 |
| Right bundle branch block | 21 (13) | 11 (12) | .848 | −0.025 |
| Left anterior hemiblock | 9 (6) | 10 (11) | .489 | 0.104 |
AVB, atrioventricular block; LVEF, left ventricular ejection fraction; NYHA, New York Heart Association; TAVI: transcatheter aortic valve implantation.
Data are expressed as No. (%) or mean±standard deviation.
Quantitative variables were assessed for normality using the Shapiro-Wilk test. Quantitative changes in the ECG were evaluated using Student t test for independent samples if they were normally distributed or the Mann-Whitney U test. Qualitative variables were compared using the Fischer exact test. All-cause mortality was analyzed using the Kaplan-Meier method and hazard ratios (HR) were calculated using Cox regression modeling. For the other outcomes, a competing risks analysis was performed using cumulative incidence functions and the Fine and Gray regression method to calculate the subhazard ratio (sHR).10 Noncardiovascular mortality was the competing risk for the primary combined outcome and the cardiovascular mortality outcome; all-cause mortality was the competing risk in the other cases.
A sensitivity analysis was performed for any baseline variables that could act as confounders and failed to show acceptable adjustment between groups despite the propensity score.
A subanalysis was performed including the unmatched sample (n=254) and patients with atrial fibrillation (n=101); the total sample consisted of 357 patients. Study objectives were assessed using a competing risks analysis in this cohort. A multivariate analysis was also performed to ascertain the impact of atrial fibrillation and implantation technique in relation to the combined primary outcome.
All statistical analyses were performed using SPSS Statistics v27.0.1.0 (SPSS, IBM, United States), except for propensity matching and competing risks analyses (cumulative incidence function and Fine-Gray method), which were performed using the STATA V14.2 software package (StataCorp, United States).
RESULTSPopulationWe included 254 patients. Of these, 36.2% (n=92) underwent implantation using COT. Mean age was 83.4±6.21 years, 131 (52%) were male, and mean EuroSCORE II was 6.42%±4.66%. There were no losses to follow-up. No statistically significant differences were found between study groups in baseline clinical characteristics, baseline ECG characteristics, or baseline echocardiogram characteristics; however, the standardized mean difference did show tangible differences (> 0.1 or <−0.1) between the 2 groups in 12 of the study variables (hypertension, dyslipidemia, diabetes, body mass index, smoking, previous stroke, previous myocardial infarction, previous serum creatinine, previous percutaneous coronary intervention, aortic valve area, left ventricular ejection fraction [LVEF], and left anterior hemiblock). For this reason, propensity matching was applied. Table 1 shows the baseline characteristics of the unmatched sample. The subanalysis that included patients with AF and the unmatched sample (n=357) showed that the prevalence of AF was 28.4% in the TT group (n=64) and 29.5% in the COT group (n=39), with no statistical differences between groups (P=.904).
Propensity matching resultsAfter balancing the 2 groups for their baseline characteristics, of the 254 patients initially included, a matched sample of 184 patients was obtained: 92 in the COT group and 92 in the TT group. Two patients from the COT group were excluded from the ECG analysis due to unreadable ECGs during follow-up, although they were included in the analysis of clinical events. After matching, the total sample had a mean age of 83.2±6.2 years, and 55% were male. There were no statistically significant differences between the TT and COT groups in baseline characteristics. Table 2 shows the baseline characteristics of the matched groups, P values, and standardized mean differences. There were also no significant differences in the use of the different pharmacological groups for the treatment of heart failure (table 1 of the supplementary data).
Baseline characteristics of patients included in the study matched by propensity score
| Variable | Traditional technique (n=92) | Cusp technique (n=92) | P | Standardized mean difference |
|---|---|---|---|---|
| Age, y | 83.66±5.71 | 83.4±6.03 | .761 | 0.045 |
| Men | 51 (55) | 50 (54) | .883 | 0.022 |
| Hypertension | 71 (77) | 71 (77) | .99 | 0.000 |
| Dyslipidemia | 47 (51) | 45 (49) | .770 | 0.043 |
| Body mass index | 27.44±5.49 | 27.88±5.40 | .583 | −0.081 |
| History of smoking | 19 (21) | 19 (21) | .99 | 0.000 |
| Diabetes mellitus | 21 (23) | 24 (26) | .609 | −0.076 |
| Severe extracardiac arterial disease | 11 (12) | 13 (14) | .664 | −0.064 |
| Previous stroke | 13 (14) | 13 (14) | .99 | 0.000 |
| Previous acute myocardial infarction | 10 (11) | 9 (10) | .810 | 0.036 |
| Creatinine prior to TAVI, mg/dL | 1.23±0.39 | 1.21±0.82 | .932 | −0.013 |
| Previous percutaneous coronary intervention | 11 (12) | 12 (13) | .825 | −0.033 |
| Previous nonaortic cardiac surgery | 5 (5) | 6 (7) | .757 | −0.046 |
| NYHA | ||||
| I | 1 (1) | 2 (2) | .721 | 0.053 |
| II | 44 (48) | 42 (46) | ||
| III | 41 (45) | 45 (49) | ||
| IV | 6 (7) | 3 (3) | ||
| EuroSCORE II, % | 5.85±4.28 | 6.6±4.25 | .234 | −0.176 |
| Aortic valve calcium score, Agatston units | 3010.73±1338 | 3097.23±1538 | .830 | −0.060 |
| Echocardiographic variables | ||||
| Aortic valve area, cm2 | 0.750±0.188 | 0.753±0.18 | .927 | −0.014 |
| LVEF before TAVI, % | 53.83±12.83 | 55.38±12.01 | .398 | −0.125 |
| LVEF <40% | 11 (12.0) | 13 (14.1) | .827 | −0.064 |
| LVEF after TAVI, % | 56.64±12.88 | 55.72±11.30 | .610 | 0.076 |
| Mean aortic transvalvular gradient, mmHg | 49.04±15.63 | 57.95±12.43 | .599 | 0.078 |
| Aortic insufficiency, NYHA>II/IV | 17 (19) | 16 (17) | .849 | 0.028 |
| Electrocardiographic variables | ||||
| First-degree AVB | 28 (30.4) | 21 (22.8) | .283 | 0.160 |
| Left bundle branch block | 15 (16.1) | 11 (12.0) | .320 | 0.115 |
| Right bundle branch block | 8 (8.7) | 12 (13.0) | .434 | −0.116 |
| Left anterior hemiblock | 8 (8.7) | 10 (10.9) | .588 | −0.081 |
AVB, atrioventricular block; LVEF, left ventricular ejection fraction; NYHA, New York Heart Association functional class.
Data are expressed as No. (%) or mean±standard deviation.
Of the patients undergoing TAVI, valve predilatation was performed in 18 (19.6%) patients in the TT group and 13 (14.1%) in the COT group, without statistically significant differences between groups (P=.431). Valve postdilatation was performed in 36 (39.1%) patients in the TT group and 27 (29.3%) in the COT group, without statistically significant differences between groups (P=.214). The mean size of the implanted valves was 28.88±2.69mm in the TT group and 29.62±2.88mm in the COT group, without statistically significant differences between groups (P=.146).
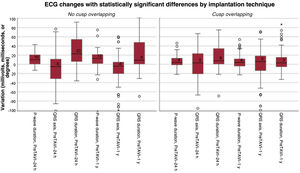
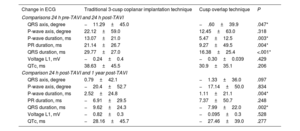
Electrocardiographic changesThere was less QRS and P-wave prolongation in the COT group than in the TT group 24 hours after implantation (P <.001 and P=.003, respectively) and at 1 year (P=.002 and P=.004) (table 3 and figure 2). The change in QRS axis was greater in the TT group immediately after the procedure and at 1 year of follow-up (P=.047) (table 3 and figure 2).
Changes in duration or voltage of the different ECG waves and intervals
| Change in ECG | Traditional 3-cusp coplanar implantation technique | Cusp overlap technique | P |
|---|---|---|---|
| Comparisons 24 h pre-TAVI and 24 h post-TAVI | |||
| QRS axis, degree | −11.29±45.0 | −.60±39.9 | .047* |
| P-wave axis, degree | 22.12±59.0 | 12.45±63.0 | .318 |
| P-wave duration, ms | 13.07±21.0 | 5.47±12.5 | .003* |
| PR duration, ms | 21.14±26.7 | 9.27±49.5 | .004* |
| QRS duration, ms | 29.77±27.0 | 16.38±25.4 | <.001* |
| Voltage L1, mV | −0.24±0.4 | −0.30±0.039 | .429 |
| QTc, ms | 38.63±45.5 | 30.9±35.1 | .206 |
| Comparison 24 h post-TAVI and 1 year post-TAVI | |||
| QRS axis, degree | 0.79±42.1 | −1.33±36.0 | .097 |
| P-wave axis, degree | −20.4±52.7 | −17.14±50.0 | .834 |
| P-wave duration, ms | 2.52±24.8 | 1.11±21.1 | .004* |
| PR duration, ms | −6.91±29.5 | 7.37±50.7 | .248 |
| QRS duration, ms | −9.62±24.3 | −7.99±22.0 | .002* |
| Voltage L1, mV | −0.82±0.3 | −0.095±0.3 | .528 |
| QTc, ms | −28.16±45.7 | −27.46±39.0 | .277 |
ECG, electrocardiogram; TAVI, transcatheter aortic valve implantation.
Values are expressed as mean±standard deviation.

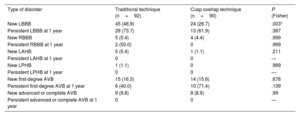
New left bundle branch block (LBBB) was significantly lower in the COT group (24 patients; 27%) than in the TT group (45 patients; 48%) (P=.003). There were no statistically significant differences in the incidence of other intraventricular or atrioventricular conduction disorders. No differences were found in the persistence of these disorders at 1 year, whether they were present immediately after the procedure or persisting at 1-year follow-up (table 4).
Comparison of intraventricular and atrioventricular conduction disturbances after the procedure and at 1 year
| Type of disorder | Traditional technique (n=92) | Cusp overlap technique (n=90) | P (Fisher) |
|---|---|---|---|
| New LBBB | 45 (48.9) | 24 (26.7) | .003* |
| Persistent LBBB at 1 year | 28 (73.7) | 13 (61.9) | .387 |
| New RBBB | 5 (5.4) | 4 (4.4) | .999 |
| Persistent RBBB at 1 year | 2 (50.0) | 0 | .999 |
| New LAHB | 5 (5.4) | 1 (1.1) | .211 |
| Persistent LAHB at 1 year | 0 | 0 | — |
| New LPHB | 1 (1.1) | 0 | .999 |
| Persistent LPHB at 1 year | 0 | 0 | — |
| New first-degree AVB | 15 (16.3) | 14 (15.6) | .676 |
| Persistent first-degree AVB at 1 year | 6 (40.0) | 10 (71.4) | .139 |
| New advanced or complete AVB | 9 (9.8) | 8 (8.9) | .99 |
| Persistent advanced or complete AVB at 1 year | 0 | 0 | — |
AVB, atrioventricular block; RBBB, left bundle branch block; LBBB, left bundle branch block; LAHB, left anterior hemiblock; LPHB, left posterior hemiblock.
The P value of THE Fisher exact test is shown.
Data are expressed as No. (%).
P <.05. The analysis of the persistence of electrocardiographic changes at 1 year showed the following losses to follow-up due to death: TT group; 7 LBBB, 1 RBBB, 4 LAHB, 0 LPHB and first-degree AVB, and 9 advanced or complete AVB. COT group; 3 LBBB, 3 RBBB, 0 in LAHB and LPHB, 0 first-degree AVB, and 4 advanced or complete AVB.
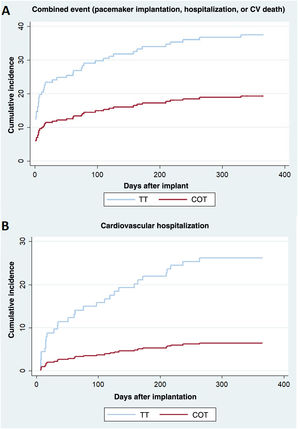
The combined cardiovascular event (permanent pacemaker implantation, hospitalization, or cardiovascular death) occurred in 35 patients (38.0%) in the TT group, with an estimated cumulative incidence of 38.0% (28.2-47.8), and in 18 patients (19.6%) in the COT group with an estimated cumulative incidence of 19.6% (12.2%-28.2), with a statistically significant difference (P=.005) (figure 1D and figure 3A). Fine-Gray analysis showed that the risk of the combined cardiovascular event was lower in the COT group than in the TT group (sHR=0.39; 95% confidence interval [95%CI], 0.21-0.76; P=.005). The sensitivity analysis, which included first-degree AVB as a covariate, showed that the combined cardiovascular event was lower in the COT group (sHR=0.457; 95%CI, 0.258-0.810; P=.007).
Secondary outcomes. B: cumulative incidence of cardiovascular hospitalization events. COT, cusp overlap technique; TT, traditional 3-cusp coplanar implantation technique.")
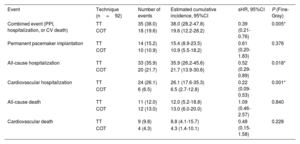
Table 5 shows the results on the combined cardiovascular event and its individual components. There was a lower cumulative incidence of all-cause hospitalization in the COT group (20 events: 21.7%; 95%CI, 13.9-30.6) than in the TT group (33 events: 35.9%; 95%CI, 26.2-45.6; P=.018), and of cardiovascular hospitalization in the COT group (6 events: 6.5%) than in the TT group (24 events: 26.1%; P <.001) (figure 3B). Of the patients with cardiovascular hospitalization, admission for heart failure occurred in 16% (n=13) of the TT group vs 2 cases (2.5%) in the COT group. Figure 1 of the supplementary data shows the causes of cardiovascular admission by group.
One-year comparison of events in the TT and COT groups
| Event | Technique (n=92) | Number of events | Estimated cumulative incidence, 95%CI | sHR, 95%CI | P (Fine-Gray) |
|---|---|---|---|---|---|
| Combined event (PPI, hospitalization, or CV death) | TT | 35 (38.0) | 38.0 (28.2-47.8) | 0.39 (0.21-0.76) | 0.005* |
| COT | 18 (19.6) | 19.6 (12.2-28.2) | |||
| Permanent pacemaker implantation | TT | 14 (15.2) | 15.4 (8.9-23.5) | 0.61 (0.20-1.83) | 0.376 |
| COT | 10 (10.9) | 10.9 (5.5-18.2) | |||
| All-cause hospitalization | TT | 33 (35.9) | 35.9 (26.2-45.6) | 0.52 (0.29-0.89) | 0.018* |
| COT | 20 (21.7) | 21.7 (13.9-30.6) | |||
| Cardiovascular hospitalization | TT | 24 (26.1) | 26.1 (17.6-35.3) | 0.22 (0.09-0.53) | 0.001* |
| COT | 6 (6.5) | 6.5 (2.7-12.8) | |||
| All-cause death | TT | 11 (12.0) | 12.0 (5.2-18.8) | 1.09 (0.46-2.57) | 0.840 |
| COT | 12 (13.0) | 13.0 (6.0-20.0) | |||
| Cardiovascular death | TT | 9 (9.8) | 8.8 (4.1-15.7) | 0.48 (0.15-1.58) | 0.228 |
| COT | 4 (4.3) | 4.3 (1.4-10.1) |
95%CI, 95% confidence interval; PPI, permanent pacemaker implantation; sHR, Fine-Gray subhazard ratio; COT, cusp overlap technique; TT, traditional 3-cusp coplanar implantation technique.
All-cause death was the only event analyzed using Kaplan-Meier and Cox proportional hazards regression as there was no competing event. Data are expressed as No. (%) or mean±standard deviation.
The combined cardiovascular event was significantly lower in the COT group than in the TT group (sHR=0.54; 95%CI, 0.38-0.76) (table 2 of the supplementary data).
Reductions in all-cause and cardiovascular hospitalizations remained at the same level, but there was a significant reduction in the need for permanent pacemaker implantation. The adjusted cumulative incidence for all-cause mortality was 21.3% in the TT group and 12.1% in the COT group (sHR=0.54; 95%CI, 0.31-0.95; P=.031) (table 2 of the supplementary data).
Multivariate analysis showed that the presence of AF (risk factor) and the implantation technique (COT as a protective factor) were predictors of the combined primary outcome (table 3 of the supplementary data).
DISCUSSIONThe main finding of the study was that the use of COT was associated with less P-wave widening, reductions in the combined event, and reductions in cardiovascular or all-cause hospitalizations. We also found that COT led to a significant reduction in the incidence of LBBB.
The bundle of His is fundamental to maintaining atrioventricular and interventricular synchrony. It passes through the membranous portion of the intraventricular septum anatomically very close to the noncoronary/right coronary cusps.11 Because of its anatomical location, the deeper the TAVI, the more this component is affected. Implantation depth also leads to hemodynamic changes; in vitro studies have shown that shallower implants are associated with reduced neo-sinus flow stasis and, therefore, with a lower risk of leaflet thrombosis and better coronary flow.12
Valve implantation depth is a growing field of research. However, there is no standardized technique to calculate depth, which is a limitation in interpreting the existing literature. The deepest edge method has been accepted as the most stringent method to differentiate the relevant outcome parameters.13 The implantation of a self-expanding device is considered optimal if its depth is < 6 mm below the aortic annulus and is associated with a decreased need for permanent pacing.14 There is no evidence to show that shallower implants reduce paravalvular leaks.15 Self-expanding TAVI using COT achieves shallower implants in the left ventricular outflow tract when measured from the noncoronary cusp, and with the mean of the noncoronary and left coronary cusp, but not when using the deepest edge method.4
In this study, only self-expandable valves were studied: however, it has been shown that there is a higher incidence of LBBB, greater PR interval prolongation, and a greater need for pacing 24 hours after implantation with self-expandable valves than with balloon-expandable valves.16,17 Studies are ongoing on the implantation of balloon-expandable valves using COT. A recent analysis found that COT is also safe and feasible, achieves implantations at a depth of 3.0±1.4mm, and has low rates of mortality and pacemaker implantation 1 month after TAVI.18 Nevertheless, comparative studies with longer follow-up will be required to determine the incidence of events in the 2 groups.
We found that COT for TAVI reduces the incidence of LBBB and P-wave, QRS complex, and QT interval prolongation. A novel finding of our study is that there was less P-wave prolongation using COT than TT. To our knowledge, this study is the first to compare 2 self-expandable valve implantation techniques. A previous study investigated the short- and long-term effects of TAVI on P-wave duration. The study included 52 patients, 32 with self-expandable valves and 20 with balloon-expandable valves. No significant differences were found between short-term and long-term values. P-wave duration was shorter on post-TAVI 24-hour ECG and 6-month ECG than on pre-TAVI ECG. However, the P-wave measurement methodology was different, given that each ECG recorded the lead with the shortest and longest P-wave duration.19 We found P-wave prolongation on 24-hour ECG, becoming shorter on 1-year follow-up ECG. The finding that P-wave prolongation is shorter after implantation using COT is relevant, since a duration > 120 ms would imply the presence of interatrial block, although its classification would depend on the morphology of the P wave in inferior leads.20 The presence of advanced interatrial block is associated with higher mortality and the incidence of AF and stroke in patients treated by TAVI.21 Further studies are needed to corroborate this finding and to determine the association between TAVI and the occurrence of interatrial block.
Although there was less need for pacemakers at 1 year in the COT group (n = 10) than in the TT group (n = 14), there were no statistically significant differences. This result was probably due to low statistical power. The subanalysis of the total sample (n=357), which included patients with atrial fibrillation, showed a statistically significant reduction in the need for permanent pacing in the COT group. A previous multicenter study, with 30-day follow-up and a larger sample of patients, found that COT reduces the rate of permanent pacemaker implantation.4
Another factor that could influence these findings is the higher prevalence of LBBB in the COT group (13%) than in the TT group (8.7%), although this finding was not statistically significant. It is widely known that patients with baseline LBBB are at higher risk of AVB after TAVI.22 A meta-analysis included permanent pacemaker implantation at 30 days as part of the primary outcome of interest. The meta-analysis found a statistically significant reduction in the need for permanent pacemakers in patients undergoing TAVI with COT (odds ratio [OR]=0.49; 95%CI, 0.36-0.66; P<.001), without a statistically significant reduction in LBBB (OR=0.91; 95%CI, 0.67-1.25).23 Another meta-analysis analyzed 11 studies that included a total of 3207 patients. The results were very similar to our own. Permanent pacemaker implantations were significantly fewer in the COT group than in the TT group (OR=0.48; 95%CI, 0.33-0.70; P=.001), and there was a nonsignificant trend toward a reduction in LBBB (OR=0.82; 95%CI, 0.47-1.45; P=.418).24
The results of present study suggest that TAVI with COT significantly reduced the combined cardiovascular event, mainly through significant reductions in the number of cardiovascular hospitalizations. These results were maintained after the inclusion of patients with atrial fibrillation in the analysis. To control for the possible influence of medical treatment on patient prognosis, we analyzed medical treatment with prognostic potential (beta-blockers, angiotensin-converting enzyme inhibitors, angiotensin II receptor antagonists, neprilysin and angiotensin receptor inhibitors, mineralocorticoid receptor antagonists, or sodium-glucose cotransporter 2 inhibitors). No statistically significant differences were found between groups at discharge or at 1 year of follow-up (figure 2 of the supplementary data and table 1 of the supplementary data). It is of clinical relevance that there were reductions in the incidence of new LBBBs and permanent pacemaker implantations, despite the latter result failing to reach statistical significance in the matched sample. These reductions could partly explain the lower incidences of the combined cardiovascular event and cardiovascular hospitalization observed. This suggestion is based on the results of observational studies and a meta-analysis that have shown that patients with new LBBB after TAVI have higher mortality at 1 year and that patients requiring permanent pacemaker implantation and patients with new LBBB have higher all-cause mortality, more hospitalizations for heart failure, and greater LVEF deterioration.25,26
One of the limitations of this study is that it is an observational nonrandomized study. Despite initially including 479 patients, the application of the exclusion criteria and propensity matching substantially reduced the number of participants. However, propensity matching yielded high-quality results and made the groups homogeneous in their baseline characteristics. Since the aim was to analyze changes in all ECG waves and segments, patients with atrial fibrillation were excluded. On the other hand, although there was a trend toward shorter QTc interval prolongation in the COT group (without reaching statistical significance), this result could have been affected by differences in the incidence of LBBB in favor of the COT group. Other limitations could include the absence of a dyssynchrony echocardiogram and the fact that all ECGs were analyzed by a single investigator. Furthermore, the results are only applicable to patients receiving self-expanding aortic valves.
The results obtained provide new evidence in favor COT vs TT. Further research is needed to perform a randomized clinical trial to compare the 2 techniques to confirm the favorable electrocardiographic and clinical results.
CONCLUSIONSThe use of COT in TAVI was associated with a reduced incidence of LBBB, QRS widening, and P-wave prolongation, although QRS axis shift was greater with COT use. The COT was also associated with a statistically significant reduction in the combined cardiovascular event, cardiovascular hospitalizations, and all-cause hospitalizations.
- –
Transcatheter aortic valve implantation is associated with atrioventricular and intraventricular conduction disturbances. The appearance of new left bundle branch block and the need for pacemakers after the procedure is associated with a higher incidence of adverse effects during follow-up. The cusp overlap technique reduces the need for pacing at 30 days.
- –
The cusp overlap technique reduces the immediate incidence of left bundle branch block and reduces QRS and QTc widening. These benefits are maintained after 1 year of electrocardiographic follow-up. The cusp overlap technique reduces the combined cardiovascular composite of need for permanent pacemakers, cardiovascular hospitalization, or death at 1 year of follow-up, mainly due to fewer cardiovascular hospitalizations.
None declared.
AUTHORS’ CONTRIBUTIONSConcept: Y.R. Persia-Paulino, M. Almendárez Lacayo, A. Alperi, C. Morís de la Tassa, and P. Avanzas. Design: Y.R. Persia-Paulino, M. Almendárez Lacayo, A. Alperi, P. Avanzas, and I. Pascual. Oversight: D. Hernández-Vaquero, P. Avanzas, and I. Pascual. Materials: R. Fernáncez Asensio and J. Cuevas Pérez. Data collection: Y.R. Persia-Paulino, M. Almendárez Lacayo, A. Alperi, A. Adeba, P. Flórez, M. Vigil-Escalera, R. Álvarez Velasco, A. Renilla, and R. del Valle Fernández. Data analysis and interpretation: Y.R. Persia-Paulino, M. Almendárez Lacayo, A. Alperi, D. Hernández-Vaquero, A. Renilla, R. del Valle Fernández, P. Avanzas, and C. Morís de la Tassa. Literature review: Y.R. Persia-Paulino, M. Almendárez Lacayo, A. Alperi, R. Fernáncez Asensio, J. Cuevas Pérez, P. Flórez, M. Vigil-Escalera, P. Avanzas, and I. Pascual. Writing: Y.R. Persia-Paulino, M. Almendárez Lacayo, A. Alperi, and R. Álvarez Velasco. Critical revision: A. Adeba, C. Morís de la Tassa, P. Avanzas, and I. Pascual. Y.R. Persia-Paulino, M. Almendárez Lacayo, A. Alperi equally contributed to the manuscript.
CONFLICTS OF INTERESTP. Avanzas is an associate editor of Revista Española de Cardiología; the editorial procedure established by the journal has been followed to guarantee the impartial handling of the manuscript. The other authors declare no conflicts of interest.
Supplementary data can be consulted in its electronic version at: https://doi.org/10.1016/j.rec.2023.04.008.