Low-gradient severe aortic stenosis with preserved ejection fraction is a controversial entity. Misclassification of valvulopathy severity could explain the inconsistencies reported in the prognosis of these patients. Planimetry of the aortic area using three-dimensional transesophageal echocardiography could clear up these doubts. The objectives were to assess the agreement between measurements of the valvular aortic area by continuity equation in transthoracic echocardiography and that obtained through planimetry with three-dimensional transesophageal echocardiography in low-gradient severe aortic stenosis patients.
MethodsCross-sectional descriptive study of consecutive patients referred due to severe aortic stenosis. Patients underwent transthoracic echocardiography and three-dimensional transesophageal echocardiography. Paradoxical low-gradient severe aortic stenosis was defined by the presence in the transthoracic echocardiography of aortic valve area<1 cm2, mean ventricular gradient<40mmHg, and ejection fraction≥50%. Concordance between the two techniques was evaluated.
ResultsOf 212 consecutive severe aortic stenosis patients evaluated, 63 cases (29.7%) fulfilled the paradoxical low-gradient inclusion criteria. We obtained three-dimensional aortic valve planimetry in 61 (96.8%) of those patients. In 52 patients (85.2%), aortic valve area by transesophageal echocardiography was <1 cm2. The intraclass correlation coefficient between the two methods was 0.505 (95% confidence interval, 0.290-0.671; P<.001).
ConclusionsParadoxical low-gradient severe aortic stenosis is an actual entity, confirmed in 85% of cases evaluated by three-dimensional transesophageal echocardiography.
Keywords
Aortic valve stenosis is the most common acquired valvulopathy and the one that most often requires valve replacement surgery in our environment.1 For these patients, 2-dimensional transthoracic echocardiography (TTE) and Doppler echocardiography assessments play an important role in determining the severity of the valvular heart disease, its management, and prognosis.2
During the echocardiographic evaluation, it is normal to encounter an aortic valve area (AVA)<1cm2 with low transvalvular gradients despite preserved ejection fraction.3 The prognostic impact of this entity is not well defined. Some studies have suggested that this echocardiographic pattern is associated with a poorer prognosis.4,5 However, a recent prospective study reports that this entity may have a prognosis similar to that of aortic stenosis, better than previously reported, which suggests erroneous classification of the severity of aortic valve stenosis using the usual diagnostic methods.6
Three-dimensional (3D) echocardiography techniques have proven useful in diagnosing aortic stenosis7 and monitoring its treatment.8 It has also been demonstrated that evaluation of AVA through planimetry with 3D transesophageal echocardiography (3D-TOE) is feasible. The results were consistent with the measurements calculated using TTE.9 Valve planimetry using 3D-TOE might be a useful diagnostic tool for checking the severity of aortic valvulopathy when the transthoracic study shows discrepancy between the AVA estimated by continuity equation and the gradients obtained by Doppler echocardiography.
The objective of this study was to evaluate the concurrence between the AVA obtained by the continuity equation with TTE and that obtained by 3D-TOE planimetry in patients with severe aortic stenosis and low gradient with normal ventricular function, in order to establish the existence of this disease.
METHODDesign, Patients, and Ethical ConsiderationsDescriptive, cross-sectional study of consecutive patients transferred to a reference center between September 2009 and June 2012 for aortic stenosis evaluation. Patients with severe aortic stenosis, defined as AVA<1cm2, were selected. From that sample of patients, we selected those who presented mean aortic gradient<40mmHg and left ventricular ejection fraction≥50%. The study protocol was reviewed and approved by the center's committee on ethics in clinical research on 27 July 2009. Informed consent was obtained from all patients.
Transthoracic EchocardiographyTTE was performed with iE33 ultrasound equipment (Philips Medical Systems; Andover, Massachusetts, United States) with an S5-2 sectoral probe (bandwidth 5 to 1 MHZ). Experienced cardiologists conducted a standardized study following current recommendations,10 using all views (apical, subcostal, suprasternal, and right parasternal) to obtain maximum transvalvular velocity. Blood pressure measurements were recorded during the study. Images obtained were stored and processed with a specialized system for image management (Xcelera, Philips Medical Systems) and AVA was calculated by continuity equation.10 Ventricular-arterial obstructions were calculated according to the method described by Briand et al.11
Three-dimensional Transesophageal EchocardiographyOn the same day as the standard TTE, TOE was also performed in all patients by an echographer blinded to the results of the transthoracic study. Sedation with propofol was employed at the discretion of the echographer.
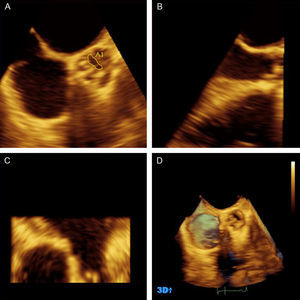
Blood pressure was monitored and registered during the procedure. The 3D-TOE was performed with iE33 ultrasound equipment (Philips Medical Systems) with an X7-2t transducer. Real-time images (Live 3D®) of pyramidal volume of the aortic valve and left ventricular outflow tract (LVOT) were obtained. The angle and depth of the explored area were reduced in order to obtain an acquisition frequency above 20Hz. The images obtained were centered in the aortic valve from a short-axis view between 30° and 45°, guided by biplanar mode (x-Plane®) so as to obtain the valve opening at the level of the valve cusps (Fig. 1). In each patient, 3 cardiac cycles were recorded.
. Panel B shows the longitudinal plane used for selecting the transversal plane in the valve cusps. Panel D shows a three-dimensional image of a bicuspid aortic valve with a fibrous raphe in the anterior cusp. On this image we selected the frame where the maximum valve opening is visible.")
Results processed using Q-Lab® of the aortic valve imaging obtained by the Live 3D® method. Panels A, B and C show multiplanar reconstruction. Panel A contains the transversal plane at the level of the aortic cusps where we performed aortic valve area planimetry (in this case 0.45cm2). Panel B shows the longitudinal plane used for selecting the transversal plane in the valve cusps. Panel D shows a three-dimensional image of a bicuspid aortic valve with a fibrous raphe in the anterior cusp. On this image we selected the frame where the maximum valve opening is visible.
Image post-processing was carried out on an Xcelera work station using Q-Lab® software (Philips Medical Systems). This image management software allows the reconstruction of any previously obtained window of the pyramidal volume. On the 3D image we selected the cardiac cycle phase in which the valve opening was highest. On this frame, multiplanar reconstruction was done to obtain a view perpendicular to the aortic semilunar valve, reoriented as necessary to visualize the valve opening area at the level of the valve cusps (Fig. 1). Likewise, planimetry of the LVOT area was performed and included in the continuity equation to calculate the AVA using a mixed approach: 3D-TOE for LVOT and TTE for flows.
Data Processing and Statistical AnalysisCalculations were performed after 3 cardiac cycles (5 non-extreme cycles if the patient was in atrial fibrillation). All measurements and calculations were blinded and duplicated, by two different echocardiographers.
The normal distribution of continuous variables was assessed using the Kolmogorov-Smirnov test (Lilliefors correction). Variables are expressed as proportions, mean (standard deviation) or as median [interquartile range], as appropriate in each case. Comparisons between central estimators were performed using the Student t test or chi-square test. The reliability of the measurements was assessed by the intraclass correlation coefficient12 and Bland-Altman plot.13 Kappa coefficient was used to compare the classification of valvular stenosis severity by the methods studied. Differences were considered statistically significant when the two-sided value was P<.05. Calculations were performed using SPSS 15.0 software for Windows (SPSS Inc.; Chicago, Illinois, United States). Bland-Altman plot was graphed with the !AGREE software for SPSS.14
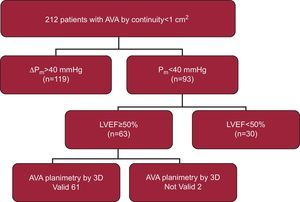
RESULTSBetween the specified dates, we evaluated 240 aortic stenosis patients in our laboratory, of which 212 had an aortic AVA<1cm2. Of those patients, 63 (29.7%) satisfied the criteria for severe aortic valve stenosis with low gradient and normal ventricular function (Fig. 2). We were unable to perform 3D-TOE planimetry in 2 patients due to extensive valve calcification that prevented us from correctly identifying the valve opening area. Therefore, our final population consisted of 61 patients whose characteristics are shown in Table 1.

Diagram of patient flow. Starting with 240 patients evaluated, 212 patients with severe aortic stenosis were selected in the transthoracic study. Finally, 61 patients remained as the participants in our study. AVA, aortic valve area; LVEF, left ventricular ejection fraction; ΔPm, medium aortic gradient.
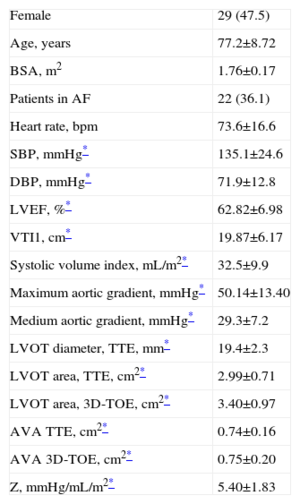
Characteristics of all 61 Patients in the Study.
| Female | 29 (47.5) |
| Age, years | 77.2±8.72 |
| BSA, m2 | 1.76±0.17 |
| Patients in AF | 22 (36.1) |
| Heart rate, bpm | 73.6±16.6 |
| SBP, mmHg* | 135.1±24.6 |
| DBP, mmHg* | 71.9±12.8 |
| LVEF, %* | 62.82±6.98 |
| VTI1, cm* | 19.87±6.17 |
| Systolic volume index, mL/m2* | 32.5±9.9 |
| Maximum aortic gradient, mmHg* | 50.14±13.40 |
| Medium aortic gradient, mmHg* | 29.3±7.2 |
| LVOT diameter, TTE, mm* | 19.4±2.3 |
| LVOT area, TTE, cm2* | 2.99±0.71 |
| LVOT area, 3D-TOE, cm2* | 3.40±0.97 |
| AVA TTE, cm2* | 0.74±0.16 |
| AVA 3D-TOE, cm2* | 0.75±0.20 |
| Z, mmHg/mL/m2* | 5.40±1.83 |
3D-TOE, three-dimensional transesophageal echocardiography; AF, atrial fibrillation; AVA, aortic valve area; BSA, body surface area; DBP, diastolic blood pressure; LVEF, left ventricular ejection fraction; LVOT, left ventricular outflow tract; SBP, systolic blood pressure; TTE, transthoracic echocardiography; VTI1: prevalvular velocity-time integral; Z, ventricular arterial impedance.
Data are expressed as no. (%) or mean±standard deviation.
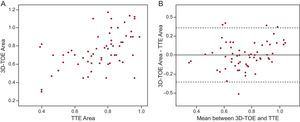
The AVA planimetry using 3D-TOE reconstruction confirmed the presence of severe stenosis (AVA<1cm2) in 52 cases (85.2%). The intraclass correlation coefficient between TTE and 3D-TOE was 0.505 (95% confidence interval [95%CI], 0.290-0.671; P<.001). The data distribution and Bland-Altman plot are shown in Figure 3. The mean difference between the two methods was 0.003cm2, with the 3D-TOE measurement being slightly higher (95%CI, −0.353 to 0.359).
. 3D-TOE, three-dimensional transesophageal echocardiography; TTE, transthoracic echocardiography.")
A: Graphic dispersion of the measurements of the aortic valve area through three-dimensional transesophageal echocardiography and transthoracic echocardiography. B: Bland-Altman13 plot showing the concordance of the aortic valve area measurements with three-dimensional transesophageal echocardiography and transthoracic echocardiography. The mean difference between the 2 methods was y–x=0.003 (95% confidence interval, −0.353 to 0.359). 3D-TOE, three-dimensional transesophageal echocardiography; TTE, transthoracic echocardiography.
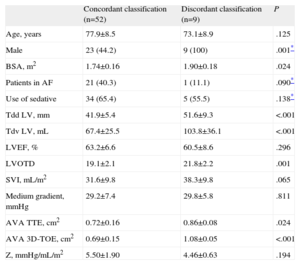
In 9 patients (14.7%), AVA assessment by 3D-TOE revealed dimensions larger than 1cm2. These patients had greater body surface area. Only one of them had atrial fibrillation and had larger LV and LVOT than patients with the proper classification. The AVA by TTE was also greater than that of the correctly classified patients. A comparison of the variables analyzed is shown in Table 2.
Differences Between Patients According to Agreement of the two Methods in the Classification of Aortic Severity.
| Concordant classification (n=52) | Discordant classification (n=9) | P | |
| Age, years | 77.9±8.5 | 73.1±8.9 | .125 |
| Male | 23 (44.2) | 9 (100) | .001* |
| BSA, m2 | 1.74±0.16 | 1.90±0.18 | .024 |
| Patients in AF | 21 (40.3) | 1 (11.1) | .090* |
| Use of sedative | 34 (65.4) | 5 (55.5) | .138* |
| Tdd LV, mm | 41.9±5.4 | 51.6±9.3 | <.001 |
| Tdv LV, mL | 67.4±25.5 | 103.8±36.1 | <.001 |
| LVEF, % | 63.2±6.6 | 60.5±8.6 | .296 |
| LVOTD | 19.1±2.1 | 21.8±2.2 | .001 |
| SVI, mL/m2 | 31.6±9.8 | 38.3±9.8 | .065 |
| Medium gradient, mmHg | 29.2±7.4 | 29.8±5.8 | .811 |
| AVA TTE, cm2 | 0.72±0.16 | 0.86±0.08 | .024 |
| AVA 3D-TOE, cm2 | 0.69±0.15 | 1.08±0.05 | <.001 |
| Z, mmHg/mL/m2 | 5.50±1.90 | 4.46±0.63 | .194 |
3D-TOE, three-dimensional transesophageal echocardiography; AF, atrial fibrillation; AVA, aortic valve area; BSA, body surface area; LV, left ventricle; LVEF, left ventricular ejection fraction; LVOTD, left ventricular outflow tract diameter; SVI, systolic volume index; Tdd, telediastolic diameter; Tdv, teledystolic volume; TTE, transthoracic echocardiography; Z, ventricular arterial impedance.
Data are expressed as no. (%) or mean±standard deviation.
When we used the LVOT area obtained by 3D-TOE in the continuity equation, the AVA obtained was>1cm2 in 9 cases, which were reclassified as moderate stenosis. However, the Kappa coefficient of agreement between 3D-TOE and the mixed-method assessment reached only 0.28.
DiscussionThis descriptive study shows that the paradoxical low-gradient severe aortic stenosis present in 30% of our study participants is a real entity. It was confirmed as such in 85.2% of patients assessed by 3D-TOE planimetry. In previous studies, planimetry of AVA using 3D-TOE images also confirmed the existence of true aortic stenosis cases according to the anatomic criteria.2,10
ConcordanceThe intraclass correlation coefficient is a useful tool to assess agreement between different measurement methods or observers, based on an analysis of variance model using repeated measures.12 In our study, the concordance between TTE and 3D-TOE is moderate, with an intraclass correlation coefficient lower than previously reported in a study of aortic stenosis patients.9 We attribute this lower rate of agreement to our specially selected sample. The patients in our study are those that would raise doubts for many authors about the accuracy of the measurements made by TTE.7,15,16 The inclusion of some patients with AVA underestimated by TTE (15% in our series) makes the results lower than those reported in a less selective population.9
On the other hand, we obtain the anatomical area of the valve by planimetry while the continuity equation calculates the effective valve area.7 It has been described that the anatomical area displays values higher than those estimated by the continuity equation, particularly in cases with degenerative, flat valves, without bulging, similar to those of most of our study population.17 Our results, however, show no significant differences between the two methods. In the Bland-Altman plot analysis the mean difference in the estimates was nearly the same, although the 3D-TOE measurement was slightly higher, 0.003cm2 (95%CI, −0.353 to 0.359).
Misclassified GroupThe severity of the affected valve was not confirmed by 3D-TOE planimetry in 9 of the patients we evaluated. We consider this an insufficient number of cases to establish the causes of misclassification. Nevertheless, these patients had larger body surface area, LV, and LVOT measurements. Only one of them had atrial fibrillation and the end-systolic volume index was slightly higher although it did not reach statistical significance with respect to the concordant group. Most of these patients presented an AVA by TTE>0.8cm2. As shown in Figure 3, only one patient with 0.75cm2 AVA on TTE later presented an AVA>1cm2 on 3D-TOE. This is definitely a group of patients with valve stenosis on the borderline of severity.
The potential errors in LVOT measurement are noted in the guidelines for the quantification of valvulopathy10 and are suspected of being responsible for misclassification in some studies.6 Given that LVOT morphology is not circular, the use of other methods such as 3D-TOE estimation of the LVOT area has been promoted to improve the reliability of the measurement7 and help avoid unsatisfactory results of treatment.18 In our study, using the LVOT area evaluated by 3D-TOE allowed us to reclassify some patients at the moderate level who had AVA>1cm2. However, patients were also misclassified using the 3D-TOE findings, so the Kappa coefficient was not very good (0.28).
Due to the design of the inclusion criteria, the group of misclassified patients can only account for cases in which the degree of severity of aortic stenosis decreases. Therefore, drawing conclusions from this group would be very susceptible to the phenomenon of regression toward the mean,19 as we have acknowledged.
LimitationsThis study does not have a reference criterion for the estimation of AVA. The clinical standard is TTE with the continuity equation2,10 but this method's inconsistency phenomenon3 is precisely what we sought to investigate. We opted for a feasible methodology that quantifies the AVA using a strategy of independent Doppler and LVOT measurements. However, 3D-TOE has important limitations including its spatial and temporal resolution. With an acquisition frequency of 20Hz and heart rate around 70 bpm, it can obtain between 6 and 7 images during cardiac systole. In general, the 5th or 6th frame is where we capture the maximum valvular opening. It is also possible, in some cases, to not obtain the maximum valvular opening image.
Sedation with propofol allows us to explore thoroughly and allows the patient to be more comfortable. Although the effects of propofol on contractility and arterial tension have been mentioned,20 these do not seem to have influenced our results because when patients in either group were reclassified there were no differences related to its use. Moreover, we consider heart rate control and the possibility of a thorough examination to be of great importance; therefore, in cases of doubt we prefer the help provided by the sedative.
In some patients the presence of extensive calcifications, especially those located in the rear face of the root or on the posterior cusp, prevent us from evaluating the opening. This only occurred in two patients.
Although the inclusion of patients was consecutive, a referral bias is possible because we included only patients with prior severe stenosis. This means the sample may not represent the general population. The different inclusion criteria used by different authors may explain the differences in the prevalence of paradoxical low-gradient severe stenosis reported in the literature.
CONCLUSIONSSevere aortic stenosis despite a paradoxical low gradient is a real entity confirmed in 85% of cases evaluated by 3D-TOE. More in-depth study of the cases with discrepancies is needed to discover the reasons for their misclassification.
CONFLICTS OF INTERESTNone declared.