There is an interaction between age, sex, and educational level, among other factors, that influences mortality. To date, no studies in Spain have comprehensively analyzed social inequalities in cardiovascular mortality by considering the joint influence of age, sex, and education (intersectional perspective).
MethodsStudy of all deaths due to all-cause cardiovascular disease, ischemic heart disease, heart failure, and cerebrovascular disease among people aged ≥ 30 years in Spain in 2015. Data were obtained from the Spanish Office of Statistics. The relative index of inequality (RII) and the slope index of inequality (SII) were calculated by using Poisson regression models with age-adjusted mortality. The RII is interpreted as the relative risk of mortality between the lowest and the highest educational level, and the SII as the absolute difference in mortality.
ResultsThe RII for all-cause cardiovascular mortality was 1.88 (95%CI, 1.80-1.96) in women and 1.44 (95%CI, 1.39-1.49) in men. The SII was 178.46 and 149.43 deaths per 100 000, respectively. The greatest inequalities were observed in ischemic heart disease and heart failure in younger women, with a RII higher than 4. There were no differences between sexes in inequalities due to cerebrovascular disease.
ConclusionsCardiovascular mortality is inversely associated with educational level. This inequality mostly affects premature mortality due to cardiac causes, especially among women. Monitoring this problem could guide the future Cardiovascular Health Strategy in the National Health System, to reduce inequality in the first cause of death.
Keywords
Cardiovascular disease (CVD) is the leading cause of death in Spain,1 but few studies have analyzed its relationship with socioeconomic status at the national level.2–6
Health care inequalities are unjust and avoidable differences in health status between different population groups, and there is abundant evidence that many of these inequalities can be explained by social determinants—the circumstances in which people are born, grow, live, work, and age.7 One of the main structural inequalities in health is differences in educational level, whose effects manifest through interaction with other structural determinants such as sex and ethnicity, as well as intermediary determinants such as material circumstances, social cohesion, and psychosocial, biological, and behavioral factors.8 To reflect these interactions, intersectionality theory proposes that the effects of social determinants of health be studied together rather than separately, since inequality in health care is the result of interaction among all of them.9,10
European country comparisons of social inequalities in health have included data from Spain; however, although these were presented as national data, they were in fact collected only in Madrid, Barcelona, and other major cities.11–14 The only study to analyze cardiovascular mortality using nationwide data for Spain did so within the framework of overall mortality.2 Thus, to date there has been no exhaustive analysis of how social inequalities influence cardiovascular mortality in Spain.
The goal of the present study was to carry out a comprehensive assessment of social inequalities in CVD mortality in Spain in 2015 from an intersectional perspective, considering the combined influence of sex, age, and educational level.
METHODSStudy design and populationThe study included all deaths due to CVD in Spain in 2015 in the population aged ≥ 30 years. Data were obtained from the Spanish Office of Statistics (SOS). Cause of death was assigned according to the 10th revision of the International Disease Classification. The mortality data analyzed included those for all-cause CVD (codes I00-I99), ischemic heart disease (I20-I25), heart failure (I50), and cerebrovascular disease (I60-69).
Study variablesThe study variables were sex, age (30-69 years and ≥ 70 years), and educational level grouped into 5 categories: incomplete primary education, primary education, lower secondary education, higher secondary education, and tertiary (university) education. All these variables are included in the SOS cause of death database. The SOS assigned educational level to all persons dying in 2015 aged ≥ 30 years through a process combining imputational methods with cross-referencing of multiple information sources (registered residents’ addresses, 2001 and 2011 census data, university graduation lists from the Ministry of Education, and the Spanish State Employment Service registry of job applications and professional certifications).15 Denominators in the analysis were the estimated populations by age group and sex on July 1, 2015. To stratify by educational level, we used the percentage of the population by age in each educational category on January 1, 2016; this information was also provided by the SOS.
Data analysisData on educational level were available for 121 021 people aged ≥ 30 years who died from a cardiovascular cause, corresponding to 97.6% of all cardiovascular deaths in this age range.
We first calculated crude and adjusted mortality rates per 100 000 inhabitants by the direct method, using the total Spanish population in 2015 as the population standard. We then explored the association between cardiovascular mortality and the study variables by using multivariable Poisson log-linear regression models. We also analyzed the existence of interactions of educational level with sex and age (results in ). Significant interactions were found with most causes of death, and results were stratified by sex and the 2 age groups. Finally, social inequality indicators were calculated together with corresponding 95% confidence intervals (95%CI).
The slope index of inequality (SII) was calculated as an absolute measure. SII was obtained by Poisson regression of the age-adjusted mortality rates as a function of a relative scale of social status called ridit, whose values are the midpoints of the range in the cumulative distribution of the population in the equity stratifier (educational level). SII corresponds to the absolute difference in mortality rate between those with the lowest and highest educational level, adjusting for the effect of the change in overall population distribution according to educational level.16
The relative index of inequality (RII) and inequality concentration curves were calculated as relative measures. The RII developed by Mackenbach and Kunst17 is the ratio between regression-estimated mortality rates in the socioeconomic groups with ridit values of 1 and 0. RII is interpreted as a relative risk, while also incorporating information from intermediate groups in the measurement of inequality. The inequality concentration curves are adjusted Lorenz curves obtained by nonlinear optimization to provide a graphic representation of the cumulative relative distribution of mortality rate in the population stratified by educational level. These curves indicate the extent to which mortality is concentrated in different groups according to educational level. If the concentration curve lies above the 45° diagonal from the lower left to the upper right corners (the equality line), this indicates a concentration of deaths in the population with a lower educational level. In the absence of inequality, the concentration curve superimposes the equality line.16
Graphs were generated in MS Excel 2010,18 rates and relative risks were calculated with STATA v.15 (StataCorp.; Texas, United States), and inequality measures were calculated with HEAT Plus v.1.0.19
RESULTSCrude and adjusted CVD mortality rates stratified by educational level are shown for women (table 1) and for men (table 2). The adjusted all-cause cardiovascular mortality rates were 492.2/100 000 men and 371.3/100 000 women. The relative difference between men and women was greater in the population aged between 30 and 69 years (65.8/100 000 men and 20.2/100 000 women) than among those aged ≥ 70 years (362.0/100 000 men and 299.5/100 000 women).
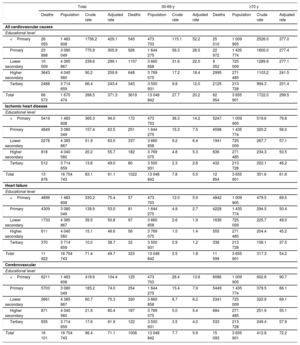
Cardiovascular mortality in women stratified by educational level and age
| Total | 30-69 y | ≥70 y | ||||||||||
|---|---|---|---|---|---|---|---|---|---|---|---|---|
| Deaths | Population | Crude rate | Adjusted rate | Deaths | Population | Crude rate | Adjusted rate | Deaths | Population | Crude rate | Adjusted rate | |
| All cardiovascular causes | ||||||||||||
| Educational level | ||||||||||||
| <Primary | 26 055 | 1 483 608 | 1756.2 | 429.1 | 545 | 473 703 | 115.1 | 52.2 | 25 510 | 1 009 905 | 2526.0 | 377.0 |
| Primary | 23 898 | 3 080 049 | 775.9 | 305.9 | 926 | 1 644 275 | 56.3 | 28.5 | 22 972 | 1 435 774 | 1600.0 | 277.4 |
| Lower secondary | 10 509 | 4 385 867 | 239.6 | 299.1 | 1157 | 3 660 858 | 31.6 | 22.0 | 9 352 | 725 009 | 1289.9 | 277.1 |
| Higher secondary | 3643 | 4 040 560 | 90.2 | 259.9 | 648 | 3 769 075 | 17.2 | 18.4 | 2995 | 271 485 | 1103.2 | 241.5 |
| Tertiary | 2468 | 3 714 659 | 66.4 | 243.4 | 343 | 3 500 931 | 9.8 | 12.0 | 2125 | 213 728 | 994.3 | 231.4 |
| Total | 66 573 | 1 670 474 | 398.5 | 371.3 | 3619 | 13 048 842 | 27.7 | 20.2 | 62 954 | 3 655 901 | 1722.0 | 299.5 |
| Ischemic heart disease | ||||||||||||
| Educational level | ||||||||||||
| <Primary | 5419 | 1 483 608 | 365.3 | 94.0 | 172 | 473 703 | 36.3 | 14.2 | 5247 | 1 009 905 | 519.6 | 79.8 |
| Primary | 4849 | 3 080 049 | 157.4 | 63.5 | 251 | 1 644 275 | 15.3 | 7.5 | 4598 | 1 435 774 | 320.2 | 56.0 |
| Lower secondary | 2278 | 4 385 867 | 51.9 | 63.5 | 337 | 3 660 858 | 9.2 | 6.4 | 1941 | 725 009 | 267.7 | 57.1 |
| Higher secondary | 818 | 4 040 560 | 20.2 | 55.7 | 182 | 3 769 075 | 4.8 | 5.3 | 636 | 271 485 | 234.3 | 50.5 |
| Tertiary | 512 | 3 714 659 | 13.8 | 49.0 | 80 | 3 500 931 | 2.3 | 2.8 | 432 | 213 728 | 202.1 | 46.2 |
| Total | 13 876 | 16 704 743 | 83.1 | 61.1 | 1022 | 13 048 842 | 7.8 | 5.5 | 12 854 | 3 655 901 | 351.6 | 61.8 |
| Heart failure | ||||||||||||
| Educational level | ||||||||||||
| <Primary | 4899 | 1 483 608 | 330.2 | 75.4 | 57 | 473 703 | 12.0 | 5.9 | 4842 | 1 009 905 | 479.5 | 69.5 |
| Primary | 4309 | 3 080 049 | 139.9 | 53.0 | 81 | 1 644 275 | 4.9 | 2.7 | 4228 | 1 435 774 | 294.5 | 50.4 |
| Lower secondary | 1733 | 4 385 867 | 39.5 | 50.8 | 97 | 3 660 858 | 2.6 | 1.9 | 1636 | 725 009 | 225.7 | 49.0 |
| Higher secondary | 611 | 4 040 560 | 15.1 | 46.6 | 56 | 3 769 075 | 1.5 | 1.4 | 555 | 271 485 | 204.4 | 45.2 |
| Tertiary | 370 | 3 714 659 | 10.0 | 38.7 | 32 | 3 500 931 | 0.9 | 1.2 | 338 | 213 728 | 158.1 | 37.5 |
| Total | 11 922 | 16 704 743 | 71.4 | 49.7 | 323 | 13 048 842 | 2.5 | 1.8 | 11 599 | 3 655 901 | 317.3 | 54.2 |
| Cerebrovascular | ||||||||||||
| Educational level | ||||||||||||
| <Primary | 6211 | 1 483 608 | 418.6 | 104.4 | 125 | 473 703 | 26.4 | 13.6 | 6086 | 1 009 905 | 602.6 | 90.7 |
| Primary | 5703 | 3 080 049 | 185.2 | 74.0 | 254 | 1 644 275 | 15.4 | 7.9 | 5449 | 1 435 774 | 379.5 | 66.1 |
| Lower secondary | 2661 | 4 385 867 | 60.7 | 75.3 | 320 | 3 660 858 | 8.7 | 6.2 | 2341 | 725 009 | 322.9 | 69.1 |
| Higher secondary | 871 | 4 040 560 | 21.6 | 60.4 | 187 | 3 769 075 | 5.0 | 5.4 | 684 | 271 485 | 251.9 | 55.1 |
| Tertiary | 655 | 3 714 659 | 17.6 | 61.9 | 122 | 3 500 931 | 3.5 | 4.0 | 533 | 213 728 | 249.4 | 57.9 |
| Total | 16 101 | 16 704 743 | 96.4 | 71.1 | 1008 | 13 048 842 | 7.7 | 5.9 | 15 093 | 3 655 901 | 412.8 | 72.2 |
Data for Spain, 2015. Adjusted rate per 100 000 inhabitants.
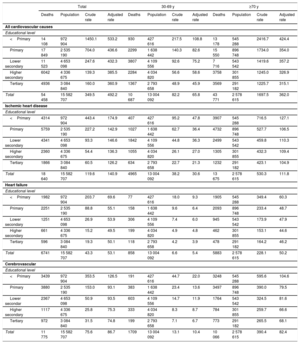
Cardiovascular mortality in men stratified by educational level and age
| Total | 30-69 y | ≥70 y | ||||||||||
|---|---|---|---|---|---|---|---|---|---|---|---|---|
| Deaths | Population | Crude rate | Adjusted rate | Deaths | Population | Crude rate | Adjusted rate | Deaths | Population | Crude rate | Adjusted rate | |
| All cardiovascular causes | ||||||||||||
| Educational level | ||||||||||||
| <Primary | 14 108 | 972 904 | 1450.1 | 533.2 | 930 | 427 616 | 217.5 | 108.8 | 13 178 | 545 288 | 2416.7 | 424.4 |
| Primary | 17 849 | 2 535 190 | 704.0 | 436.6 | 2299 | 1 638 442 | 140.3 | 82.6 | 15 550 | 896 748 | 1734.0 | 354.0 |
| Lower secondary | 11 523 | 4 653 098 | 247.6 | 432.3 | 3807 | 4 109 556 | 92.6 | 75.2 | 7 716 | 543 542 | 1419.6 | 357.2 |
| Higher secondary | 6042 | 4 336 675 | 139.3 | 385.5 | 2284 | 4 034 820 | 56.6 | 58.6 | 3758 | 301 855 | 1245.0 | 326.9 |
| Tertiary | 4936 | 3 084 840 | 160.0 | 360.9 | 1367 | 2 793 658 | 48.9 | 45.9 | 3569 | 291 182 | 1225.7 | 315.1 |
| Total | 54 458 | 15 582 707 | 349.5 | 492.2 | 10 687 | 13 004 092 | 82.2 | 65.8 | 43 771 | 2 578 615 | 1697.5 | 362.0 |
| Ischemic heart disease | ||||||||||||
| Educational level | ||||||||||||
| <Primary | 4314 | 972 904 | 443.4 | 174.9 | 407 | 427 616 | 95.2 | 47.8 | 3907 | 545 288 | 716.5 | 127.1 |
| Primary | 5759 | 2 535 190 | 227.2 | 142.9 | 1027 | 1 638 442 | 62.7 | 36.4 | 4732 | 896 748 | 527.7 | 106.5 |
| Lower secondary | 4341 | 4 653 098 | 93.3 | 146.6 | 1842 | 4 109 556 | 44.8 | 36.3 | 2499 | 543 542 | 459.8 | 110.3 |
| Higher secondary | 2360 | 4 336 675 | 54.4 | 136.3 | 1055 | 4 034 820 | 26.1 | 27.0 | 1305 | 301 855 | 432.3 | 109.4 |
| Tertiary | 1866 | 3 084 840 | 60.5 | 126.2 | 634 | 2 793 658 | 22.7 | 21.3 | 1232 | 291 182 | 423.1 | 104.9 |
| Total | 18 640 | 15 582 707 | 119.6 | 140.9 | 4965 | 13 004 092 | 38.2 | 30.6 | 13 675 | 2 578 615 | 530.3 | 111.8 |
| Heart failure | ||||||||||||
| Educational level | ||||||||||||
| <Primary | 1982 | 972 904 | 203.7 | 69.6 | 77 | 427 616 | 18.0 | 9.3 | 1905 | 545 288 | 349.4 | 60.3 |
| Primary | 2251 | 2 535 190 | 88.8 | 55.1 | 158 | 1 638 442 | 9.6 | 6.4 | 2093 | 896 748 | 233.4 | 48.7 |
| Lower secondary | 1251 | 4 653 098 | 26.9 | 53.9 | 306 | 4 109 556 | 7.4 | 6.0 | 945 | 543 542 | 173.9 | 47.9 |
| Higher secondary | 661 | 4 336 675 | 15.2 | 49.5 | 199 | 4 034 820 | 4.9 | 4.8 | 462 | 301 855 | 153.1 | 44.6 |
| Tertiary | 596 | 3 084 840 | 19.3 | 50.1 | 118 | 2 793 658 | 4.2 | 3.9 | 478 | 291 182 | 164.2 | 46.2 |
| Total | 6741 | 15 582 707 | 43.3 | 53.1 | 858 | 13 004 092 | 6.6 | 5.4 | 5883 | 2 578 615 | 228.1 | 50.2 |
| Cerebrovascular | ||||||||||||
| Educational level | ||||||||||||
| <Primary | 3439 | 972 904 | 353.5 | 126.5 | 191 | 427 616 | 44.7 | 22.0 | 3248 | 545 288 | 595.6 | 104.6 |
| Primary | 3880 | 2 535 190 | 153.0 | 93.1 | 383 | 1 638 442 | 23.4 | 13.6 | 3497 | 896 748 | 390.0 | 79.5 |
| Lower secondar | 2367 | 4 653 098 | 50.9 | 93.5 | 603 | 4 109 556 | 14.7 | 11.9 | 1764 | 543 542 | 324.5 | 81.6 |
| Higher secondary | 1117 | 4 336 675 | 25.8 | 75.3 | 333 | 4 034 820 | 8.3 | 8.7 | 784 | 301 855 | 259.7 | 66.6 |
| Tertiary | 972 | 3 084 840 | 31.5 | 74.8 | 199 | 2 793 658 | 7.1 | 6.7 | 773 | 291 182 | 265.5 | 68.1 |
| Total | 11 775 | 15 582 707 | 75.6 | 86.7 | 1709 | 13 004 092 | 13.1 | 10.4 | 10 066 | 2 578 615 | 390.4 | 82.4 |
Data for Spain, 2015. Adjusted rate per 100 000 inhabitants.
Illiteracy linked to noncompletion of primary education was more frequent among women than men (8.9% and 6.2%, respectively), and this difference was much higher among those aged ≥ 70 years (27.6% in women vs 21.1% in men) than in the 30 to 69-year-old population (3.6% vs 3.3%). Overall, the mortality rate showed an inverse correlation with educational level.
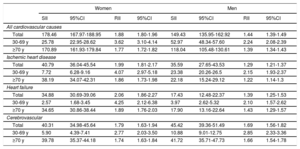
Inequality indicators are listed in table 3. All-cause cardiovascular mortality was higher among people with a lower educational level, but the magnitude of the effect varied with the disease, sex, and age. The RII for all-cause cardiovascular mortality was 1.88 (95%CI, 1.80-1.96) in women and 1.44 (95%CI, 1.39-1.49) in men, indicating that the gap in CVD mortality between the lowest and highest educational level was 88% for women and 44% for men. Women also showed greater absolute differences, with an SII of 178.46 (95%CI, 167.97-188.95) in women vs 149.43 (95%CI, 135.95-162.92) in men. This translates as 180 more female and 150 more male deaths per 100 000 in the lowest educational level than in the highest.
Association of inequality in cardiovascular mortality with differences in educational level stratified by age and sex
| Women | Men | |||||||
|---|---|---|---|---|---|---|---|---|
| SII | 95%CI | RII | 95%CI | SII | 95%CI | RII | 95%CI | |
| All cardiovascular causes | ||||||||
| Total | 178.46 | 167.97-188.95 | 1.88 | 1.80-1.96 | 149.43 | 135.95-162.92 | 1.44 | 1.39-1.49 |
| 30-69 y | 25.78 | 22.95-28.62 | 3.62 | 3.10-4.14 | 52.97 | 48.34-57.60 | 2.24 | 2.08-2.39 |
| ≥70 y | 170.89 | 161.93-179.84 | 1.77 | 1.72-1.82 | 118.04 | 105.48-130.61 | 1.39 | 1.34-1.43 |
| Ischemic heart disease | ||||||||
| Total | 40.79 | 36.04-45.54 | 1.99 | 1.81-2.17 | 35.59 | 27.65-43.53 | 1.29 | 1.21-1.37 |
| 30-69 y | 7.72 | 6.28-9.16 | 4.07 | 2.97-5.18 | 23.38 | 20.26-26.5 | 2.15 | 1.93-2.37 |
| ≥70 y | 38.19 | 34.07-42.31 | 1.86 | 1.73-1.98 | 22.18 | 15.24-29.12 | 1.22 | 1.14-1.3 |
| Heart failure | ||||||||
| Total | 34.88 | 30.69-39.06 | 2.06 | 1.86-2.27 | 17.43 | 12.48-22.37 | 1.39 | 1.25-1.53 |
| 30-69 y | 2.57 | 1.68-3.45 | 4.25 | 2.12-6.38 | 3.97 | 2.62-5.32 | 2.10 | 1.57-2.62 |
| ≥70 y | 34.65 | 30.86-38.44 | 1.89 | 1.76-2.03 | 17.90 | 13.16-22.64 | 1.43 | 1.29-1.57 |
| Cerebrovascular | ||||||||
| Total | 40.31 | 34.98-45.64 | 1.79 | 1.63-1.94 | 45.42 | 39.36-51.49 | 1.69 | 1.56-1.82 |
| 30-69 y | 5.90 | 4.39-7.41 | 2.77 | 2.03-3.50 | 10.88 | 9.01-12.75 | 2.85 | 2.33-3.36 |
| ≥70 y | 39.78 | 35.37-44.18 | 1.74 | 1.63-1.84 | 41.72 | 35.71-47.73 | 1.66 | 1.54-1.78 |
95%CI, 95% confidence interval. Spanish national data from 2015. The relative inequality index (RII) is the relative mortality risk between the lowest and highest educational levels. The slope index of inequality (SII) is the absolute difference in mortality between these population groups. For example, the RII for total cardiovascular mortality in women was 1.88, indicating that women with a low educational level had 88% higher mortality than those with a high educational level. The SII of 178.46 indicates that there were almost 180 more cardiovascular deaths per 100 000 women in the lowest educational level population than among women with the highest educational level.
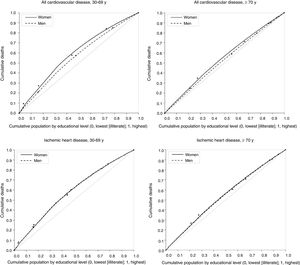
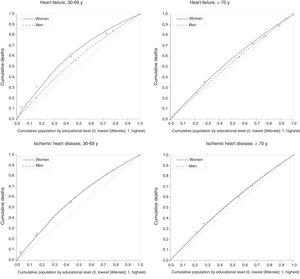
Inequalities in all-cause cardiovascular mortality were greater in the 30 to 69-year age group, where RII was 3.62 (95%CI, 3.10-4.14) in women and 2.24 (95%CI, 2.08-2.39) in men; however, absolute differences (SII) for this age group were greater in men (table 3). The same distribution was found for ischemic heart disease and heart failure, with RII> 4 in women and> 2 in men. In contrast, education-related inequality in cerebrovascular mortality was similar in both sexes, with RII=1.79 (95%CI, 1.63-1.94) in women and 1.69 (95%CI, 1.56-1.82) in men. SII for cerebrovascular mortality was also similar in men and women, except in the 30-69-year age group, where inequality was greater in men.
Health inequality concentration curves illustrate the concentration of cardiovascular deaths in the population with a lower educational level (figure 1 and figure 2). For example, among those aged 30 to 69 years, 65% of all-cause CVD and ischemic heart disease deaths in women and almost 60% of deaths for these causes in men occurred in the 50% of the population with a lower educational level (figure 1).
 as a function of educational level in men and women and different age groups. Spain, 2015.")
 as a function of educational level in men and women and different age groups. Spain, 2015.")
The results of this study reveal high social inequality in CVD mortality in Spain. Inequality linked to educational level was more pronounced in women, most notably in relation to cardiac causes and among those dying between the ages of 39 and 69 years (premature mortality).
A disproportionately high level of health inequality in women was also recorded in the only previous nationwide Spanish analysis of the effect of educational differences on mortality, which examined cohorts recruited in 2001 and followed up for 7 years.2 That study showed larger absolute and relative inequalities (SII and RII) for women in all-cause cardiovascular mortality and ischemic heart disease, although the relative values were slightly lower than in the present study. The earlier study also found that education-related inequalities in cerebrovascular mortality were similar in men and women, with RII values close to those reported here (1.92 [95%CI, 1.85-1.99] in women and 1.70 [95%CI, 1.65-1.76] in men).
The Spanish National Health System minimizes any contribution of unequal health care access to social inequalities in CVD mortality,20,21and therefore the greater social inequality in cardiovascular mortality in women in Spain is generally considered to reflect inequality in the distribution of cardiovascular risk factors.2–6 Nevertheless, diagnostic and therapeutic strategies in CVD are known to differ between men and women, and these differences generally disadvantage women.22 It is worth inquiring if these differences are more pronounced for socially disadvantaged women.
European comparisons have revealed relatively small social inequalities in overall mortality in Spain; this is mainly due to lower inequality in CVD mortality in men and in cancer mortality in women, and these differences are linked to greater equality in the distribution of risk factors between populations with the highest and lowest educational levels.11–14 Within Spain, several nationwide studies have confirmed that social inequalities in classic risk-factor prevalence are more pronounced in women. In the ENRICA study,23,24 socioeconomic inequalities in metabolic syndrome were larger in women, as were inequalities in obesity, hypertension, and diabetes in the population aged 60 years and older.25 A local Spanish study found greater socioeconomic inequality for women in cardiovascular risk factors, including obesity, hypertension, and low levels of high-density lipoprotein cholesterol.26 Differences in smoking would appear to contribute little to social inequalities in cardiovascular mortality because smoking-related inequalities are generally greater for men, and among older women smoking prevalence correlates directly with socioeconomic level.25 Prevention efforts should nevertheless focus on young women of low socioeconomic level, the demographic in which the smoking epidemic is growing.27–29
Social inequalities in mortality cannot, however, be entirely attributed to the unequal distribution of risk factors. In social determinants of health theory, lifestyle choices are merely intermediary determinants within a more complex social causality and are interpreted as yet one more consequence of that causality.25 Indeed, some authors criticize the current single-level model of risk factors because it emphasizes the effect of lifestyle factors without considering how they are determined by an individual's social environment.30 This is an important omission because social disadvantage and a lack of control of life circumstances have been linked to anxiety and chronic biological stress, which are contributing factors in metabolic syndrome and death due to CVD.31,32
A recent meta-analysis of data from 1.7 million people in 48 cohorts33 concluded that low socioeconomic level reduces life expectancy independently of the presence of 6 classic risk factors: those with a lower socioeconomic level had a greater risk of dying, and this association was independent of the classic risk factors. Moreover, low socioeconomic level accounted for a higher proportion of mortality in the study population than hypertension, obesity, and high alcohol consumption. A Spanish case-control study analyzed the same association for acute myocardial infarction, concluding that the lower educational level group had a higher mortality risk independently of other risk factors34; moreover, another local study showed that hypertension, diabetes, obesity and other classic risk factors explained only 26% of the association between educational level and the incidence of CVD.35
Several studies indicate that women are more vulnerable to the deleterious effects of risk factors and low socioeconomic status, which would partly explain the greater inequality in mortality found in women. A cohort analysis of the interaction between educational attainment and health behaviors showed that behavioral risk factors, especially smoking, mediate mortality both through the level of exposure and through differences in vulnerability, which is higher in women.36
Those results are compatible with disadvantaged young women being the most vulnerable in terms of both socioeconomic status and health. This may contribute to the persistence of gender inequality, whose manifestations include a higher workload than men (unpaid care work in the home in addition to paid workplace employment), as well as greater job insecurity, lower salaries, and fewer leadership positions. Moreover, an intersectional perspective would suggest that the same inequalities might characterize the position of young women with low socioeconomic status relative to older and more socioeconomically advantaged women.37–40
LimitationsThis was a cross-section study, and the lack of longitudinal data did not permit analysis of how interaction between social inequalities and CVD mortality changes over time. Lack of available data also precluded analysis of the influence of adjustment variables such as cardiovascular risk factors. Likewise, although educational level is a more robust, universal, and comparable index of socioeconomic level than income or occupation, it is by no means the only determinant of social inequality. Indeed, educational attainment may be more weakly associated with mortality than some other social determinants because it tends not to change as individuals age and may not represent current social status.41 Moreover, the significance of educational level is not the same in each generation; in the context of the expansion in education over the past decades, younger individuals with a low educational level are more socially marginalized than their counterparts from previous generations.42
CONCLUSIONSCardiovascular mortality is inversely associated with educational level in Spain. This inequality is higher for premature mortality due to cardiac causes (ischemic heart disease and heart failure), especially among women. Monitoring this problem could guide the National Health System's Cardiovascular Health Strategy and help to reduce inequality in the leading cause of death in Spain.
CONFLICTS OF INTERESTNone declared.
- –
Age, sex, and educational level are important determinants of cardiovascular mortality that interact with one another.
- –
Despite this, no previous Spanish study has undertaken a comprehensive analysis of social inequalities in cardiovascular mortality from an intersectional perspective that considers the combined influence of age, sex, and educational level.
- –
Cardiovascular mortality in Spain in 2015 was inversely associated with educational level.
- –
Inequality was highest for premature mortality due to all-cause cardiovascular disease, ischemic heart disease, and heart failure, especially in women.
Supplementary data associated with this article can be found in the online version, at https://doi.org/10.1016/j.rec.2019.07.022