Although it is known that social factors may introduce inequalities in cardiovascular health, data on the role of socioeconomic differences in the prescription of preventive treatment are scarce. We aimed to assess the relationship between the socioeconomic status of an elderly population at high cardiovascular risk and inequalities in receiving primary cardiovascular treatment, within the context of a universal health care system.
MethodsCross-sectional study of 7447 individuals with high cardiovascular risk (57.5% women, mean age 67 years) who participated in the PREDIMED study, a clinical trial of nutritional interventions for cardiovascular prevention. Educational attainment was used as the indicator of socioeconomic status to evaluate differences in pharmacological treatment received for hypertension, diabetes, and dyslipidemia.
ResultsParticipants with the lowest socioeconomic status were more frequently women, older, overweight, sedentary, and less adherent to the Mediterranean dietary pattern. They were, however, less likely to smoke and drink alcohol. This socioeconomic subgroup had a higher proportion of coexisting cardiovascular risk factors. Multivariate analysis of the whole population found no differences between participants with middle and low levels of education in the drug treatment prescribed for 3 major cardiovascular risk factors (odds ratio [95% confidence interval]): hypertension (0.75 [0.56-1.00] vs 0.85 [0.65-1.10]); diabetic participants (0.86 [0.61-1.22] vs 0.90 [0.67-1.22]); and dyslipidemia (0.93 [0.75-1.15] vs 0.99 [0.82-1.19], respectively).
ConclusionsIn our analysis, socioeconomic differences did not affect the treatment prescribed for primary cardiovascular prevention in elderly patients in Spain. Free, universal health care based on a primary care model can be effective in reducing health inequalities related to socioeconomic status.
Keywords
Cardiovascular diseases (CVD) continue to be the leading cause of death and disability worldwide, representing 30% of all deaths.1 The impact of the main risk factors (smoking, hypertension, dyslipidemia, and diabetes mellitus [DM]) on this public health issue is well known. It has been estimated that 972 million people suffer from hypertension2 and 366 million from DM.3 The World Health Organization estimates that dyslipidemia is associated with more than half of all cases of ischemic heart disease and more than 4 million deaths per year.4 It is well known that the elderly population has a higher incidence of CVD and a worse prognosis.5 The population aged 65 and older in the United States has more than doubled, from 35 million in 2000 to 71 million in 2030, while the worldwide population aged 65 and older is projected to increase from 420 million to 973 million during 2000-2030.6 Although researchers are increasingly interested in the study of multimorbidity and related determinants in this age group, this population is usually underrepresented in clinical trials.7,8 Socioeconomic or demographic factors are among the many factors that have been associated with unequal access to health care services, which can produce inequalities in the diagnosis, treatment, and management of CVD risk factors.9,10 Low socioeconomic status (SES) is directly related to a higher risk of CVD.11,12 In a previous study carried out in patients with established coronary heart disease, we found no inequalities in cardiovascular prevention related to SES in Spain's health care system, which provides free, universal coverage.13 The present study aimed to assess the relationship between SES and health inequalities for CVD prevention treatment in patients at high cardiovascular risk who have not yet developed CVD, within the context of a universal, free health care system.
METHODSStudy DesignWe conducted a cross-sectional study using baseline data from the PREDIMED study, a trial aimed at assessing the effects of the traditional Mediterranean diet on the primary prevention of CVD. Details of the protocol have been described elsewhere14 and are available online.15 Briefly, the PREDIMED study involved long-term follow-up of 7447 participants (55-80 years of age) at high cardiovascular risk, but with no CVD at enrollment. Participants were included during 2003 to 2009, and follow-up ended in December 2010. All patients were assigned to one of 3 diets: traditional Mediterranean diet supplemented with extra-virgin olive oil, traditional Mediterranean diet supplemented with mixed nuts, or a low-fat diet (used as control group receiving advice to reduce dietary fat). Primary endpoints were myocardial infarction and stroke; secondary endpoints were death from any cause, heart failure, DM, major cancers, dementia, or other neurodegenerative disorders. The main inclusion criteria were age (women 60-80 years old and men 55-80 years old) with either type-2 DM or 3 or more cardiovascular risk factors: smoking, hypertension, elevated low-density lipoprotein cholesterol levels, low high-density lipoprotein cholesterol levels, overweight or obesity, or a family history of premature CVD. A total of 8713 participants were assessed for eligibility, of which 973 (11.1%) declined to participate and 293 (3.3%) were excluded for not meeting inclusion criteria.
PREDIMED participants were selected from the clinical records of primary care centers; eligible subjects were contacted by a health professional and invited to participate.
Researchers explained the study aims and interventions to potential participants. Signed informed consent was obtained. Participants were randomized to one of the 3 diet groups by a computer-generated random number sequence. At baseline, all participants underwent a medical examination; general practitioners were not informed of participants’ group assignment. Variables were collected from medical records, clinical evaluation, and face-to-face interviews. Validated questionnaires were administered in order to obtain data on nutritional habits16,17 and physical exercise.18 Samples for laboratory tests were obtained. Information regarding pharmacological treatment was obtained by interview and confirmed by consulting electronic medical records. The study protocol was approved by the institutional review board of Hospital Clínic (Barcelona, Spain).The trial is registered.19
The present study is a cross-sectional analysis of baseline data from all 7447 PREDIMED study participants. Medical diagnostic criteria for hypertension, DM, and dyslipidemia were applied to identify participants according to these risk factors.
Outcomes MeasuredSocioeconomic StatusWe considered educational attainment as a socioeconomic indicator because it remains unchanged throughout life, and directly or indirectly affects an individual's adoption of health behaviors and their outcomes.20 Educational level was grouped into three categories: high level (university education); middle level (secondary education, up to 16–18 years); and low level (no education or only primary school).
Treatment AssessmentWe evaluated receipt of the treatment indicated according to the risk factor(s) present (hypertension, DM, dyslipidemia), defined as follows:
- •
Participants with hypertension: prescribed at least one antihypertensive drug, including angiotensin-converting-enzyme inhibitors, diuretics, calcium channel blockers, angiotensin receptor blockers, beta-blockers, alpha-blockers, or other(s).
- •
Participants with diabetes: prescribed insulin or/and oral hypoglycemic drugs.
- •
Participants with dyslipidemia: prescribed statins and/or fibrates.
- •
Participants with several cardiovascular risk factors: prescribed pharmacological treatment corresponding to the cardiovascular risk factors presented.
Age, sex, smoking habits, body mass index, adherence to the Mediterranean diet pattern, physical activity, and alcohol intake.
Statistical AnalysisDescriptive analysis of categorical variables was expressed as percentages and of quantitative variables as mean (standard deviation). Bivariate analyses included chi square tests for categorical variables and analysis of variance F-test for continuous variables. The crude and adjusted association between the outcomes (treatment received for DM, hypertension, and dyslipidemia) and educational level were performed using logistic regression. Multivariate analysis of treatment received in relation to educational level was performed by “ENTER method” adjusting for variables with a clinical and epidemiological relationship to receiving treatment in primary cardiovascular prevention and/or to educational level: sex, age, body weight, smoking, physical activity, alcohol intake, hypertension, DM, and dyslipidemia. Due to a lower educational level among women participants compared to men, we evaluated the interaction of educational level and sex related to the treatment received. All statistical tests had an alpha level<0.05 and a 95% confidence interval (95%CI). The Hosmer-Lemeshow test was used to assess the goodness of fit for multivariate models. The Statistical Package for the Social Sciences (SPSS) 17.0 software was used for all analyses.
RESULTSA total of 7447 patients were included. Mean age was 67.0 (6.2) and 57.5% of the participants were women. Only 7.2% of the participants had attained a university education. At baseline, 81.2% (N=6041) of participants had hypertension; 47.7% (N=3553) DM, and 71.0% (N=5285) dyslipidemia.
Among participants with hypertension, 81.4% (n=4922) received antihypertensive drugs; 66.5% of diabetic patients (n=2362) were prescribed insulin or oral antidiabetic agents, and 59.3% of patients with dyslipidemia (n=3132) received lipid-lowering therapy.
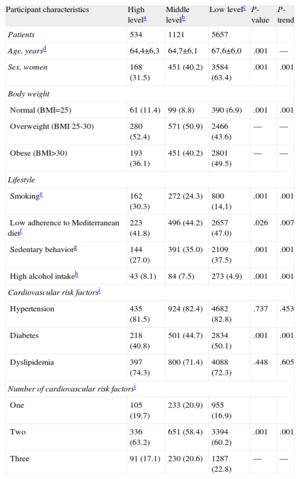
Participants in the lower educational level group were more frequently women, older, obese, less physically active, and had a lower adherence to the Mediterranean diet. Participants with a higher educational level were more often smokers and consumed more alcohol. Both the prevalence of DM and the proportion having 3 cardiovascular risk factors were higher in the lower educational level group (Table 1).
Characteristics of Study Participants (N=7447) According to Educational Attainment
| Participant characteristics | High levela | Middle levelb | Low levelc | P-value | P-trend |
| Patients | 534 | 1121 | 5657 | ||
| Age, yearsd | 64,4±6,3 | 64,7±6,1 | 67,6±6,0 | .001 | — |
| Sex, women | 168 (31.5) | 451 (40.2) | 3584 (63.4) | .001 | .001 |
| Body weight | |||||
| Normal (BMI=25) | 61 (11.4) | 99 (8.8) | 390 (6.9) | .001 | .001 |
| Overweight (BMI 25-30) | 280 (52.4) | 571 (50.9) | 2466 (43.6) | — | — |
| Obese (BMI>30) | 193 (36.1) | 451 (40.2) | 2801 (49.5) | — | — |
| Lifestyle | |||||
| Smokinge | 162 (30.3) | 272 (24.3) | 800 (14,1) | .001 | .001 |
| Low adherence to Mediterranean dietf | 223 (41.8) | 496 (44.2) | 2657 (47.0) | .026 | .007 |
| Sedentary behaviorg | 144 (27.0) | 391 (35.0) | 2109 (37.5) | .001 | .001 |
| High alcohol intakeh | 43 (8.1) | 84 (7.5) | 273 (4.9) | .001 | .001 |
| Cardiovascular risk factorsi | |||||
| Hypertension | 435 (81.5) | 924 (82.4) | 4682 (82.8) | .737 | .453 |
| Diabetes | 218 (40.8) | 501 (44.7) | 2834 (50.1) | .001 | .001 |
| Dyslipidemia | 397 (74.3) | 800 (71.4) | 4088 (72.3) | .448 | .605 |
| Number of cardiovascular risk factorsi | |||||
| One | 105 (19.7) | 233 (20.9) | 955 (16.9) | ||
| Two | 336 (63.2) | 651 (58.4) | 3394 (60.2) | .001 | .001 |
| Three | 91 (17.1) | 230 (20.6) | 1287 (22.8) | — | — |
BMI, body mass index
Unless otherwise indicated, data are expressed as no. (%)
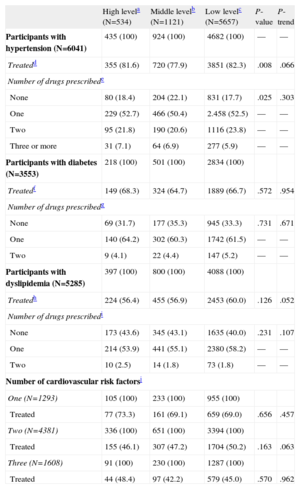
Participants with hypertension, DM, and a low educational level had more probability of receiving antihypertensive and lipid-lowering therapy. Participants with a low educational level and at least 2 cardiovascular risk factors were more likely to be treated (P=.063). In participants with dyslipidemia and in those with either 1 or 3cardiovascular risk factors, we observed no relationship between receiving treatment and educational level (Table 2).
Pharmacological Treatment Received for Cardiovascular Risk Factors According to Educational Attainment
| High levela (N=534) | Middle levelb (N=1121) | Low levelc (N=5657) | P-value | P-trend | |
| Participants with hypertension (N=6041) | 435 (100) | 924 (100) | 4682 (100) | — | — |
| Treatedd | 355 (81.6) | 720 (77.9) | 3851 (82.3) | .008 | .066 |
| Number of drugs prescribede | |||||
| None | 80 (18.4) | 204 (22.1) | 831 (17.7) | .025 | .303 |
| One | 229 (52.7) | 466 (50.4) | 2.458 (52.5) | — | — |
| Two | 95 (21.8) | 190 (20.6) | 1116 (23.8) | — | — |
| Three or more | 31 (7.1) | 64 (6.9) | 277 (5.9) | — | — |
| Participants with diabetes (N=3553) | 218 (100) | 501 (100) | 2834 (100) | ||
| Treatedf | 149 (68.3) | 324 (64.7) | 1889 (66.7) | .572 | .954 |
| Number of drugs prescribedg | |||||
| None | 69 (31.7) | 177 (35.3) | 945 (33.3) | .731 | .671 |
| One | 140 (64.2) | 302 (60.3) | 1742 (61.5) | — | — |
| Two | 9 (4.1) | 22 (4.4) | 147 (5.2) | — | — |
| Participants with dyslipidemia (N=5285) | 397 (100) | 800 (100) | 4088 (100) | ||
| Treatedh | 224 (56.4) | 455 (56.9) | 2453 (60.0) | .126 | .052 |
| Number of drugs prescribedi | |||||
| None | 173 (43.6) | 345 (43.1) | 1635 (40.0) | .231 | .107 |
| One | 214 (53.9) | 441 (55.1) | 2380 (58.2) | — | — |
| Two | 10 (2.5) | 14 (1.8) | 73 (1.8) | — | — |
| Number of cardiovascular risk factorsj | |||||
| One (N=1293) | 105 (100) | 233 (100) | 955 (100) | ||
| Treated | 77 (73.3) | 161 (69.1) | 659 (69.0) | .656 | .457 |
| Two (N=4381) | 336 (100) | 651 (100) | 3394 (100) | ||
| Treated | 155 (46.1) | 307 (47.2) | 1704 (50.2) | .163 | .063 |
| Three (N=1608) | 91 (100) | 230 (100) | 1287 (100) | ||
| Treated | 44 (48.4) | 97 (42.2) | 579 (45.0) | .570 | .962 |
Prescribed at least one of following antihypertensive drugs: angiotensin-converting-enzyme inhibitors, diuretics, calcium channel blockers, angiotensin receptor blockers, beta blockers, alpha blockers, or other antihypertensive drugs.
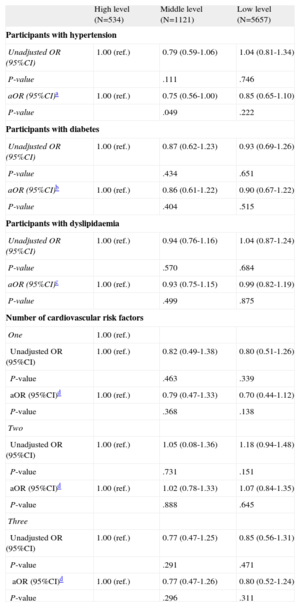
Multivariate analysis did not show any relationship between treatment received and educational level (Table 3). Only participants with a middle educational level were less likely to be treated for hypertension (P=.049).
Odds Ratio of Receiving Treatment for Cardiovascular Risk Factors According to Educational Attainment
| High level (N=534) | Middle level (N=1121) | Low level (N=5657) | |
| Participants with hypertension | |||
| Unadjusted OR (95%CI) | 1.00 (ref.) | 0.79 (0.59-1.06) | 1.04 (0.81-1.34) |
| P-value | .111 | .746 | |
| aOR (95%CI)a | 1.00 (ref.) | 0.75 (0.56-1.00) | 0.85 (0.65-1.10) |
| P-value | .049 | .222 | |
| Participants with diabetes | |||
| Unadjusted OR (95%CI) | 1.00 (ref.) | 0.87 (0.62-1.23) | 0.93 (0.69-1.26) |
| P-value | .434 | .651 | |
| aOR (95%CI)b | 1.00 (ref.) | 0.86 (0.61-1.22) | 0.90 (0.67-1.22) |
| P-value | .404 | .515 | |
| Participants with dyslipidaemia | |||
| Unadjusted OR (95%CI) | 1.00 (ref.) | 0.94 (0.76-1.16) | 1.04 (0.87-1.24) |
| P-value | .570 | .684 | |
| aOR (95%CI)c | 1.00 (ref.) | 0.93 (0.75-1.15) | 0.99 (0.82-1.19) |
| P-value | .499 | .875 | |
| Number of cardiovascular risk factors | |||
| One | 1.00 (ref.) | ||
| Unadjusted OR (95%CI) | 1.00 (ref.) | 0.82 (0.49-1.38) | 0.80 (0.51-1.26) |
| P-value | .463 | .339 | |
| aOR (95%CI)d | 1.00 (ref.) | 0.79 (0.47-1.33) | 0.70 (0.44-1.12) |
| P-value | .368 | .138 | |
| Two | |||
| Unadjusted OR (95%CI) | 1.00 (ref.) | 1.05 (0.08-1.36) | 1.18 (0.94-1.48) |
| P-value | .731 | .151 | |
| aOR (95%CI)d | 1.00 (ref.) | 1.02 (0.78-1.33) | 1.07 (0.84-1.35) |
| P-value | .888 | .645 | |
| Three | |||
| Unadjusted OR (95%CI) | 1.00 (ref.) | 0.77 (0.47-1.25) | 0.85 (0.56-1.31) |
| P-value | .291 | .471 | |
| aOR (95%CI)d | 1.00 (ref.) | 0.77 (0.47-1.26) | 0.80 (0.52-1.24) |
| P-value | .296 | .311 | |
95%CI, 95% confidence interval; aOR, adjusted odds ratio; OR, odds ratio; ref., reference.
Adjusted by sex, age, body weight, smoking, adherence to the Mediterranean diet, physical activity, alcohol intake, diabetes, and dyslipidemia.
Adjusted by sex, age, body weight, smoking, adherence to the Mediterranean diet, physical activity, alcohol intake, hypertension and dyslipidemia.
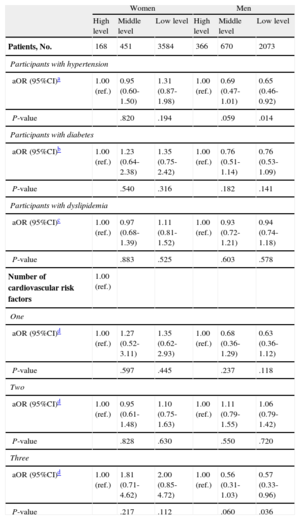
When the analysis was stratified by sex (Table 4), we observed that men with the lowest educational level had a 35% lower probability of receiving treatment for their hypertension than did participants at the highest level (odds ratio [OR]=0.65 [95%CI, 0.46-0.92]).No socioeconomic differences were observed for the other cardiovascular risk factors (DM, dyslipidemia) studied.
Odds Ratio of Receiving Treatment for Cardiovascular Risk Factors According to Educational Level, Stratified by Sex
| Women | Men | |||||
| High level | Middle level | Low level | High level | Middle level | Low level | |
| Patients, No. | 168 | 451 | 3584 | 366 | 670 | 2073 |
| Participants with hypertension | ||||||
| aOR (95%CI)a | 1.00 (ref.) | 0.95 (0.60-1.50) | 1.31 (0.87-1.98) | 1.00 (ref.) | 0.69 (0.47-1.01) | 0.65 (0.46-0.92) |
| P-value | .820 | .194 | .059 | .014 | ||
| Participants with diabetes | ||||||
| aOR (95%CI)b | 1.00 (ref.) | 1.23 (0.64-2.38) | 1.35 (0.75-2.42) | 1.00 (ref.) | 0.76 (0.51-1.14) | 0.76 (0.53-1.09) |
| P-value | .540 | .316 | .182 | .141 | ||
| Participants with dyslipidemia | ||||||
| aOR (95%CI)c | 1.00 (ref.) | 0.97 (0.68-1.39) | 1.11 (0.81-1.52) | 1.00 (ref.) | 0.93 (0.72-1.21) | 0.94 (0.74-1.18) |
| P-value | .883 | .525 | .603 | .578 | ||
| Number of cardiovascular risk factors | 1.00 (ref.) | |||||
| One | ||||||
| aOR (95%CI)d | 1.00 (ref.) | 1.27 (0.52-3.11) | 1.35 (0.62-2.93) | 1.00 (ref.) | 0.68 (0.36-1.29) | 0.63 (0.36-1.12) |
| P-value | .597 | .445 | .237 | .118 | ||
| Two | ||||||
| aOR (95%CI)d | 1.00 (ref.) | 0.95 (0.61-1.48) | 1.10 (0.75-1.63) | 1.00 (ref.) | 1.11 (0.79-1.55) | 1.06 (0.79-1.42) |
| P-value | .828 | .630 | .550 | .720 | ||
| Three | ||||||
| aOR (95%CI)d | 1.00 (ref.) | 1.81 (0.71-4.62) | 2.00 (0.85-4.72) | 1.00 (ref.) | 0.56 (0.31-1.03) | 0.57 (0.33-0.96) |
| P-value | .217 | .112 | .060 | .036 | ||
95%CI, 95% confidence interval; aOR, adjusted odds ratio; ref., reference.
Adjusted by age, body weight, smoking, adherence to the Mediterranean diet, physical activity, alcohol intake, diabetes, and dyslipidemia.
Adjusted by age, body weight, smoking, adherence to the Mediterranean diet, physical activity, alcohol intake, hypertension, and dyslipidemia.
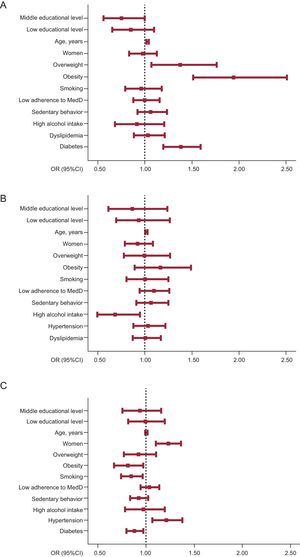
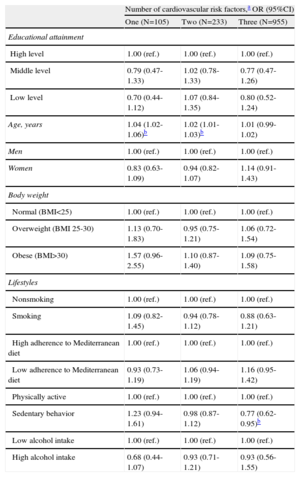
Figure presents the adjusted OR (95%CI) for receiving treatment for each of the cardiovascular risks factors. Table 5 shows the probability of receiving treatment depending on number of cardiovascular risk factors.

Adjusted odds ratios for all participant characteristics of receiving treatment, for each cardiovascular risk factor. A: hypertension. B: diabetes. C: dyslipidemia. Squares represent odds ratios of receiving pharmacological treatment. Horizontal lines indicate 95% confidence intervals. Vertical lines signify odds ratio=1. The following were the reference categories for the variables tested in different models: educational attainment, high level; sex, men; body weight, normal weight. Reference categories for lifestyle were non-smoking, high adherence to Mediterranean diet, physically active, and low alcohol intake, and for cardiovascular risk: no hypertension, no diabetes, and no dyslipidemia. 95%CI, 95% confidence interval; MedD, Mediterranean diet; OR, odds ratio.
Adjusted Odds Ratio for All Participant Characteristics of Receiving Treatment, by Number of Cardiovascular Risk Factors
| Number of cardiovascular risk factors,a OR (95%CI) | |||
| One (N=105) | Two (N=233) | Three (N=955) | |
| Educational attainment | |||
| High level | 1.00 (ref.) | 1.00 (ref.) | 1.00 (ref.) |
| Middle level | 0.79 (0.47-1.33) | 1.02 (0.78-1.33) | 0.77 (0.47-1.26) |
| Low level | 0.70 (0.44-1.12) | 1.07 (0.84-1.35) | 0.80 (0.52-1.24) |
| Age, years | 1.04 (1.02-1.06)b | 1.02 (1.01-1.03)b | 1.01 (0.99-1.02) |
| Men | 1.00 (ref.) | 1.00 (ref.) | 1.00 (ref.) |
| Women | 0.83 (0.63-1.09) | 0.94 (0.82-1.07) | 1.14 (0.91-1.43) |
| Body weight | |||
| Normal (BMI<25) | 1.00 (ref.) | 1.00 (ref.) | 1.00 (ref.) |
| Overweight (BMI 25-30) | 1.13 (0.70-1.83) | 0.95 (0.75-1.21) | 1.06 (0.72-1.54) |
| Obese (BMI>30) | 1.57 (0.96-2.55) | 1.10 (0.87-1.40) | 1.09 (0.75-1.58) |
| Lifestyles | |||
| Nonsmoking | 1.00 (ref.) | 1.00 (ref.) | 1.00 (ref.) |
| Smoking | 1.09 (0.82-1.45) | 0.94 (0.78-1.12) | 0.88 (0.63-1.21) |
| High adherence to Mediterranean diet | 1.00 (ref.) | 1.00 (ref.) | 1.00 (ref.) |
| Low adherence to Mediterranean diet | 0.93 (0.73-1.19) | 1.06 (0.94-1.19) | 1.16 (0.95-1.42) |
| Physically active | 1.00 (ref.) | 1.00 (ref.) | 1.00 (ref.) |
| Sedentary behavior | 1.23 (0.94-1.61) | 0.98 (0.87-1.12) | 0.77 (0.62-0.95)b |
| Low alcohol intake | 1.00 (ref.) | 1.00 (ref.) | 1.00 (ref.) |
| High alcohol intake | 0.68 (0.44-1.07) | 0.93 (0.71-1.21) | 0.93 (0.56-1.55) |
95%CI, 95% confidence interval; BMI, body mass index; OR: odds ratio; ref., reference.
Received corresponding pharmacological treatment considering their cardiovascular risks factors presented. Multivariate analysis including all variables into the entry mode for each number of cardiovascular risk factor presented.
Our study found no overall differences related to SES in the pharmacological treatment prescribed for primary cardiovascular prevention in an elderly population with high cardiovascular risk. Educational level was selected as an indicator of SES because it remains unchanged throughout life, influencing the adoption of lifestyles and the related health outcomes.20 The greater proportion of women and of older participants with the lowest educational levels may be due to the particular historical situation of Spain. University access was limited until the last third of the 20th century, especially for women.21 Higher tobacco and alcohol consumption observed at the upper educational levels in our sample is consistent with other studies in Spain, and is likely due to historical cultural patterns in this age group; these patterns are changing in younger populations.22 The lower physical activity, less healthy dietary patterns, higher prevalence of DM and obesity, and larger number of cardiovascular risk factors observed in participants with lower educational levels also agrees with previous studies from Spain and other countries.23–26
Only a few studies have analyzed inequalities in preventive cardiovascular treatment depending on SES. with controversial results that vary depending on the country and population studied.27,28 Results of the present study concur with our previous analysis of a general population aged 34 to 75 years, in which we did not observe differences related to SES in preventive treatment for CVD.29 Reasons for such homogeneity could be that patients with CVD are more highly monitored or, as has been shown in other studies,30 that men with lower SES received less treatment for their hypertension because they use primary care services less often than women.
Although the health of a population is not only determined by use of health services, the type of coverage may contribute to SES-related health inequalities in CVD prevention (eg, access to medical services at different levels).9,10,31 Health care systems based on strong primary care models could be more effective in reducing inequalities for socioeconomically disadvantaged people because resources are better distributed according to population needs.32 The day-to-day tasks of primary care include the provision of specific care for patients with chronic diseases through the implementation of systematic preventive programs. In the Spanish health care system, patients can visit their general practitioner as often as needed, and during the study period most retired people did not pay for their prescriptions (a “copayment” was imple-mented in July 2012). We did not find inequalities in preventive treatment based on SES in the elderly population studied, probably due to the higher utilization of primary care services by the population with lower educational levels, as reported by other studies.33,34
Strengths and LimitationsThe design of our study does not allow causal inferences. However, its cross-sectional approach permits the assessment of whether prescription differences exist in a population at high CVD, within the frame of a universal health care model.
One strength of our study is the large sample size used and the careful conduct of all measurements using standardized protocols. A potential limitation could be the possibility that some participants used private health care services and therefore were not fully evaluated by their assigned general practitioner. However, this possibility is slight because most of the included population had a low SES. Eligible participants who declined to participate may have had a different distribution of educational level; however, while this may affect the distribution of participants according to educational level it should not affect the comparison between groups. On the other hand, it is important to highlight that socioeconomic conditions in Spain have changed significantly in recent years. We do not consider this factor to have influenced the measure of SES used in our study because educational level is one of the more stable social determinants during adulthood. Changes in prescription “copayment” policies have occurred in Spain because of the financial crisis, but these were implemented after the study had concluded. Finally, the results of our study can only be extrapolated to the elderly population at high cardiovascular risk.
CONCLUSIONSOur study did not find that socioeconomic differences affected the treatment received for primary cardiovascular prevention in elderly patients in the context of a universal health care system based on a primary care model.
FUNDINGThis project has been funded by the Spanish Ministry of Health (Instituto de Salud Carlos III, Fondo de Investigaciones Sanitarias) projects PI051839, PI070240, PI070954, G03/140, RD06/0045 FEDER (Fondo Europeo de Desarrollo Regional) and CIBERobn (an initiative of Instituto de Salud Carlos III, Spain), and by the Patrimonio Comunal Olivarero, California Walnut Commission, Borges, La Morella Nuts, and Hojiblanca, which donated virgin olive oil and mixed nuts. Agencia Canaria de Investigación, Innovación y Sociedad de la Información-EU FEDER (PI 2007/050). None of these companies played or will play any role in the design, collection, analysis, or interpretation of the data or in the decision to submit manuscripts for publication.
CONFLICTS OF INTERESTDr. Estruch reports receiving lecture fees from FIVIN (Fundación para la Investigación del Vino y Nutrición) and serving on its scientific advisory board; receiving research grants from the Fundación Cerveza y Salud and serving on its scientific advisory board; and receiving lecturer fees from Sanofi-Aventis Laboratories. Dr. Salas-Salvadó reports receiving research funding from the International Nut and Dried Fruit Council, serving on its scientific advisory board, and receiving consultancy fees from Danone. Dr. Serra-Majem reports serving on the scientific advisory board of Fundación Dieta Mediterránea and Fundación Cerveza y Salud. No other co-authors have reported any potential conflict of interest relevant to this article.
We thank Stephanie Lonsdale for editing the paper in English.