To report the findings of the Spanish Implantable Cardioverter-defibrillator Registry for 2016 compiled by the Electrophysiology and Arrhythmias Section of the Spanish Society of Cardiology.
MethodsProspective data were voluntarily recorded on a data collection form and send to the Spanish Society of Cardiology by each implantation team.
ResultsOverall, 5673 device implantations were reported, representing 85% of the estimated total number of implantations. The reported implantation rate was 122 per million population and the estimated total implantation rate was 143 per million. The proportion of first implantations was 66.8%. Data were received from 177 hospitals (8 more than in 2015). Most implantable cardioverter-defibrillator recipients were men (81.9%). The mean age was 62.7 ± 13.4 years. Most patients had severe or moderate-to-severe ventricular dysfunction and were in New York Heart Association functional class II. The most frequent underlying cardiac condition was ischemic heart disease, followed by dilated cardiomyopathy. Indications for primary prevention accounted for 62% of first implantations. Overall, 81.2% of devices were implanted by cardiac electrophysiologists.
ConclusionsThe 2016 Spanish Implantable Cardioverter-defibrillator Registry includes information on 85% of the devices implanted in Spain. The total number of device implantations increased in comparison with the last few years. The percentage of implantations for primary prevention also increased in comparison with the previous year.
Keywords
Implantable cardioverter-defibrillators (ICDs) help to decrease overall mortality in primary and secondary prevention by reducing sudden cardiac death. The main indications for ICD implantation have been derived from numerous studies and have been included in the successive clinical management guidelines of patients with ventricular arrhythmias or at risk of sudden cardiac death.1–3 However, the increased use of ICDs has raised questions about their effectiveness outside the setting of clinical trials, about the real-world selection of patients for implantation, and about the availability, safety, and cost-effectiveness of this therapy.4 Thus, given the scarcity of information in the medical literature on these aspects and the application of the clinical guidelines to unselected patient populations, health care registries could be extremely useful.
The current study presents the data on ICD implantations reported to the Spanish Implantable Cardioverter-defibrillator Registry in 2016. Most Spanish centers implanting ICDs have contributed to the registry. Similar to previous annual reports, we review patients’ indications and clinical characteristics, implantation data, device type and programming, and intraprocedural complications. As in the previous official reports on this activity in Spain,1–15 this report has been prepared by the members of the Electrophysiology and Arrhythmia Section of the Spanish Society of Cardiology (Sociedad Española de Cardiología [SEC]).
METHODSThe registry data were obtained using a data collection form available at the SEC website.16 The form was completed directly and voluntarily by each implantation team during or after the procedure with the help of the technical staff of the ICD manufacturer.
The information was introduced into the database of the Spanish Implantable Cardioverter-defibrillator Registry by a specially appointed technician, with the help of a computer technician employed by the SEC and a member of the Electrophysiology and Arrhythmia Section. The computer technician and section member also performed data cleaning. The authors of this article analyzed the data and are responsible for this publication.
The census data for the distinct calculations of rates per million population, both national and by autonomous community and province, were obtained from the estimates of the Spanish National Institute of Statistics as of Friday, January 1, 2016.17
To estimate the representativeness of the registry, the proportion of implantations and replacements recorded in the registry was calculated with respect to the total number of implantations and replacements performed in Spain in 2016. This number was based on the data for 2016 reported to the European Confederation of Medical Suppliers Associations (Eucomed) by the suppliers of ICDs in Spain.18
If the data collection sheet recorded various clinical presentations or arrhythmias in the same patient, only the most serious condition was included in the analysis.
The percentages of each of the variables analyzed were calculated by taking into account the total number of implantations including information on the analysis variable.
Statistical AnalysisNumerical results are expressed as mean ± standard deviation or median [interquartile range], according to the distribution of the variable. Continuous quantitative variables were compared using analysis of variance or the Kruskal-Wallis test. Qualitative variables were compared using the chi-square test. The relationships between the number of implantations and the devices implanted per million population and the total number of implantations and the number of implantations for primary prevention in each center were studied using linear regression models.
RESULTSThe response rates to the distinct fields of the data collection sheet ranged from 90% for the field “name of the implanting hospital” to 41.8% for the field “hospital of origin”.
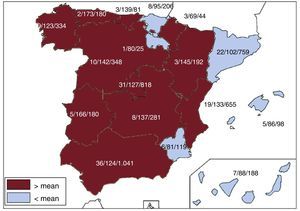
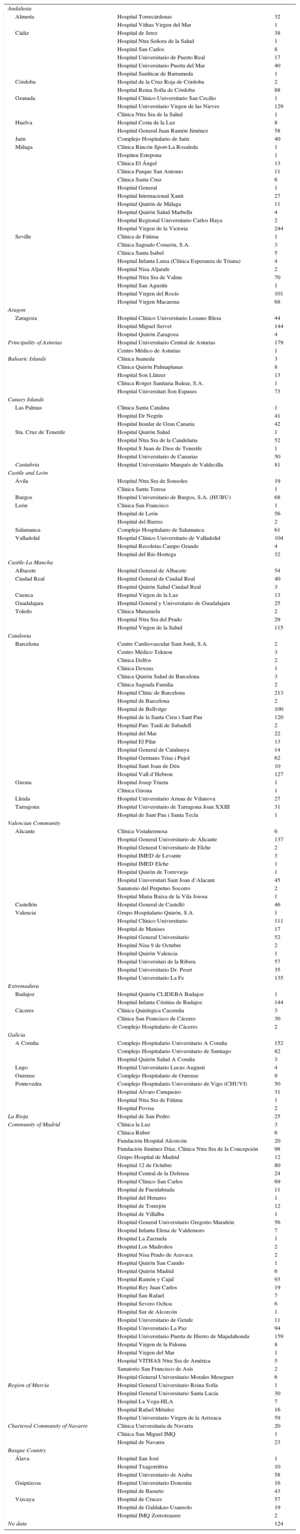
Implanting CentersA total of 177 hospitals performing ICD implantations reported their data to the registry (169 in 2015). The data from the 177 hospitals are shown in Table 1; 124 forms were excluded due to errors in the center records; 97 hospitals were public centers. The total number of implanting centers, rate per million population, and total number by autonomous community according to the data sent to the registry are shown in Figure 1. During 2016, only 18 centers implanted ≥ 100 devices; 87, ≤ 10; and 37, only 1.
Implantations by Autonomous Community, Province, and Hospital
| Andalusia | ||
| Almería | Hospital Torrecárdenas | 32 |
| Hospital Vithas Virgen del Mar | 1 | |
| Cádiz | Hospital de Jerez | 38 |
| Hospital Ntra Señora de la Salud | 1 | |
| Hospital San Carlos | 8 | |
| Hospital Universitario de Puerto Real | 17 | |
| Hospital Universitario Puerta del Mar | 40 | |
| Hospital Sanlúcar de Barrameda | 1 | |
| Córdoba | Hospital de la Cruz Roja de Córdoba | 2 |
| Hospital Reina Sofía de Córdoba | 88 | |
| Granada | Hospital Clínico Universitario San Cecilio | 1 |
| Hospital Universitario Virgen de las Nieves | 129 | |
| Clínica Ntra Sra de la Salud | 1 | |
| Huelva | Hospital Costa de la Luz | 8 |
| Hospital General Juan Ramón Jiménez | 58 | |
| Jaén | Complejo Hospitalario de Jaén | 40 |
| Málaga | Clínica Rincón Sport-La Rosaleda | 1 |
| Hospiten Estepona | 1 | |
| Clínica El Ángel | 13 | |
| Clínica Parque San Antonio | 11 | |
| Clínica Santa Cruz | 6 | |
| Hospital General | 1 | |
| Hospital Internacional Xanit | 27 | |
| Hospital Quirón de Málaga | 11 | |
| Hospital Quirón Salud Marbella | 4 | |
| Hospital Regional Universitario Carlos Haya | 2 | |
| Hospital Virgen de la Victoria | 244 | |
| Seville | Clínica de Fátima | 1 |
| Clínica Sagrado Corazón, S.A. | 3 | |
| Clínica Santa Isabel | 5 | |
| Hospital Infanta Luisa (Clínica Esperanza de Triana) | 4 | |
| Hospital Nisa Aljarafe | 2 | |
| Hospital Ntra Sra de Valme | 70 | |
| Hospital San Agustín | 1 | |
| Hospital Virgen del Rocío | 101 | |
| Hospital Virgen Macarena | 68 | |
| Aragon | ||
| Zaragoza | Hospital Clínico Universitario Lozano Blesa | 44 |
| Hospital Miguel Servet | 144 | |
| Hospital Quirón Zaragoza | 4 | |
| Principality of Asturias | Hospital Universitario Central de Asturias | 179 |
| Centro Médico de Asturias | 1 | |
| Balearic Islands | Clínica Juaneda | 3 |
| Clínica Quirón Palmaplanas | 8 | |
| Hospital Son Llàtzer | 13 | |
| Clínica Rotger Sanitaria Balear, S.A. | 1 | |
| Hospital Universitari Son Espases | 73 | |
| Canary Islands | ||
| Las Palmas | Clínica Santa Catalina | 1 |
| Hospital Dr Negrín | 41 | |
| Hospital Insular de Gran Canaria | 42 | |
| Sta. Cruz de Tenerife | Hospital Quirón Salud | 1 |
| Hospital Ntra Sra de la Candelaria | 52 | |
| Hospital S Juan de Dios de Tenerife | 1 | |
| Hospital Universitario de Canarias | 50 | |
| Cantabria | Hospital Universitario Marqués de Valdecilla | 81 |
| Castile and León | ||
| Ávila | Hospital Ntra Sra de Sonsoles | 19 |
| Clínica Santa Teresa | 1 | |
| Burgos | Hospital Universitario de Burgos, S.A. (HUBU) | 68 |
| León | Clínica San Francisco | 1 |
| Hospital de León | 56 | |
| Hospital del Bierzo | 2 | |
| Salamanca | Complejo Hospitalario de Salamanca | 61 |
| Valladolid | Hospital Clínico Universitario de Valladolid | 104 |
| Hospital Recoletas Campo Grande | 4 | |
| Hospital del Río Hortega | 32 | |
| Castile-La Mancha | ||
| Albacete | Hospital General de Albacete | 54 |
| Ciudad Real | Hospital General de Ciudad Real | 40 |
| Hospital Quirón Salud Ciudad Real | 3 | |
| Cuenca | Hospital Virgen de la Luz | 13 |
| Guadalajara | Hospital General y Universitario de Guadalajara | 25 |
| Toledo | Clínica Marazuela | 2 |
| Hospital Ntra Sra del Prado | 29 | |
| Hospital Virgen de la Salud | 115 | |
| Catalonia | ||
| Barcelona | Centre Cardiovascular Sant Jordi, S.A. | 2 |
| Centro Médico Teknon | 3 | |
| Clínica Delfos | 2 | |
| Clínica Dexeus | 1 | |
| Clínica Quirón Salud de Barcelona | 3 | |
| Clínica Sagrada Familia | 2 | |
| Hospital Clínic de Barcelona | 213 | |
| Hospital de Barcelona | 2 | |
| Hospital de Bellvitge | 100 | |
| Hospital de la Santa Creu i Sant Pau | 120 | |
| Hospital Parc Taulí de Sabadell | 2 | |
| Hospital del Mar | 22 | |
| Hospital El Pilar | 13 | |
| Hospital General de Catalunya | 14 | |
| Hospital Germans Trias i Pujol | 62 | |
| Hospital Sant Joan de Déu | 10 | |
| Hospital Vall d’Hebron | 127 | |
| Girona | Hospital Josep Trueta | 1 |
| Clínica Girona | 1 | |
| Lleida | Hospital Universitario Arnau de Vilanova | 27 |
| Tarragona | Hospital Universitario de Tarragona Joan XXIII | 31 |
| Hospital de Sant Pau i Santa Tecla | 1 | |
| Valencian Community | ||
| Alicante | Clínica Vistahermosa | 6 |
| Hospital General Universitario de Alicante | 137 | |
| Hospital General Universitario de Elche | 2 | |
| Hospital IMED de Levante | 3 | |
| Hospital IMED Elche | 1 | |
| Hospital Quirón de Torrevieja | 1 | |
| Hospital Universitari Sant Joan d’Alacant | 45 | |
| Sanatorio del Perpetuo Socorro | 2 | |
| Hospital Maria Baixa de la Vila Joiosa | 1 | |
| Castellón | Hospital General de Castelló | 46 |
| Valencia | Grupo Hospitalario Quirón, S.A. | 1 |
| Hospital Clínico Universitario | 111 | |
| Hospital de Manises | 17 | |
| Hospital General Universitario | 52 | |
| Hospital Nisa 9 de Octubre | 2 | |
| Hospital Quirón Valencia | 1 | |
| Hospital Universitari de la Ribera | 57 | |
| Hospital Universitario Dr. Peset | 35 | |
| Hospital Universitario La Fe | 135 | |
| Extremadura | ||
| Badajoz | Hospital Quirón CLIDEBA Badajoz | 1 |
| Hospital Infanta Cristina de Badajoz | 144 | |
| Cáceres | Clínica Quirúrgica Cacereña | 3 |
| Clínica San Francisco de Cáceres | 30 | |
| Complejo Hospitalario de Cáceres | 2 | |
| Galicia | ||
| A Coruña | Complejo Hospitalario Universitario A Coruña | 152 |
| Complejo Hospitalario Universitario de Santiago | 82 | |
| Hospital Quirón Salud A Coruña | 3 | |
| Lugo | Hospital Universitario Lucus Augusti | 4 |
| Ourense | Complejo Hospitalario de Ourense | 9 |
| Pontevedra | Complejo Hospitalario Universitario de Vigo (CHUVI) | 50 |
| Hospital Álvaro Cunqueiro | 31 | |
| Hospital Ntra Sra de Fátima | 1 | |
| Hospital Povisa | 2 | |
| La Rioja | Hospital de San Pedro | 25 |
| Community of Madrid | Clínica la Luz | 3 |
| Clínica Ruber | 6 | |
| Fundación Hospital Alcorcón | 20 | |
| Fundación Jiménez Díaz, Clínica Ntra Sra de la Concepción | 98 | |
| Grupo Hospital de Madrid | 12 | |
| Hospital 12 de Octubre | 80 | |
| Hospital Central de la Defensa | 24 | |
| Hospital Clínico San Carlos | 69 | |
| Hospital de Fuenlabrada | 11 | |
| Hospital del Henares | 1 | |
| Hospital de Torrejón | 12 | |
| Hospital de Villalba | 1 | |
| Hospital General Universitario Gregorio Marañón | 56 | |
| Hospital Infanta Elena de Valdemoro | 7 | |
| Hospital La Zarzuela | 1 | |
| Hospital Los Madroños | 2 | |
| Hospital Nisa Prado de Aravaca | 2 | |
| Hospital Quirón San Camilo | 1 | |
| Hospital Quirón Madrid | 6 | |
| Hospital Ramón y Cajal | 93 | |
| Hospital Rey Juan Carlos | 19 | |
| Hospital San Rafael | 7 | |
| Hospital Severo Ochoa | 6 | |
| Hospital Sur de Alcorcón | 1 | |
| Hospital Universitario de Getafe | 11 | |
| Hospital Universitario La Paz | 94 | |
| Hospital Universitario Puerta de Hierro de Majadahonda | 159 | |
| Hospital Virgen de la Paloma | 8 | |
| Hospital Virgen del Mar | 1 | |
| Hospital VITHAS Ntra Sra de América | 5 | |
| Sanatorio San Francisco de Asís | 2 | |
| Hospital General Universitario Morales Meseguer | 6 | |
| Region of Murcia | Hospital General Universitario Reina Sofía | 1 |
| Hospital General Universitario Santa Lucía | 30 | |
| Hospital La Vega-HLA | 7 | |
| Hospital Rafael Méndez | 16 | |
| Hospital Universitario Virgen de la Arrixaca | 59 | |
| Chartered Community of Navarre | Clínica Universitaria de Navarra | 20 |
| Clínica San Miguel IMQ | 1 | |
| Hospital de Navarra | 23 | |
| Basque Country | ||
| Álava | Hospital San José | 1 |
| Hospital Txagorrittxu | 10 | |
| Hospital Universitario de Araba | 58 | |
| Guipúzcoa | Hospital Universitario Donostia | 16 |
| Hospital de Basurto | 43 | |
| Vizcaya | Hospital de Cruces | 57 |
| Hospital de Galdakao-Usansolo | 19 | |
| Hospital IMQ Zorrotzaurre | 2 | |
| No data | 124 | |

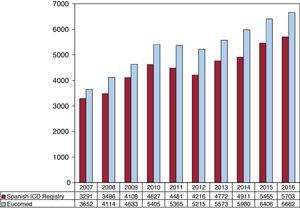
The total number of implantations (first implantations and replacements) in 2016 was 5673, more than in 2015 (total number, 5465). Because the Eucomed data18 showed a total number of devices of 6662, this figure represents 85% of the total. The total number of implantations reported to the registry and those estimated by Eucomed in the last 10 years are shown in Figure 2.
 from 2007 to 2016. ICD, implantable cardioverter-defibrillator.")
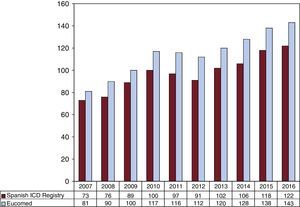
The overall rate of recorded implantations was 122 per million population; according to the Eucomed data, the rate was 143 per million population. The change in the implantation rate per million population during the last 10 years according to the registry and Eucomed data is shown in Figure 3. Implantations reported per implanting center are shown in Table 1.
 from 2007 to 2016. ICD, implantable cardioverter-defibrillator.")
The implanting hospital was recorded in 96% of cases. Most implantations (5069, 89.3%) were performed in public health care centers.
First Implantations vs ReplacementsThis information was available in 4557 forms sent to the SEC (80.6%). There were 3044 first implantations, representing 66.8% of the total (71.8% in 2015, 72.6% in 2014, 68.8% in 2013, 69.4% in 2012, 70.2% in 2011, and 73.8% in 2010). The rate of first implantations per million population was 65.5 (75.1 in 2015, 79.0 in 2014, 63.8 in 2013, and 64.0 in 2012).
Age and SexThe mean age ± standard deviation (range) of patients undergoing an ICD implantation or replacement was 62.7 ± 13.4 years (6-90 years) in 2016, compared with 62.8 ± 13.3 (6-98) in 2015 and 61.8 ± 13.7 years (7-94 years) in 2014. The mean age of first implantation patients was 61.2 ± 13.4 years. Most patients were men, who represented 81.9% of all patients and 82.4% of first implantation patients.
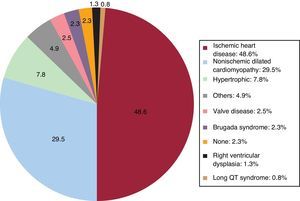
Underlying Heart Disease, Left Ventricular Ejection Fraction, Functional Class, and Baseline RhythmThe most frequent underlying cardiac condition in first implantation patients was ischemic heart disease (48.6%), followed by dilated cardiomyopathy (29.5%), hypertrophy (7.8%), primary conduction abnormalities (Brugada syndrome and long QT syndrome) (3.1%), valve diseases (2.5%), and arrhythmogenic dysplasias (1.3%) (Figure 4).
.")
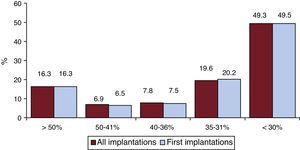
Left ventricular ejection fraction was > 50% in 16.3% of all registry patients, 41% to 50% in 6.5%, 36% to 40% in 7.5%, 31% to 35% in 20.2%, and < 30% in 49.5% (Figure 5). A similar distribution was seen in patients who underwent ICD replacement. These data were recorded in 68.6% of the data collection sheets of the registry.
.")
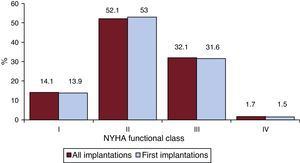
Most patients were in New York Heart Association (NYHA) functional class II (52.1%), followed by NYHA III (32.1%), NYHA I (14.1%), and IV (1.7%). For this parameter, the distribution was also similar between total implantations and first implantations (Figure 6), and these data were reported in 52.9% of the registry forms.
 functional class of the patients in the registry (total and first implantation).")
The baseline rhythm, reported in 45.9% of the patients, was largely sinus rhythm (80.4%), followed by atrial fibrillation (16.7%) and pacemaker rhythm (2.1%); the remaining patients had other rhythms (atrial flutter and other arrhythmias).
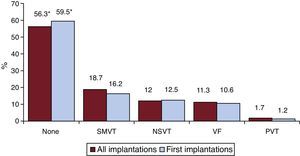
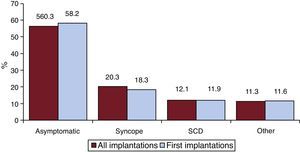
Clinical Arrhythmia Prompting Device Implantation, Its Form of Presentation, and the Arrhythmia Induced in the Electrophysiological StudyThese data were contained in 74.9% of the registry forms. For first implantations, most patients had no documented clinical arrhythmias (59.5%), followed by those with sustained monomorphic ventricular tachycardia, nonsustained ventricular tachycardia, and ventricular fibrillation (16.2%, 12.5%, and 10.6%, respectively). In total, patients with no documented clinical arrhythmia comprised 56.3% (Figure 7). The differences in the type of arrhythmia between the first implantation group and the total were not significant, except for those with no arrhythmia. The most frequent clinical presentation in both the total implantation group and the first implantation patients (66.3% and 72.8% of completed responses) was asymptomatic, followed by syncope, cardiac arrest, and “other symptoms” (Figure 8).
. NSVT, nonsustained ventricular tachycardia; PVT, polymorphic ventricular tachycardia; SMVT, sustained monomorphic ventricular tachycardia; VF, ventricular fibrillation. *P < .02.")
. SCD, sudden cardiac death.")
Data on electrophysiological studies were available for 2398 first implantation patients (78.8%). Such studies were performed in only 214 patients (8.9%). Sustained monomorphic ventricular tachycardia was the most common induced arrhythmia (44.8%), followed by nonsustained ventricular tachycardia (15.5%), ventricular fibrillation (11.5%) and, to a lesser extent, others (5.2%). No arrhythmia was induced in 23.0% of the electrophysiological studies. Most of these studies were performed in patients with ischemic heart disease or dilated cardiomyopathy.
Clinical HistoryData on the clinical history of patients have only been available since 2011 because such data were not recorded in previous years.
Responses to questions on clinical history were obtained for between 66.3% and 82.5% of first implantation patients. The most important findings related to cardiovascular risk factors and history were as follows: hypertension, 56.0%; hypercholesterolemia, 46.2%; smoking, 37.4%; diabetes mellitus, 30.8%; history of atrial fibrillation and family members with sudden cardiac death, 24.8%; kidney failure, 14.0%; and stroke, 9.0%.
The QRS width was recorded in 52.7% of the forms (mean, 125 ± 33ms). In 35.2% of the patients, the recorded width was > 140ms. Of these patients, 60.5% of the first implantation patients and 60.4% of the total had a defibrillator-resynchronization device (ICD-CRT [cardiac resynchronization therapy]).
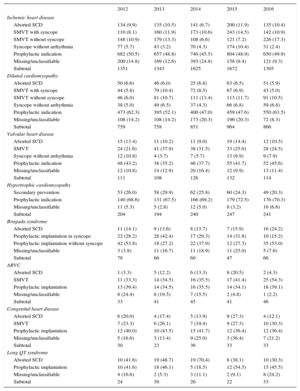
IndicationsThe changes in the type of heart disease and its presentation in first implantation patients from 2012 to 2016 are shown in Table 2. Data on this parameter were recorded in 53.3% of the registry collection sheets. For ischemic heart disease, the most frequent indication was primary prevention (49.9%), representing an increase from the previous year (48.9%) and from 2014 (45.5%). For dilated cardiomyopathy, the main indication was also prophylactic (63.5% vs 47.6% in 2015 and 47.0% in 2014). For less common heart diseases, the most frequent indications were primary prevention of hypertrophic cardiomyopathy, valve diseases, congenital diseases, and Brugada syndrome. For long QT syndrome, prophylactic implantation was the most common indication (45.5%), similar to the data from 2015 (54.5%) and in contrast to the data from 2014 (18.5%).
Number of First Implantations According to the Type of Heart Disease, Type of Clinical Arrhythmia, and Form of Presentation From 2012 to 2016
| 2012 | 2013 | 2014 | 2015 | 2016 | |
|---|---|---|---|---|---|
| Ischemic heart disease | |||||
| Aborted SCD | 134 (9.9) | 135 (10.5) | 141 (6.7) | 200 (11.9) | 135 (10.4) |
| SMVT with syncope | 110 (8.1) | 160 (11.9) | 173 (10.6) | 243 (14.5) | 142 (10.9) |
| SMVT without syncope | 148 (10.9) | 179 (13.3) | 108 (6.6) | 121 (7.2) | 226 (17.3) |
| Syncope without arrhythmia | 77 (5.7) | 43 (3.2) | 70 (4.3) | 174 (10.4) | 31 (2.4) |
| Prophylactic indication | 682 (50.5) | 657 (48.8) | 740 (45.5) | 804 (48.9) | 650 (49.9) |
| Missing/unclassifiable | 200 (14.8) | 169 (12.6) | 393 (24.8) | 158 (9.4) | 121 (9.3) |
| Subtotal | 1351 | 1343 | 1625 | 1672 | 1305 |
| Dilated cardiomyopathy | |||||
| Aborted SCD | 50 (6.6) | 46 (6.0) | 25 (6.8) | 63 (6.5) | 51 (5.9) |
| SMVT with syncope | 44 (5.8) | 79 (10.4) | 72 (8.5) | 67 (6.9) | 43 (5.0) |
| SMVT without syncope | 46 (6.0) | 81 (10.7) | 111 (13.4) | 113 (11.7) | 91 (10.5) |
| Syncope without arrhythmia | 38 (5.0) | 49 (6.5) | 37 (4.3) | 66 (6.8) | 59 (6.8) |
| Prophylactic indication | 473 (62.3) | 395 (52.1) | 400 (47.0) | 459 (47.6) | 550 (63.5) |
| Missing/unclassifiable | 108 (14.2) | 108 (14.2) | 173 (20.3) | 196 (20.3) | 72 (8.3) |
| Subtotal | 759 | 758 | 851 | 964 | 866 |
| Valvular heart disease | |||||
| Aborted SCD | 15 (13.4) | 11 (10.2) | 11 (9.0) | 19 (14.4) | 12 (10.5) |
| SMVT | 24 (21.6) | 41 (37.9) | 38 (31.5) | 33 (25.0) | 28 (24.5) |
| Syncope without arrhythmia | 12 (10.8) | 4 (3.7) | 7 (5.7) | 13 (9.9) | 9 (7.9) |
| Prophylactic indication | 48 (43.2) | 38 (35.2) | 46 (37.7) | 55 (41.7) | 52 (45.6) |
| Missing/unclassifiable | 12 (10.8) | 14 (12.9) | 20 (16.4) | 12 (9.9) | 13 (11.4) |
| Subtotal | 111 | 108 | 126 | 132 | 114 |
| Hypertrophic cardiomyopathy | |||||
| Secondary prevention | 53 (26.0) | 58 (29.9) | 62 (25.8) | 60 (24.3) | 49 (20.3) |
| Prophylactic indication | 140 (68.6) | 131 (67.5) | 166 (69.2) | 179 (72.5) | 176 (70.3) |
| Missing/unclassifiable | 11 (5.3) | 5 (2.8) | 12 (5.0) | 8 (3.2) | 16 (6.6) |
| Subtotal | 204 | 194 | 240 | 247 | 241 |
| Brugada syndrome | |||||
| Aborted SCD | 11 (14.1) | 9 (13.6) | 8 (13.7) | 7 (15.9) | 16 (24.2) |
| Prophylactic implantation in syncope | 22 (28.2) | 28 (42.4) | 17 (29.3) | 14 (31.8) | 10 (15.2) |
| Prophylactic implantation without syncope | 42 (53.8) | 18 (27.2) | 22 (37.9) | 12 (27.3) | 35 (53.0) |
| Missing/unclassifiable | 3 (3.8) | 11 (16.7) | 11 (18.9) | 11 (25.0) | 5 (7.6) |
| Subtotal | 78 | 66 | 60 | 47 | 66 |
| ARVC | |||||
| Aborted SCD | 1 (3.3) | 5 (12.2) | 6 (13.3) | 8 (20.5) | 2 (4.3) |
| SMVT | 11 (33.3) | 14 (34.5) | 16 (35.5) | 17 (41.4) | 25 (54.3) |
| Prophylactic implantation | 13 (39.4) | 14 (34.5) | 16 (35.5) | 14 (34.1) | 18 (39.1) |
| Missing/unclassifiable | 8 (24.4) | 8 (19.5) | 7 (15.5) | 2 (4.8) | 1 (2.2) |
| Subtotal | 33 | 41 | 45 | 41 | 46 |
| Congenital heart disease | |||||
| Aborted SCD | 6 (20.0) | 4 (17.4) | 5 (13.9) | 9 (27.3) | 4 (12.1) |
| SMVT | 7 (23.3) | 6 (26.1) | 7 (19.4) | 9 (27.3) | 10 (30.3) |
| Prophylactic implantation | 12 (40.0) | 10 (43.5) | 15 (41.7) | 12 (36.4) | 12 (36.4) |
| Missing/unclassifiable | 5 (16.6) | 3 (13.4) | 9 (25.0) | 3 (36.4) | 7 (21.2) |
| Subtotal | 30 | 23 | 36 | 33 | 33 |
| Long QT syndrome | |||||
| Aborted SCD | 10 (41.6) | 19 (48.7) | 19 (70.4) | 8 (38.1) | 10 (30.3) |
| Prophylactic implantation | 10 (41.6) | 18 (46.1) | 5 (18.5) | 12 (54.5) | 15 (45.5) |
| Missing/unclassifiable | 4 (16.6) | 2 (5.3) | 3 (11.1) | 2 (9.1) | 8 (24.2) |
| Subtotal | 24 | 39 | 26 | 22 | 33 |
ARVC, arrhythmogenic right ventricular cardiomyopathy; SCD, sudden cardiac death; SMVT, sustained monomorphic ventricular tachycardia.
Data are expressed as No. (%).
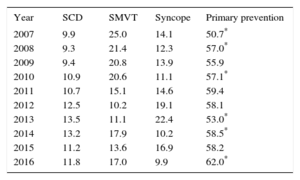
The implantation indication was reported in 80.4% of the records. Most first implantations were indicated for primary prevention (62%), an increase from 2015. This variability has been growing and was statistically significant until 2008, between 2009 and 2010, and between 2013 and 2014; differences were not significant between 2014 and 2015 but became significant again between 2015 and 2016 (Table 3).
Changes in the Main Indications for Implantable Cardioverter-defibrillators (First Implantations, 2007-2016)
| Year | SCD | SMVT | Syncope | Primary prevention |
|---|---|---|---|---|
| 2007 | 9.9 | 25.0 | 14.1 | 50.7* |
| 2008 | 9.3 | 21.4 | 12.3 | 57.0* |
| 2009 | 9.4 | 20.8 | 13.9 | 55.9 |
| 2010 | 10.9 | 20.6 | 11.1 | 57.1* |
| 2011 | 10.7 | 15.1 | 14.6 | 59.4 |
| 2012 | 12.5 | 10.2 | 19.1 | 58.1 |
| 2013 | 13.5 | 11.1 | 22.4 | 53.0* |
| 2014 | 13.2 | 17.9 | 10.2 | 58.5* |
| 2015 | 11.2 | 13.6 | 16.9 | 58.2 |
| 2016 | 11.8 | 17.0 | 9.9 | 62.0* |
SCD, sudden cardiac death; SMVT, sustained monomorphic ventricular tachycardia.
Data are expressed as percentage.
The response rate to these questions was 86.7%. In 82.1%, the main implantation location was the electrophysiology laboratory (83.2% in 2015, 83.4% in 2014, 79.8% in 2013, and 81.4% in 2012), followed by the operating room (15.2%). Electrophysiologists performed 81.2% of implantations (79.6% in 2015, 81.7% in 2014, 80.7% in 2013, and 81.0% in 2012); surgeons, 5.14% (9.6% in 2015, 11.0% in 2014, 13.8% in 2013, and 14.0% in 2012); and both specialist types, 5.1%. Other specialists and intensivists were involved in 1.6% and 2.1%, respectively.
Generator Placement SiteInformation on the placement of first implants was provided in 2446 registry forms (80.3%). Placement was subcutaneous in 95.8% of patients and subpectoral in the remaining 4.2%. The figures were 95.1% and 4.9% for all devices implanted, respectively.
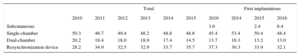
Device TypeThis information was available in 88.3% of the records and is summarized in Table 4. Subcutaneous defibrillator devices represented 6.4% of first implants (2.4% in 2015).
Distribution (Percentage) of the Types of Devices Implanted
| Total | First implantations | |||||||||
|---|---|---|---|---|---|---|---|---|---|---|
| 2010 | 2011 | 2012 | 2013 | 2014 | 2015 | 2016 | 2014 | 2015 | 2016 | |
| Subcutaneous | 3.6 | 2.4 | 6.4 | |||||||
| Single-chamber | 50.3 | 46.7 | 49.4 | 48.2 | 48.8 | 48.6 | 45.4 | 53.4 | 50.4 | 48.4 |
| Dual-chamber | 20.2 | 18.4 | 18.0 | 18.9 | 17.4 | 14.5 | 13.7 | 16.3 | 13.2 | 13.0 |
| Resynchronization device | 28.2 | 34.9 | 32.5 | 32.9 | 33.7 | 35.7 | 37.3 | 30.3 | 33.9 | 32.1 |
In patients with ischemic heart disease, 68.3% of implants were single- or dual-chamber devices (71.5% in 2015, 76.8% in 2014, 74.8% in 2013, and 72.3% in 2012) and 26.9% were ICD-CRTs (27.7% in 2015, 23.1% in 2014, 25.5% in 2013, and 27.7% in 2012). In patients with dilated cardiomyopathy, ICD-CRT devices comprised 44.3% (55.6% in 2015, 53.7% in 2014, 51.7% in 2013, and 56.5% in 2012).
Reasons for Device Replacement, Need for Lead Replacement, and Use of Additional LeadsOf the 1513 replacements, information was available on 1335 (89.6%). The most frequent reason for replacement was battery depletion (78.7%); complications motivated 8.8% (8.6% in 2015 and 7.9% in 2013) and a change of indication prompted 12.5%. Of the 93 replacements due to a change of indication that provided this information, 9.7% were required before 6 months (10.2% in 2015, 9.62% in 2014, and 11.6% in 2013).
Information was available on the status of the leads in 62.5% of the replacements; 8.1% were malfunctioning (54 records) and they were extracted in 14.8% of the patients reporting this problem.
Device ProgrammingInformation on this parameter was provided in 73.9% of records. The most widely used programming was VVI (51.8%), followed by DDD (32.0%), VVIR (8.4%), DDDR (5.1%), and other modes (2.7%), largely algorithms to prevent ventricular pacing.
Induction of ventricular fibrillation was tested in 232 patients, with 4.1% of the 472 records providing this information (2.7% in 2015, 2.9% in 2014, 5.1% in 2013, and 6.7% in 2012). The mean threshold was 22.1± 7.6 J (23.6 ± 8.9 in 2015, 19.7 ± 6.8 in 2014, 20.4 ± 6.5 in 2013, and 20.5 ± 7.1 in 2012) and the mean number of shocks was 1.1.
ComplicationsWith a response rate of 85.3%, 33 complications were reported: 10 coronary sinus dissections, 6 tamponades, 3 pneumothoraces, 1 death, and 13 unspecified complications. The mortality rate was 0.02%, which, with only 1 death, was lower than that of the previous 2 years (0.07% and 0.05%).
DISCUSSIONThe 2016 data of the Spanish Implantable Cardioverter-defibrillator Registry continue to adequately reflect the implantation situation in Spain. The registry information is pertinent, particularly the number of implants, type of implant, indications, and patients’ clinical characteristics.
Comparison With Registries of Previous YearsThe Spanish Implantable Cardioverter-defibrillator Registry was first published in 2005 with the results of the 2002 to 2004 period.4 The number of implanted ICDs increased each year until 2010,5–10 with 2011 and 2012 then showing a lower total number of implantations in both the registry11,12 and Eucomed data. From 2013,13–15 there has been slight uptick in the number of implantations and, this year, they exceeded the values obtained in 2010 (Figure 2 and Figure 3). In 2016, the number of implanted devices increased again. A continual increase was also seen in Europe, in both the number of ICDs and the number of ICD-CRTs.18
The current registry data show an increase in the indication for primary prevention, which has exceeded 60% for the first time (Table 3). The increase has been steady, except for a marked decrease in 2013. In the last 10 years, the indication has increased by 10%.
For the first time, there was a slight decrease in the percentage of first implantations of ICD-CRTs (32.1% vs 33.9% in 2015). In 2016, due to the increased indication for subcutaneous ICDs (6.4% in 2015 vs 2.4% in 2015), the percentage of single-chamber ICDs increased, which reversed the recent trend for a reduction (54.8% vs 52.8% in 2015 and 53.4% in 2014). The use of dual-chamber ICDs decreased (13% in 2016 vs 13.2% in 2015 and 16.3% in 2014). The resynchronization rate for total implantations has slowly increased in recent years, due this year to replacements, and no major changes are expected in the coming years.
The most frequent indication in 2016 continued to be ischemic heart disease (48.6%), followed by dilated cardiomyopathy (29.5%). In contrast to previous years,13–15 when more than half of devices implanted in patients with dilated cardiomyopathy were ICD-CRTs, this year has seen a marked decrease in the percentage of such implantations (44.3% in 2016 vs 55.6% in 2015). In patients with dilated cardiomyopathy, the incidence of ICD-CRT devices was similar (26.9% in 2016 and 27.7% in 2015). These data explain the decrease in the percentage of ICD-CRT devices as first implantations observed in this registry.
The progressive increase in the number of ICD implantations stopped in 2011 and 2012. The 2013 results showed a slight recovery, with the total number of implantations slightly surpassing the rate per million population of 2010 (102 vs 100).13 This increase was confirmed by the data from 2013 onward, with an implantation rate of 122 in our registry and of 143 according to the Eucomed data.18 In 2010, the implantation rate in Spain was about half of the European rate (116 vs 248); in subsequent years, the gap has increased and the values are now 144 vs 320 per million.18
No recent studies have modified the ICD implantation indications. In 2002, the Multicenter Automatic Defibrillator Implantation Trial II19 study was published, followed by the Comparison of Medical Therapy, Pacing and Defibrillation in Heart Failure20 in 2005 and the Sudden Cardiac Death in Heart Failure Trial21 in 2006. These studies established the current indications in primary prevention and CRT and triggered a progressive increase in the number of implantations during that decade. The indications for ICD and CRT implantation are well supported in clinical practice guidelines.22–28 However, the implantation rate per million population does not correspond with that expected from the clinical evidence, both in Spain and in other European countries,29 a tendency that has become consolidated with time in these countries. According to the results of the current registry, it appears that the findings of the Defibrillator Implantation in Patients with Nonischemic Systolic Heart Failure study30 have still not affected the indications for ICDs in nonischemic patients. As in previous registries, the 2016 registry represents 85% of the implantations reported to the Eucomed, exactly the same as in 2015. The number of implanting centers participating in the registry has yet to reach 100%, and there were certain differences in the data with respect to those published in Eucomed that could be explained by sending and processing errors.
The number of implanting centers slightly increased from 2015. Two hospitals reported more than 200 implantations, 15 hospitals (11 in 2015 and 11 in 2014) reported more than 100 implantations, and 86 centers, mainly private, reported less than 10 implantations. The data show a tendency for an increase in implanting centers with low activity. Some studies have shown an inverse relationship between the implantation volume and the number of complications.31
There were no changes from previous registries in the epidemiological characteristics of the patients. Patients with severe ventricular dysfunction and in NYHA II and III continue to predominate. There were no differences from 2015 in the implantation setting: 82.1% were performed in the electrophysiology laboratory (83.2% in 2015 and 83.4% in 2014) and 81.2% were performed by electrophysiologists (vs 79.6% in 2015 and 81.7% in 2014).
Differences Among Autonomous CommunitiesDifferences remain among autonomous communities. The implantation rate was 122 per million population according to the registry and 143 according to the Eucomed data; both databases showed an increase from 2015 (118 and 138, respectively). Several autonomous communities showed higher rates than the average: Principality of Asturias (173 implantations per million), Extremadura (166), Aragon (145), Castile and León (142), Cantabria (139), Castile-La Mancha (137), the Valencian Community (133), Community of Madrid (127), Andalusia (124), and Galicia (123). The following were below the average: Chartered Community of Navarre (80), La Rioja (80), the Region of Murcia (81), the Canary Islands (88), the Balearic Islands (86), the Basque Country (95), and Catalonia (102). The data per community were similar to those of previous years, except in the case of Andalusia, which, for the first time, was slightly higher than the average. The difference between the communities with the highest and lowest implantation rates is currently more than double (173 vs 80) and is similar to that seen in the previous registry (167 vs 67). In general, all autonomous communities have increased their implantation rate, except Madrid, the Valencian Community, Navarre, Catalonia, and the Canary Islands, which showed slight decreases, particularly the Canary Islands (88 in 2016 and 105 in 2015) and Navarre (80 in 2016 and 93 in 2015).
The trends observed in previous registries have been consolidated in relation to the slow and progressive increase in the number of implantations per million individuals, but also the differences among communities, given that, as seen previously, there is no correlation with gross domestic product because the communities above the average implantation rate are the least populated, except in the case of the Community of Madrid, the Valencian Community, and Andalusia. Of course, there are other possible explanations for these differences, such as the health care organization of each community (the number of arrhythmia units and the distribution of referral hospitals). There was also no relationship between the incidence of ischemic heart disease and heart failure in the various communities. Other possible explanations include the health care organization of each community, the number of arrhythmia units, and the distribution of the referral hospitals.
Comparison With Other CountriesWhen ICDs and ICD-CRTs were included, the implantation rate in the countries participating in the Eucomed was 320 per million population (315 in 2015). Germany, with 550 devices per million population, remained the country with the highest number of implantations. Spain (144 implantations per million) was the country with the lowest number of implantations. Several countries showed higher than average rates: Italy (414), the Netherlands (372), the Czech Republic (355), and Poland (322). Below the average were Denmark (302), Austria (291), Ireland (280), Belgium (242), Sweden (238), Norway (244), France (222), Switzerland (227), Finland (261), the United Kingdom (245), Portugal (183), Greece (186), and Spain (144). The difference in the implantation rate in Spain from the European mean was maintained in 2016 (144 vs 320 and 138 vs 315 in 2015). The difference between Spain and the second-last country increased (144 vs 183).
The ICD implantation rate was 191 per million population in 2016 (189 in 2015). Germany (333 implantations per million population) had the highest number of implantations, whereas Spain (90) had the lowest.
The ICD-CRT implantation rate was 129 per million population (126 in 2015). Germany (217 implantations per million population) continued to be first, whereas Spain (54) had the lowest implantation rate.
The proportion of ICD-CRTs with respect to the total varies from 29% in Ireland and Poland to 46% in the United Kingdom. The European average is 40%. Above the average are France, Austria, the United Kingdom, Italy, and the Czech Republic. Ireland and Poland are below 30%. Spain has a proportion of 37%.
These countries have the same regional differences32,33 seen in the Spanish registry, for unknown reasons. One possible explanation is the number of available arrhythmia units, but that does not explain the relationship, at least in Spain, because communities with the highest number of available units had lower implantation rates. Other explanations, such as per capita income, also fail to show a correlation, with countries such as Ireland, the Czech Republic, and Poland showing much higher implantation rates than Spain. The prevalence of cardiovascular diseases, access to the health care system and its organization, and degree of acceptance of and adherence to the clinical practice guidelines could be related to the rate of implantations in Spain and its variability.
LimitationsThe registry included 85% of implantations performed in Spain according to the Eucomed data, the same percentage as in 2015. The percentage has slightly decreased from 2007, when the representativeness was 90%. The number of recorded implantations continues to accurately reflect the situation in Spain. The number of participating centers has remained practically unchanged from previous years.
The true number of implantations in some hospitals differs from that reported to the registry, given that the registry only includes received data collection sheets. Because data can now be sent in various ways, some sheets were not received or correctly registered. A transition was expected in 2016 because the registry data were to be collected in 2 ways, on paper and via the Internet. Unfortunately, the project allowing data to be collected via the Internet remains to be implemented, despite already having been developed. We hope that in 2017 all data will be collected via the website, which should improve the results and minimize the differences between the data obtained and those provided by the Eucomed.
There is excessive variability in the percentage of responses to the various questions in the ICD registry sheet, ranging from 96% for the implanting hospital to 45.9% for baseline rhythm. Finally, the percentage of complications reported to the registry fails to reflect reality because these data are provided during or immediately after the implantation, meaning that most subacute complications are not recorded. This difference could be accentuated in the case of outpatient defibrillator implantation, which is becoming more and more common in Spain.34
Future Prospects of the Spanish Implantable Cardioverter-defibrillator RegistryThis registry is the 13th official report. The durability of this registry is a credit to all of the participating members of the Section of Electrophysiology and Arrhythmias of the SEC. The continued modernization of the registry will allow more and better information to be obtained with less effort by the staff involved in its maintenance. The quality of the information will improve with further computerization of the registry, and the completion of certain fields will be obligatory. In the future, the system may permit more ambitious clinical objectives and include parameters such as death, shocks, and complications that provide relevant clinical information.
CONCLUSIONSThe 2016 Spanish Implantable Cardioverter-defibrillator Registry collected information on 85% of all implantations performed in Spain and, although 100% of procedures have not been recorded, it continues to be representative of the activity and current indications of this therapy in Spain. After 2 years of decreases in the number of implantations, the recovery seen in 2013 was confirmed in recent years with a figure of 122 per million population. As in previous years, the total number of implantations in Spain continues to be much lower than the average for the European Union, with the difference continuing to grow, and the autonomous communities continue to show considerable variability.
CONFLICTS OF INTERESTJ. Alzueta has participated in clinical studies funded by Medtronic, Boston, St Jude, Biotronik, and Sorin and in roundtables sponsored by Boston. I. Fernández Lozano has participated in clinical studies funded by Medtronic, Boston, St Jude, Biotronik, and Sorin and in roundtables sponsored by Boston and St Jude.
We would like to thank all of the health care professionals involved in ICD implantation in Spain who have voluntarily and selflessly contributed to the ultimate success of the registry. We also thank José M. Fernández, a SEC fellow who maintains the database of the Spanish Implantable Cardioverter-defibrillator Registry, for his enthusiastic work in maintaining the database and his participation in its development. Our thanks also go to the personnel at the ICD manufacturers (Medtronic, Boston Scientific, St. Jude Medical, Biotronik, and the Sorin Group) for their help in collecting and sending datasheets to the SEC for most of the implantations. Finally, we thank the SEC for its work in receiving the information, particularly Gonzalo Justes and José M. Naranjo.