Sudden cardiac death (SCD) accounts for more than 4 million global deaths per year. While it is most commonly caused by coronary artery disease, a final common pathway of ventricular arrhythmias is shared by different etiologies. The most effective primary and secondary prevention strategy is an implantable cardioverter-defibrillator (ICD). The decision to implant an ICD for primary prevention is largely based on a left ventricular ejection fraction ≤ 35%, but this criterion in isolation is neither sensitive nor specific. Novel imaging parameters hold promise to improve ICD candidate selection. Cardiac magnetic resonance (CMR) imaging is a powerful and versatile technique, with the ability to comprehensively assess cardiac structure and function. A range of variables based on CMR techniques (late gadolinium enhancement, T1 mapping, T2* relaxometry, deformation imaging) have been associated with ventricular arrhythmias and SCD risk. The role of CMR in the estimation of ventricular arrhythmias and SCD risk in coronary artery disease, nonischemic cardiomyopathies, cardiac transplant, iron-overload cardiomyopathy and valvular heart disease is reviewed in this article. Prospective, randomized trials and standardization of CMR techniques are required before its routine use can be recommended for guiding SCD prevention strategies.
Keywords
Sudden cardiac death (SCD) is defined as “a nontraumatic, unexpected, fatal event occurring within 1 hour of the onset of symptoms in an apparently healthy subject”.1 Sudden cardiac death accounts for a fifth of global deaths, exceeding 4 million per year.1 While the causes are varied (coronary artery disease, cardiomyopathies, myocarditis, valvular and congenital heart disease as well as primary electrophysiological conditions), different etiologies share ventricular arrhythmias (VA) as a final common pathway. Implantable cardioverter-defibrillator (ICD) insertion is the most effective strategy for both primary and secondary prevention. In current practise, the decision to implant an ICD for primary prevention is based largely on a left ventricular ejection fraction (LVEF) ≤ 35%.1 However, only about one fifth of patients who experience SCD have LVEF ≤ 35%, and appropriate ICD therapy occurs in less than a third of ICD recipients with LVEF ≤ 35%.2–4 Basing the decision to implant an ICD on the LVEF alone is therefore neither sensitive nor specific. The need for improved selection of ICD candidates was re-emphasized by the recent DANISH (Danish Study to Assess the Efficacy of ICDs in Patients with Nonischemic Systolic Heart Failure on Mortality) trial, which was unable to confirm a clear benefit of primary prevention ICD in nonischemic heart failure patients.5 In addition, in patients with cardiomyopathies known to have an increased risk of VA and SCD but who frequently have preserved LVEF (> 50%), the decision to implant an ICD as primary prevention is based on other parameters such as left atrial dimensions, thickness of the left ventricular (LV) myocardium, and the presence of LV outflow tract obstruction (eg, in hypertrophic cardiomyopathy [HCM]).6 However, these variables have not been tested in randomized clinical trials and remain largely empirical.
Novel cardiac imaging techniques hold promise in improving the prediction of SCD and refining criteria for ICD insertion. Cardiac magnetic resonance (CMR) imaging is a powerful and versatile technique, with the ability to comprehensively assess cardiac structure and function. A range of CMR techniques (late gadolinium enhancement [LGE], T1 mapping, T2* relaxometry, deformation [strain] imaging) are associated with VA and SCD risk. The role of CMR in the estimation of VA and SCD risk is reviewed in the present article, relating CMR techniques to a) the assessment of the arrhythmogenic substrate, b) clinical evidence, and c) implications for management.
Cmr Techniques: Visualization Of Arrhythmogenic SubstrateLate Gadolinium Enhancement: Focal Scar/FibrosisFocal myocardial scar/fibrosis is electrically inert but it is surrounded by a “grey zone” where normal cardiomyocytes intermingle with dense bundles of fibrosis.7 Slow impulse conduction in the grey zone allows the establishment of re-entry circuits, leading to VA.7 Dense scar, as well as the surrounding grey zone, can be imaged with LGE-CMR. The gadolinium-based contrast agent accumulates in the expanded extracellular space.8 Inversion recovery images are acquired 10 to 20minutes after gadolinium contrast media administration, and the normal myocardium is nulled by choosing an appropriate inversion time, which provides contrast between areas of gadolinium accumulation (focal scar/fibrosis) and normal tissue.8 Dense scar is distinguished from the grey zone by application of a signal intensity threshold, eg, ≥ 50% for dense scar, 30% to 50% for grey zone and < 30% for normal myocardium.7 Both the presence and extent of LGE (mass or percentage of myocardial volume/mass) have been associated with VA and SCD risk.9
T1 Mapping and Extracellular Volume Fraction: Diffuse FibrosisWhile diffuse myocardial fibrosis causes VA in a manner similar to focal scar/fibrosis, it cannot be visualized with conventional LGE. T1 mapping depicts the time constant of longitudinal spin relaxation of the myocardium on a colour-coded, pixel-by-pixel map. Diffuse fibrosis can be demonstrated on native (without a gadolinium-based contrast agent) and postcontrast T1 maps by means of various CMR sequences, eg, Modified Look-Locker Inversion Recovery (MOLLI) and shortened MOLLI (ShMOLLI).10 Increased diffuse myocardial fibrosis will result in long native T1 values whereas after administration of gadolinium contrast media the T1 values will be shorter compared with normal myocardium. Native T1 mapping has been independently associated with VA in cardiomyopathies of ischemic and nonischemic etiology.11 Furthermore, the extracellular volume fraction (ECV) of the myocardium can be calculated from the pre- and postcontrast T1 values of the blood pool and myocardium. The extracellular volume fraction reflects the size of the extracellular space.12 Since type I collagen is the primary constituent of the extracellular space, in the absence of edema or amyloidosis, ECV is also a marker of diffuse fibrosis.8
T2* Relaxometry: IronMyocardial iron deposition is arrhythmogenic, although the specific mechanism is still debated.13,14 Since iron is paramagnetic, it influences T2* relaxation time by disrupting the magnetic field homogeneity and causing proton spins to dephase, thereby shortening the T2* time. Breath-hold, multiecho gradient echo sequences are employed to construct a T2* relaxation curve with a series of images at increasing echo times.15 An exponential function is then fitted to the data points according to the following formula: y = Ke-TE/T2*, where y is the signal intensity, K is a constant, TE is the echo time and T2* is the T2* relaxation time, which reflects the amount of myocardial iron deposition.15,16
Cmr Techniques: Indirect Demonstration Of Arrhythmogenic SubstrateDeformation (Strain) ImagingBoth focal and diffuse fibrosis lead to myocardial stiffness, which can be demonstrated as abnormal deformation (longitudinal and circumferential strain) by various CMR tagging techniques.17 Circumferential strain abnormalities, demonstrated with tagging, are associated with inducible VA and identification of the grey zone, which plays a pivotal role in arrhythmogenesis.18–20 In contrast to CMR tagging, feature tracking CMR identifies “features” on the epicardial or endocardial borders, and tracks their motion throughout the cardiac cycle.21 No additional sequences are required, and data processing is automated, performed on cine-images, making this an attractive approach.21 Feature tracking analysis has been applied to global longitudinal strain measurement as a risk marker for VA and SCD.22 In addition, LV mechanical dispersion, calculated as the standard deviation of the time-to-peak circumferential strain (feature tracking analysis) of 16 LV segments is a marker of electromechanical inhomogeneity due to myocardial fibrosis/scar, which has been associated with VA and SCD.23,24
Scd Etiologies: Arrhythmogenic Substrates And Evidence For Cmr Risk-StratificationCoronary Artery DiseaseCoronary artery disease is the most common cause of SCD, due to the arrhythmogenicity of postinfarct scar.7 Evidence linking both the presence and burden of LGE and VA/SCD in the chronic, postinfarct setting, originates from multiple studies (Table 1, Figure 1).7,25–30 In 195 patients with suspected coronary artery disease who underwent CMR, the presence of LGE was independently associated with outcome, including VA requiring appropriate ICD discharge (hazard ratio [HR], 5.98; 95% confidence interval [95%CI], 2.68-13.3; P < .0001).30 The LGE burden (calculated as scar mass) was independently associated with appropriate ICD therapy in 66 patients with chronic coronary artery disease (HR, 3.15; 95%CI, 1.35-7.33; P < .001).25 Late gadolinium enhancement is also associated with VA and SCD in the acute, postinfarct context.31,32 The ratio between the peri-infarct zone and the core infarct (as a measure of the grey zone: dense scar) was found to be independently associated with sustained VA and appropriate ICD therapy in a cohort of patients with coronary artery disease (HR, 2.01; 95%CI, 1.17-3.44; P = .01).28 In postinfarct patients, abnormalities of circumferential strain (on tagging sequences) are associated with inducible VA and characterizes the peri-infarct grey zone.18–20 Left ventricular mechanical dispersion was independently associated with mortality and SCD, including VA and appropriate ICD therapy (HR, 1.39; 95%CI, 1.20-1.62; P < .001) in a cohort of 130 patients after ST-segment elevation myocardial infarction (Figure 1).23
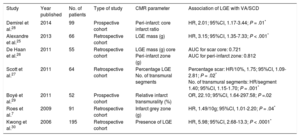
Studies Reporting Ventricular Arrhythmias/Sudden Cardiac Death Risk Associated With Late Gadolinium Enhancement in Patients With Coronary Artery Disease
| Study | Year published | No. of patients | Type of study | CMR parameter | Association of LGE with VA/SCD |
|---|---|---|---|---|---|
| Demirel et al.28 | 2014 | 99 | Prospective cohort | Peri-infarct: core infarct ratio | HR, 2.01; 95%CI, 1.17-3.44; P = .01* |
| Alexandre et al.25 | 2013 | 66 | Retrospective cohort | LGE mass (g) | HR, 3.15; 95%CI, 1.35-7.33; P < .001* |
| De Haan et al.26 | 2011 | 55 | Retrospective cohort | LGE mass (g) core Peri-infarct zone (g) | AUC for scar core: 0.721 AUC for peri-infarct zone: 0.812 |
| Scott et al.27 | 2011 | 64 | Retrospective cohort | Percentage LGE No. of transmural segments | Percentage scar: HR/10%, 1.75; 95%CI, 1.09-2.81; P = .02* No. of transmural segments: HR/segment 1.40; 95%CI, 1.15-1.70; P = .001* |
| Boyé et al.29 | 2011 | 52 | Prospective cohort | Relative infarct transmurality (%) | OR, 22.10; 95%CI, 1.64-297.58; P =.02 |
| Roes et al.7 | 2009 | 91 | Retrospective cohort | Infarct grey zone (g) | HR, 1.49/10g; 95%CI, 1.01-2.20; P = .04* |
| Kwong et al.30 | 2006 | 195 | Retrospective cohort | Presence of LGE | HR, 5.98; 95%CI, 2.68-13.3; P < .0001* |
95%CI, 95% confidence interval; AUC, area under the curve; CMR, cardiac magnetic resonance; HR, hazard ratio; LGE, late gadolinium enhancement; OR, odds ratio; SCD, sudden cardiac death; VA, ventricular arrhythmias.
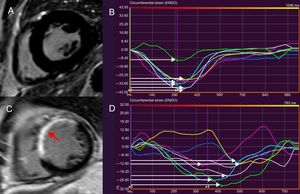
 by synchronous deformation of the different LV segments (colour-coded) and time-to-peak circumferential strain, indicated by white arrows (B). In panel C, thinning and extensive LGE of the interventricular septum and anterior LV wall after myocardial infarction is shown (arrow). Increased LVMD (11.8%) in patient (C), reflecting dyssynchronous LV segments (D). LVMD > 9.79% is associated with ventricular arrhythmias and sudden cardiac death risk postinfarct. LGE, late gadolinium enhancement; LV, left ventricular; LVMD, left ventricular mechanical dispersion.")
Feature tracking cardiac magnetic resonance to assess LVMD. LVMD is defined as the standard deviation of time-to-peak circumferential strain, expressed as a percentage of the cardiac cycle length. The midventricular, short-axis slice of the left ventricle of a healthy individual, demonstrating absence of LGE is shown in panel A. A normal LVMD is demonstrated in patient (A) by synchronous deformation of the different LV segments (colour-coded) and time-to-peak circumferential strain, indicated by white arrows (B). In panel C, thinning and extensive LGE of the interventricular septum and anterior LV wall after myocardial infarction is shown (arrow). Increased LVMD (11.8%) in patient (C), reflecting dyssynchronous LV segments (D). LVMD > 9.79% is associated with ventricular arrhythmias and sudden cardiac death risk postinfarct. LGE, late gadolinium enhancement; LV, left ventricular; LVMD, left ventricular mechanical dispersion.
Dilated cardiomyopathy (DCM) is characterized by LV or biventricular dilation and dysfunction that are not explained by abnormal loading conditions or coronary artery disease.33 A multitude of genetic and environmental etiologies have been identified, including more than 50 pathogenic genes.33 Fibrosis (both focal and diffuse) causes scar-related re-entry and VA.34–37 Late gadolinium enhancement-related VA and SCD risk has been extensively documented in this heterogeneous group of patients (Table 2).9,24,34,35,38–46 Different LGE patterns have been described, with some studies correlating midwall LGE with greater risk, while this finding was not apparent in others (Table 2).35,41,43,44,47,48 The prognostic implications of LGE for VA/SCD has been shown in certain specific, genetic DCMs, eg, lamin A/C mutations, Duchenne and Becker muscular dystrophy.49,50 Prognostic evidence for LGE presence and extent has accumulated for “nonischemic cardiomyopathy” in various studies, which overlaps with DCM.36,38,48,51,52 Extracellular volume was also found to be an independent predictor of a combined endpoint (including VA) in nonischemic DCM (Figure 2A).12,53 In Becker muscular dystrophy, an increased ECV has been associated with VA (odds ratio [OR], 1.97; 95%CI, 1.21-32.22; P = .032).54 Impaired LV global longitudinal strain (HR, 1.27; 95%CI, 1.06-1.52; P < .02), assessed with feature tracking analysis, was independently associated with a combined endpoint, including VA and SCD, in a study of 210 patients with DCM (Figure 2B-2D).22
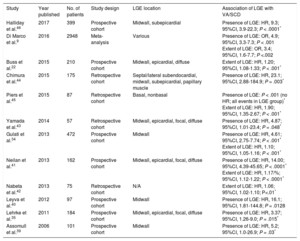
Studies Reporting Ventricular Arrhythmias/Sudden Cardiac Death Risk Associated With Late Gadolinium Enhancement in Patients With Dilated Cardiomyopathy
| Study | Year published | No. of patients | Study design | LGE location | Association of LGE with VA/SCD |
|---|---|---|---|---|---|
| Halliday et al.46 | 2017 | 399 | Prospective cohort | Midwall, subepicardial | Presence of LGE: HR, 9.3; 95%CI, 3.9-22.3; P < .0001* |
| Di Marco et al.9 | 2016 | 2948 | Meta-analysis | Various | Presence of LGE: OR, 4.9; 95%CI, 3.3-7.3; P < .001 Extent of LGE: OR, 3.4; 95%CI, 1.6-7.7; P <.002 |
| Buss et al.22 | 2015 | 210 | Prospective cohort | Midwall, epicardial, diffuse | Extent of LGE: HR, 1.20; 95%CI, 1.08-1.33; P < .001* |
| Chimura et al.44 | 2015 | 175 | Retrospective cohort | Septal/lateral subendocardial, midwall, subepicardial, papillary muscle | Presence of LGE: HR, 23.1; 95%CI, 2.88-184.9; P = .003* |
| Piers et al.45 | 2015 | 87 | Retrospective cohort | Basal, nonbasal | Presence of LGE: P < .001 (no HR; all events in LGE group)* Extent of LGE: HR, 1.90; 95%CI, 1.35-2.67; P < .001* |
| Yamada et al.43 | 2014 | 57 | Retrospective cohort | Midwall, epicardial, focal, diffuse | Presence of LGE: HR, 4.87; 95%CI, 1.01-23.4; P = .048* |
| Gulati et al.34 | 2013 | 472 | Prospective cohort | Midwall | Presence of LGE: HR, 4.61; 95%CI, 2.75-7.74; P < .001* Extent of LGE: HR, 1.10; 95%CI, 1.05-1.16; P < .001* |
| Neilan et al.41 | 2013 | 162 | Prospective cohort | Midwall, epicardial, focal, diffuse | Presence of LGE: HR, 14.00; 95%CI, 4.39-45.65; P < .0001* Extent of LGE: HR, 1.17/%; 95%CI, 1.12-1.22; P < .0001* |
| Nabeta et al.42 | 2013 | 75 | Retrospective cohort | N/A | Extent of LGE: HR, 1.06; 95%CI, 1.02-1.10; P<.01* |
| Leyva et al.40 | 2012 | 97 | Prospective cohort | Midwall | Presence of LGE: HR, 16.1; 95%CI, 1.81-144.8; P = .0128 |
| Lehrke et al.35 | 2011 | 184 | Prospective cohort | Midwall, epicardial, focal, diffuse | Presence of LGE: HR, 3.37; 95%CI, 1.26-9.0; P = .015* |
| Assomull et al.39 | 2006 | 101 | Prospective cohort | Midwall | Presence of LGE: HR, 5.2; 95%CI, 1.0-26.9; P = .03* |
95%CI, 95% confidence interval; HR, hazard ratio; LGE, late gadolinium enhancement; N/A, not available; OR, odds ratio; SCD, sudden cardiac death; VA, ventricular arrhythmias.
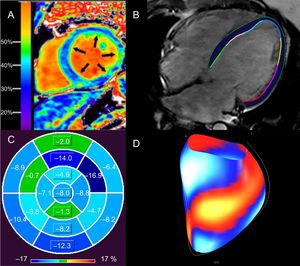
. An elevated ECV is associated with ventricular arrhythmias in nonischemic DCM.12 Epi- and endocardial LV contours in a horizontal long axis, steady state free precession image of a patient with idiopathic DCM (LVEF < 10%) from which global longitudinal strain is calculated with feature tracking (B). Polar map of LV segmental, longitudinal strain in patient (B), demonstrating impaired global longitudinal strain (4.4%). LV segments are coded in shades of blue (darker hues denote better segmental strain) and green (worse segmental strain) (C). Global longitudinal strain greater than 12.5% is associated with sudden cardiac death in nonischemic DCM, independent of LVEF.22 Surface-rendered display of LV segmental strain from (B), with blue/white segments representing better strain, compared with red/yellow segments (worse strain) (D). DCM, dilated cardiomyopathy; ECV, extracellular volume fraction; LV, left ventricular; LVEF, left ventricular ejection fraction. Panel A reproduced with permission from Schelbert et al.53.")
Assessment of diffuse myocardial fibrosis and functional consequences with cardiac magnetic resonance in patients with DCM. Elevated ECV of 37% in a patient with nonischemic DCM (A). An elevated ECV is associated with ventricular arrhythmias in nonischemic DCM.12 Epi- and endocardial LV contours in a horizontal long axis, steady state free precession image of a patient with idiopathic DCM (LVEF < 10%) from which global longitudinal strain is calculated with feature tracking (B). Polar map of LV segmental, longitudinal strain in patient (B), demonstrating impaired global longitudinal strain (4.4%). LV segments are coded in shades of blue (darker hues denote better segmental strain) and green (worse segmental strain) (C). Global longitudinal strain greater than 12.5% is associated with sudden cardiac death in nonischemic DCM, independent of LVEF.22 Surface-rendered display of LV segmental strain from (B), with blue/white segments representing better strain, compared with red/yellow segments (worse strain) (D). DCM, dilated cardiomyopathy; ECV, extracellular volume fraction; LV, left ventricular; LVEF, left ventricular ejection fraction. Panel A reproduced with permission from Schelbert et al.53.
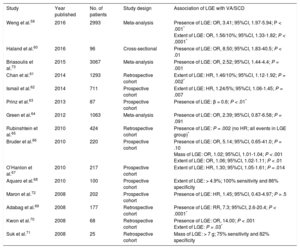
Hypertrophic cardiomyopathy is a genetic cardiomyopathy, identified by an unexplained increase in LV wall thickness with a nondilated chamber.55 More than 1400 mutations have been described, which are accompanied by a range of phenotypes.55 Left ventricular wall thickening is most commonly observed in the LV basal septum, but also occurs in apical and midventricular patterns (Figure 3D). Left ventricular wall thickening ≥ 30mm in any segment is a risk factor for SCD (Figure 3D).56 Apical aneurysm formation is associated with midventricular obstruction, likely because of chronic exposure of the LV apex to high wall stress from increased systolic pressure.57,58 This leads to ischemia and focal replacement fibrosis of the LV apex.58 Midventricular obstruction with a gradient ≥ 30mmHg (HR, 3.19; 95%CI, 1.62-6.29; P < .001) with and without apical aneurysm formation was an independent determinant of VA and SCD in a study of 490 Japanese patients.58 Multiple studies have furnished evidence for the association of LGE with VA and SCD (Table 3).59–73 Not only the presence, but also the extent of LGE, is linked to VA/SCD risk (Figure 3A-3B).59,61,62,66,67,70,71 Furthermore, the pattern of LGE has prognostic implications: while LGE at the right ventricular insertion points is typical for the diagnosis of HCM, it does not appear to portend a higher risk of SCD (Figure 3C).74
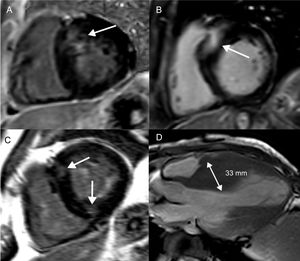
 and an apical, long-axis slice (D) demonstrating different patterns of LGE and LV wall thickening in hypertrophic cardiomyopathy. Basal, septal LV thickening and co-localized LGE (A). More extensive basal, septal LGE, which represents a higher SCD risk (B). LGE at the anterior and inferior right ventricular LV attachments, which is not associated with an increased SCD risk (C). Midventricular pattern of LV thickening, with the interventricular septum measuring 33mm (D). Both midventricular hypertrophy and LV thickening ≥ 30mm are risk markers for SCD. LGE, late gadolinium enhancement; LV, left ventricular; SCD, sudden cardiac death.")
Focal fibrosis in hypertrophic cardiomyopathy. Short axis, left ventricular slices (A-C) and an apical, long-axis slice (D) demonstrating different patterns of LGE and LV wall thickening in hypertrophic cardiomyopathy. Basal, septal LV thickening and co-localized LGE (A). More extensive basal, septal LGE, which represents a higher SCD risk (B). LGE at the anterior and inferior right ventricular LV attachments, which is not associated with an increased SCD risk (C). Midventricular pattern of LV thickening, with the interventricular septum measuring 33mm (D). Both midventricular hypertrophy and LV thickening ≥ 30mm are risk markers for SCD. LGE, late gadolinium enhancement; LV, left ventricular; SCD, sudden cardiac death.
Studies Reporting Ventricular Arrhythmias/Sudden Cardiac Death Risk Associated With LGE in Patients With Hypertrophic Cardiomyopathy
| Study | Year published | No. of patients | Study design | Association of LGE with VA/SCD |
|---|---|---|---|---|
| Weng et al.59 | 2016 | 2993 | Meta-analysis | Presence of LGE: OR, 3.41; 95%CI, 1.97-5.94; P < .001* Extent of LGE: OR, 1.56/10%; 95%CI, 1.33-1.82; P < .0001* |
| Haland et al.60 | 2016 | 96 | Cross-sectional | Presence of LGE: OR, 8.50; 95%CI, 1.83-40.5; P < .01 |
| Briasoulis et al.73 | 2015 | 3067 | Meta-analysis | Presence of LGE: OR, 2.52; 95%CI, 1.44-4.4; P = .001 |
| Chan et al.61 | 2014 | 1293 | Retrospective cohort | Extent of LGE: HR, 1.46/10%; 95%CI, 1.12-1.92; P = .002* |
| Ismail et al.62 | 2014 | 711 | Prospective cohort | Extent of LGE: HR, 1.24/5%; 95%CI, 1.06-1.45; P = .007 |
| Prinz et al.63 | 2013 | 87 | Prospective cohort | Presence of LGE: β = 0.6; P < .01* |
| Green et al.64 | 2012 | 1063 | Meta-analysis | Presence of LGE: OR, 2.39; 95%CI, 0.87-6.58; P = .091 |
| Rubinshtein et al.65 | 2010 | 424 | Retrospective cohort | Presence of LGE: P = .002 (no HR; all events in LGE group)* |
| Bruder et al.66 | 2010 | 220 | Prospective cohort | Presence of LGE: OR, 5.14; 95%CI, 0.65-41.0; P = .10 Mass of LGE: OR, 1.02; 95%CI, 1.01-1.04; P < .001 Extent of LGE: OR, 1.06; 95%CI, 1.02-1.11; P < .01 |
| O’Hanlon et al.67 | 2010 | 217 | Prospective cohort | Extent of LGE: HR, 1.30; 95%CI, 1.05-1.61; P = .014 |
| Aquaro et al.68 | 2010 | 100 | Prospective cohort | Extent of LGE: > 4.9%; 100% sensitivity and 86% specificity |
| Maron et al.72 | 2008 | 202 | Prospective cohort | Presence of LGE: HR, 1.45; 95%CI, 0.43-4.97; P = .5 |
| Adabag et al.69 | 2008 | 177 | Retrospective cohort | Presence of LGE: RR, 7.3; 95%CI, 2.6-20.4; P < .0001* |
| Kwon et al.70 | 2008 | 68 | Retrospective cohort | Presence of LGE: OR, 14.00; P < .001 Extent of LGE: P = .03* |
| Suk et al.71 | 2008 | 25 | Retrospective cohort | Mass of LGE: > 7 g; 75% sensitivity and 82% specificity |
95%CI, 95% confidence interval; HR, hazard ratio; LGE, late gadolinium enhancement; OR, odds ratio; RR, relative risk; SCD, sudden cardiac death; VA, ventricular arrhythmias.
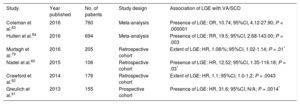
Sarcoidosis is a multisystem, granulomatous disease, involving the heart in 2% to 5% of cases.75,76 Myocardial inflammation progresses to noncaseating granulomas and eventually, areas of focal fibrosis. While re-entry underlies scar-related VA in the later phases, triggered activity and abnormal automaticity have been documented.77 Late gadolinium enhancement is believed to reflect inflammatory activity and fibrosis, and therefore cannot distinguish the acute from the chronic phase of the disease (Figure 4).78 Evidence for the VA and SCD implications of LGE originates from multiple studies (Table 4).79–84
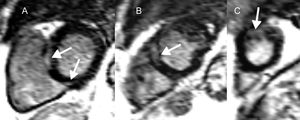
, demonstrating midwall and epicardial late gadolinium enhancement (arrows) basally (A), midventricular (B) and apically (C) in a patient with cardiac sarcoidosis. Both the presence and extent of late gadolinium enhancement are correlated with ventricular arrhythmias and sudden cardiac death in this condition.")
Cardiac magnetic resonance in cardiac sarcoidosis and risk of ventricular arrhythmias and sudden cardiac death. Short axis, left ventricular slices (A-C), demonstrating midwall and epicardial late gadolinium enhancement (arrows) basally (A), midventricular (B) and apically (C) in a patient with cardiac sarcoidosis. Both the presence and extent of late gadolinium enhancement are correlated with ventricular arrhythmias and sudden cardiac death in this condition.
Studies Reporting Ventricular Arrhythmias/Sudden Cardiac Death Risk Associated With Late Gadolinium Enhancement in Patients With Sarcoidosis
| Study | Year published | No. of patients | Study design | Association of LGE with VA/SCD |
|---|---|---|---|---|
| Coleman et al.83 | 2016 | 760 | Meta-analysis | Presence of LGE: OR, 10.74; 95%CI, 4.12-27.90; P < .000001 |
| Hulten et al.84 | 2016 | 694 | Meta-analysis | Presence of LGE: RR, 19.5; 95%CI, 2.68-143.00; P = .003 |
| Murtagh et al.79 | 2016 | 205 | Retrospective cohort | Extent of LGE: HR, 1.08/%; 95%CI, 1.02-1.14; P = .01* |
| Nadel et al.80 | 2015 | 106 | Retrospective cohort | Presence of LGE: HR, 12.52; 95%CI, 1.35-116.18; P = .03* |
| Crawford et al.82 | 2014 | 176 | Retrospective cohort | Extent of LGE: HR, 1.1; 95%CI, 1.0-1.2; P = .0043 |
| Greulich et al.81 | 2013 | 155 | Prospective cohort | Presence of LGE: HR, 31.6; 95%CI, N/A; P = .0014* |
95%CI, confidence interval; HR, hazard ratio; LGE, late gadolinium enhancement; N/A, not available; OR, odds ratio; RR, relative risk; SCD, sudden cardiac death; VA, ventricular arrhythmias.
The most common causes of viral myocarditis are human herpesvirus 6 (HH6) and parvovirus B19 (PVB19). Sudden cardiac death occurs in 8.6% to 2%, and may be ascribed to VA.85,86 While focal scar causes VA and SCD, other mechanisms may come into play in the acute setting, eg, triggered activity and abnormal automaticity.87 In a study of 405 patients with suspected myocarditis, LGE was present in 80% of those with death, aborted SCD or appropriate ICD discharge compared with 27% of those without (P < .001).85 In the ITAMY (ITalian multicenter study on Acute MYocarditis) study, which investigated patients with acute myocarditis, an LGE pattern involving the anteroseptal LV wall was associated with worse outcome (including appropriate ICD therapy and resuscitated cardiac arrest) than other patterns (inferolateral, “other” and no LGE).88 Viral tropism links the LGE pattern and VA/SCD risk mechanistically.88 HHV6 infects the cardiac conduction system, which accounts for both the septal LGE distribution and high risk of VA.88,89 Furthermore, HHV6 is repeatedly reactivated after a childhood infection, causing recurrent myocardial and conduction tissue insults.88,90 In contrast, PVB19 infects the pericardium and underlying LV wall, represented by a lateral LGE localization and less deleterious consequences.88,91
Cardiac TransplantationMyocardial fibrosis in cardiac transplant recipients is likely multifactorial, involving ischemia, inflammation, subclinical rejection, and infection.92 Both the absolute LGE mass and the percentage of LV LGE were associated with a combined endpoint, including VA (HR, 1.042; 95%CI, 1.018-1.067; P = .0007 and HR, 1.083; 95%CI, 1.038-1.120; P = .0002, respectively) in study of 48 recipients of orthotopic cardiac transplants.92
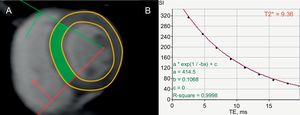
Iron-overload CardiomyopathyGenetic abnormalities of iron metabolism (primary hemochromatosis), causing excessive intestinal iron absorption, as well as repeated red cell transfusions in transfusion-dependent anemias, eg, thalassemia major (secondary hemochromatosis) cause myocardial iron deposition.15 Patients with iron-overload cardiomyopathy are at risk of VA.13 The degree of T2* time shortening correlates with arrhythmia risk, including VA. In a study of 652 patients with thalassemia major, the relative risk of arrhythmias was 4.60 (95%CI, 2.66-7.95) for patients with a T2* < 20ms compared with those with a T2* > 20ms (Figure 5).93,94 When T2* decreased to < 6ms, the relative risk increased to 8.79 (95%CI, 4.03-19.2).93
. T2* relaxation curve, plotting signal intensity against echo time from the septal region of interest (indicated in green in panel A), demonstrating a shortened T2* relaxation time of 9.36ms due to myocardial iron overload (B). A T2* < 20ms is associated with ventricular arrhythmias.93 Adapted with permission from Gupta et al.94.")
Evaluation of risk of sudden cardiac death in iron-overload cardiomyopathy. Short axis, left ventricular slice at the level of the papillary muscles, acquired with a T2* sequence (A). T2* relaxation curve, plotting signal intensity against echo time from the septal region of interest (indicated in green in panel A), demonstrating a shortened T2* relaxation time of 9.36ms due to myocardial iron overload (B). A T2* < 20ms is associated with ventricular arrhythmias.93 Adapted with permission from Gupta et al.94.
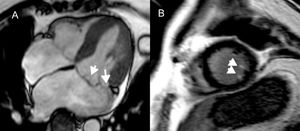
Degenerative mitral valve disease may involve leaflet thickening, redundancy, chordal elongation, annular dilatation, and abnormal annular dynamics.95,96 Mechanical forces, exerted by prolapsing leaflets and chords, possibly cause repetitive damage to the papillary muscle and underlying myocardium, eventually leading to myocardial scarring.95 Late gadolinium enhancement at the papillary muscle and inferobasal LV wall correlates with the occurrence of VA.95 Papillary muscle LGE (especially at the tips, adjacent to chordal insertion) is present in 63% of patients with mitral valve prolapse and is associated with VA (Figure 6).4,97
. Short axis view, with late gadolinium enhancement of the papillary muscle tips (B), which has been linked to ventricular arrhythmias.95 Reproduced with permission from van der Bijl et al.4.")
Late gadolinium enhancement on cardiac magnetic resonance in patients with mitral valve prolapse. Horizontal long axis steady state free precession image, demonstrating bileaflet prolapse of the mitral valve (A). Short axis view, with late gadolinium enhancement of the papillary muscle tips (B), which has been linked to ventricular arrhythmias.95 Reproduced with permission from van der Bijl et al.4.
Prospective evidence for the efficacy of primary and secondary prevention of SCD in coronary artery disease and DCM is based on echocardiography-derived LVEF and the routine use of CMR parameters, eg, LGE, cannot yet be recommended.4 However, the use of LGE-CMR imaging as an arbitrator for ICD implantation in HCM patients where risk-stratification is ambiguous, has been adopted by the American College of Cardiology/American Heart Association guideline on HCM.56 Additionally, T2* relaxometry-guided iron chelation therapy has led to decreased mortality in iron-overload cardiomyopathy.98 The management implications of CMR in SCD prevention of sarcoidosis, viral myocarditis, cardiac transplantation and valvular disease patients remains to be elucidated.
To establish a routine role for CMR in the prediction of SCD and its prevention, randomized, prospective trials are required. A prospective trial (CMR_GUIDE, NCT01918215) will randomize ischemic and nonischemic cardiomyopathy patients with LVEF > 35% to receive either an ICD or an implantable loop recorder based on the presence of LGE on CMR.87 Furthermore, standardization of various CMR parameters, eg, LGE burden and parametric mapping, is a prerequisite for the integration of CMR into the daily practice of SCD prevention.
ConclusionsCMR is a versatile cardiac imaging technique, with the ability to comprehensively visualize cardiac structural and functional abnormalities. Various CMR parameters have demonstrated the ability to predict VA and SCD, and CMR therefore holds much promise to provide both complementary and incremental benefit in SCD prediction. Prospective, randomized trials and standardization of CMR techniques are required before its routine use can be recommended for guiding SCD prevention, eg, the selection of primary prevention ICD candidates.
Conflicts Of InterestLeiden University Medical Center's Department of Cardiology received research grants from Biotronik, Medtronic, Boston Scientific and Edwards Lifesciences. V. Delgado received speaker fees from Abbott Vascular.
.