Severe symptomatic aortic stenosis carries a very poor prognosis. Transcatheter aortic valve replacement has been demonstrated to change the natural history of the disease. However, it is not known whether the probability of survival in older patients receiving this treatment returns to a similar value to that in the general population. Our objective was to determine survival in these patients vs that in the general population.
MethodsWe retrospectively analyzed the survival curves of patients older than 75 years who underwent transcatheter aortic valve implantation (TAVI) at our hospital and compared them with those in the general population of the same age, sex, and geographic region by using data from the Spanish National Institute of Statistics.
ResultsWe analyzed 526 patients. Among postoperative survivors, survival curves were similar between the 2 groups during most of the follow-up. In TAVI patients, the probability of survival at 1, 3, 5, and 8 years of follow-up was 90.58% (confidence interval [CI] 95%, 87.54-92.91), 72.51% (95%CI, 67.38-76.97), 53.23% (95%CI, 46.52-59.48), and 35.73% (95%CI, 27.72-43.80). In the reference population, these percentages were 91.93%, 75.63%, 59.6%, and 37.47%.
ConclusionsLong-term survival in elderly patients undergoing TAVI is influenced by postoperative mortality. In patients surviving the postoperative period, the probability of survival returns to a similar value to that in the general population of the same age, sex, and geographical area.
Keywords
Severe symptomatic aortic stenosis, in the absence of treatment, has a very poor prognosis. Aortic valve replacement surgery and transcatheter aortic valve implantation (TAVI) are the only treatments that have been shown to change the natural history of the disease.1
The TAVI procedure is changing the way severe aortic stenosis is treated. To date, scientific evidence has consistently demonstrated that this technique achieves at least the same 5-year survival rates as conventional open surgery in patients with intermediate or high surgical risk.2,3 In these groups, the current European recommendation guidelines propose percutaneous techniques as a first-line treatment for patients older than 75 years.4
Recently, 2 large multicenter clinical trials demonstrated that the probability of survival is similar at 1 and 2 years of follow-up in low-risk patients who have undergone surgery or TAVI.5,6 Thus, surgical risk has ceased to play a key role in the selection of the best treatment for patients with severe aortic stenosis. In fact, life expectancy, understood as the one that the patient would have had in the absence of valvular heart disease, has begun to be the first aspect to take into account.7
However, it is not known whether the probability of survival in patients undergoing TAVI returns to a similar value to that in the general noncardiac population. For many years, this technique was used exclusively in frail patients or in those with major comorbidities, which are situations that may compromise life expectancy. However, a sufficiently effective and safe treatment for valvular heart disease could lead to the recovery, at least in part, of life expectancy.
Some studies have described long-term survival in patients treated with TAVI.8,9 However, the results alone provide little information because the life expectancy of any population depends on a complex system of environmental and socioeconomic factors present in the region of residence. Gross domestic product, the health system, food habits, or temperature are only some of the many factors identified as having a proven impact on the life expectancy of the general population.10 Thus, there are significant differences even between industrialized countries. For example, in 2010, female life expectancy at birth in Spain and the United States was 85 years and 81 years, respectively, whereas at 65 years female life expectancy in Spain was almost 2 years higher.11
It is unknown if patients older than 75 years undergoing TAVI recover a survival similar to that of the general population. Our objective was to address this issue.
METHODSSelection of the TAVI sample and construction of the reference populationWe retrospectively selected all patients older than 75 years undergoing TAVI from January 2010 to April 2019 at the Hospital Universitario Central of Asturias (Principality of Asturias Ethics Committee, number 159/19). This tertiary hospital is the only public or private center that offers TAVI in this region and is the referral hospital for all patients needing this technique.
We constructed the reference population using mortality table data for the Principality of Asturias from the Spanish National Institute of Statistics (INE) stratified by age and sex. These data are available on the official INE website.12 More information on the INE can be consulted in .
Data collectionWe retrospectively collected all data relating to the preoperative, intraoperative, and postoperative periods from a digital database prospectively entered by the treating physician. The postoperative period was defined as the first 30 days of follow-up or as the discharge day in the event that this occurred later.
One of the researchers collected mortality-related data during follow-up by analyzing the information available in the medical records of all health centers and hospitals in the Principality of Asturias.
Primary objectivesPrimary objectives: a) to compare the survival curves of patients older than 75 years who underwent TAVI with those of the general population of the same age, sex, and geographic region; and b) to compare the survival curves of the patients in the TAVI sample who survived the postoperative period.
Statistical analysisQuantitative and categorical variables are expressed as mean±SD and No. (%), respectively.
To compare the survival curves of the TAVI sample with those of the general population of the same age and sex, we calculated observed survival, expected survival, and relative survival (RS): a) observed survival was defined as the real survival of the TAVI sample calculated using standard Kaplan-Meier analysis; b) expected survival was defined as survival of the reference population of exactly the same age, sex, and geographic region as the TAVI sample (ie, survival that the TAVI sample would have had in the absence of aortic valve disease). It was calculated using the Ederer II method, which has been the preferred method to calculate expected survival since 2011,13 using information on mortality rates provided by the INE for different age, sex, and geographic ranges.12 If expected survival was within the confidence interval of observed survival, we considered that there were no significant differences between the two; and c) RS was defined as the estimated survival that patients in the TAVI sample would have had under the theoretical and imaginary assumption that they could only die from a problem associated with their aortic valve disease.14,15 RS was obtained by calculating the ratio between the observed survival rate and the expected survival rate. An RS of 100% during the first year would imply that the aortic valve disease had been completely resolved using TAVI: however, an RS of 80% in the first year would imply that 20% (80%-100%) of patients would have died due to a problem associated with aortic valve disease.15 Thus, an RS confidence interval that included 100% of the patients would imply that there was no evidence of mortality caused by aortic valve disease and that TAVI had been completely effective in resolving the problem.14
One of the main advantages of using RS is that it identifies mortality exclusively due to the disease under study without requiring information on the cause of death.14
All analyses were conducted using the “strs”16 command of the STATA v.15.1 software package (STATA Corp, Texas, USA).
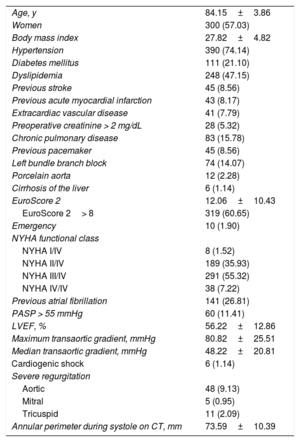
RESULTSSample descriptionDuring the study period, 526 patients older than 75 years underwent TAVI. Mean age was 84.15±3.86 years, 300 (57.03%) were women, and 319 patients (60.65%) had a EuroScore II of more than 8. The preoperative characteristics of the patients are shown in table 1. shows the prevalence in the Spanish population of some common comorbidities in patients with aortic stenosis. Until 2017, all patients were implanted with the CoreValve prosthesis (Medtronic, Minnesota, USA). Subsequently, the Evolut PRO prosthesis (Medtronic, Minnesota, USA) was used.
Characteristics of TAVI patients
| Age, y | 84.15±3.86 |
| Women | 300 (57.03) |
| Body mass index | 27.82±4.82 |
| Hypertension | 390 (74.14) |
| Diabetes mellitus | 111 (21.10) |
| Dyslipidemia | 248 (47.15) |
| Previous stroke | 45 (8.56) |
| Previous acute myocardial infarction | 43 (8.17) |
| Extracardiac vascular disease | 41 (7.79) |
| Preoperative creatinine > 2 mg/dL | 28 (5.32) |
| Chronic pulmonary disease | 83 (15.78) |
| Previous pacemaker | 45 (8.56) |
| Left bundle branch block | 74 (14.07) |
| Porcelain aorta | 12 (2.28) |
| Cirrhosis of the liver | 6 (1.14) |
| EuroScore 2 | 12.06±10.43 |
| EuroScore 2> 8 | 319 (60.65) |
| Emergency | 10 (1.90) |
| NYHA functional class | |
| NYHA I/IV | 8 (1.52) |
| NYHA II/IV | 189 (35.93) |
| NYHA III/IV | 291 (55.32) |
| NYHA IV/IV | 38 (7.22) |
| Previous atrial fibrillation | 141 (26.81) |
| PASP > 55 mmHg | 60 (11.41) |
| LVEF, % | 56.22±12.86 |
| Maximum transaortic gradient, mmHg | 80.82±25.51 |
| Median transaortic gradient, mmHg | 48.22±20.81 |
| Cardiogenic shock | 6 (1.14) |
| Severe regurgitation | |
| Aortic | 48 (9.13) |
| Mitral | 5 (0.95) |
| Tricuspid | 11 (2.09) |
| Annular perimeter during systole on CT, mm | 73.59±10.39 |
CT, computed tomography; LVEF, left ventricular ejection fraction; NYHA, New York Heart Association; PASP, pulmonary artery systolic pressure; TAVI, transcatheter aortic valve implant.
Values are expressed as No. (%) or mean±standard deviation.
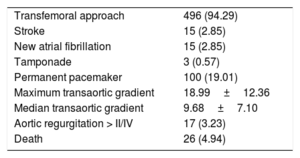
In total, 26 patients (4.94%) in the TAVI group died within the first 30 procedural days. The main characteristics and perioperative and postoperative complications are shown in table 2.
Operative and postoperative characteristics and complications
| Transfemoral approach | 496 (94.29) |
| Stroke | 15 (2.85) |
| New atrial fibrillation | 15 (2.85) |
| Tamponade | 3 (0.57) |
| Permanent pacemaker | 100 (19.01) |
| Maximum transaortic gradient | 18.99±12.36 |
| Median transaortic gradient | 9.68±7.10 |
| Aortic regurgitation > II/IV | 17 (3.23) |
| Death | 26 (4.94) |
Values are expressed as No. (%) or mean±standard deviation.
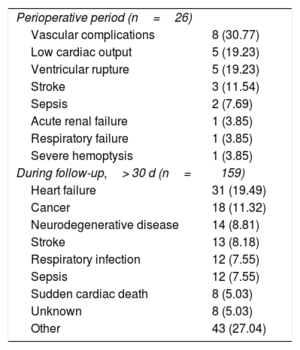
No patients were lost to follow-up. The mean follow-up of the censored patients in the TAVI group was 33.06 months. Of the total of 185 deaths, 159 occurred after the postoperative period. The main causes of death are shown in table 3.
Most frequent causes of death
| Perioperative period (n=26) | |
| Vascular complications | 8 (30.77) |
| Low cardiac output | 5 (19.23) |
| Ventricular rupture | 5 (19.23) |
| Stroke | 3 (11.54) |
| Sepsis | 2 (7.69) |
| Acute renal failure | 1 (3.85) |
| Respiratory failure | 1 (3.85) |
| Severe hemoptysis | 1 (3.85) |
| During follow-up,> 30 d (n=159) | |
| Heart failure | 31 (19.49) |
| Cancer | 18 (11.32) |
| Neurodegenerative disease | 14 (8.81) |
| Stroke | 13 (8.18) |
| Respiratory infection | 12 (7.55) |
| Sepsis | 12 (7.55) |
| Sudden cardiac death | 8 (5.03) |
| Unknown | 8 (5.03) |
| Other | 43 (27.04) |
Values are expressed as No. (%).
In the TAVI sample, cumulative survival at 1, 3, 5, and 8 years of follow-up were 86.1% (95%CI, 82.75-88.85), 68.92% (95%CI, 63, 90-73.39), 50.60% (95%CI, 44.19-56.66), and 33.96% (95%I, 26.35-41.71), respectively. In the reference population, cumulative survival was 91.96%, 75.63%, 59.65%, and 37.67%, respectively. Cumulative survival for each of the follow-up years is shown in table 4. Both survival curves are shown in figure 1.
Predicted survival and cumulative relative survival during each year of follow-up of the TAVI sample and the reference population
| Year of follow-up | Cumulative survival of the TAVI group, % (95%CI) | Cumulative survival in the reference group, % | Annual relative survival,* % (95%CI) |
|---|---|---|---|
| First year | 86.10 (82.75-88.85) | 91.96 | 93.63 (89.98-96.61) |
| Second year | 77.96 (73.78-81.56) | 83.84 | 99.01 (95.02-101.92) |
| Third year | 68.92 (63.90-73.39) | 75.63 | 97.87 (92.58-101.63) |
| Fourth year | 61.41 (55.81-66.51) | 67.56 | 99.09 (92.55-103.45) |
| Fifth year | 50.60 (44.19-56.66) | 59.65 | 94.01 (84.83-100.37) |
| Sixth year | 40.8 (33.77-47.69) | 52.37 | 92.37 (79.42-100.83) |
| Seventh year | 35.42 (27.96-42.92) | 45.19 | 97.84 (79.31-106.77) |
| Eighth year | 33.96 (26.35-41.71) | 37.67 | 112.12 (81.99-117.17) |
95%CI: 95% confidence interval; TAVI, transcatheter aortic valve implantation.
Survival curves of the TAVI sample compared with those of the general population. During the first year, the survival curve of the TAVI sample undergoes a marked decrease compared with that of the general population. Subsequently, they are very similar. 95% CI, 95% confidence interval; TAVI, transcatheter aortic valve implant.
During the first year of follow-up, RS showed that there was high mortality due to valvular heart disease: RS, 93.63% (95%CI, 89.98-96.61). In the remaining years, RS showed that there was no mortality due to aortic valve disease: in other words, expected survival was similar to observed survival. Figure 2 and table 4 show RS for each year of follow-up.
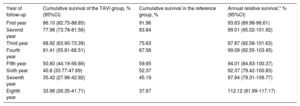
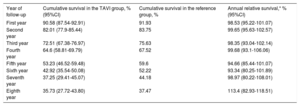
In the group of patients who survived the first 30 days, the survival curves were similar during most of the follow-up period. The survival curves are shown in figure 3. The probability of survival at 1, 3, 5, and 8 years in this TAVI group were 90.58% (95%CI, 87.54-92.91), 72.51% (95%CI, 67.38-76.97), 53.23% (95%CI, 46.52-59.48), and 35.73% (95%CI, 27.72-43.80), respectively. In the reference population, the probability of survival was 91.93%, 75.63%, 59.6%, and 37.47%, respectively. Cumulative survival for the TAVI sample and the reference population is shown in table 5.
Survival curves of patients in the TAVI sample surviving the first 30 days compared with those of the general population. The survival curve of the reference population is within the confidence interval of the survival curve of the TAVI group during most of the follow-up. This implies that the probability of survival is similar in both groups during most of the follow-up. 95%CI, 95% confidence interval; TAVI, transcatheter aortic valve implant.
Predicted survival and cumulative relative survival during each year of follow-up of patients surviving the postoperative period
| Year of follow-up | Cumulative survival in the TAVI group, % (95%CI) | Cumulative survival in the reference group, % | Annual relative survival,* % (95%CI) |
|---|---|---|---|
| First year | 90.58 (87.54-92.91) | 91.93 | 98.53 (95.22-101.07) |
| Second year | 82.01 (77.9-85.44) | 83.75 | 99.65 (95.63-102.57) |
| Third year | 72.51 (67.38-76.97) | 75.63 | 98.35 (93.04-102.14) |
| Fourth year | 64.6 (58.81-69.79) | 67.52 | 99.68 (93.1-106.06) |
| Fifth year | 53.23 (46.52-59.48) | 59.6 | 94.66 (85.44-101.07) |
| Sixth year | 42.92 (35.54-50.08) | 52.22 | 93.34 (80.25-101.89) |
| Seventh year | 37.25 (29.41-45.07) | 44.18 | 98.97 (80.22-108.01) |
| Eighth year | 35.73 (27.72-43.80) | 37.47 | 113.4 (82.93-118.51) |
95%CI: 95% confidence interval; transcatheter aortic valve implant.
During the first year of follow-up, RS showed low mortality due to valvular heart disease: RS, 98.53% (95%CI, 95.22-101.07). In the remaining years, RS showed no mortality due to aortic valve disease: in other words, expected mortality was the same as observed mortality. Table 5 shows the survival curves stratified by age groups (≤ 85 years and > 85 years) (see ). shows survival curves stratified by EuroSCORE ≥ 8 or < 8.
DISCUSSIONSevere aortic stenosis, in the absence of effective treatment, is associated with a life expectancy of less than 2 years from the onset of symptoms.17 However, no study has assessed whether the probability of survival in patients with aortic valvular heart disease undergoing TAVI returns to a similar value to that in the general population.
Because the life expectancy of a population largely depends on the geographic region of residence, we analyzed survival curves in a sample of patients receiving TAVI in a hospital and compared them with those in the general population of the same age, sex, and region.
After 1 year of follow-up, we found that the survival curves were similar. In fact, in the group of patients surviving the postoperative period, the confidence interval of their survival curve was within that of the reference population during most of the follow-up.
As can be seen from the lack of overlap of the confidence interval of the TAVI sample with that of the reference population, the probability of survival was lower in the TAVI group than that in the general population during most of the follow-up. However, RS varied over the entire follow-up. Increased mortality due to aortic valve disease was observed only during the first year, but this increase in initial mortality had an impact on survival throughout the entire follow-up. Thus, during the first year, RS was 93.6%, implying that 6.4% (93.6%-100%) of the 526 patients died during this year due to a problem directly associated with aortic stenosis.
Survival in this group of patients throughout the follow-up was affected by the insufficient development of reverse ventricular remodeling during the first months of follow-up and mainly by a perioperative mortality rate of almost 5%. Taking into account an average EuroSCORE II of 12, this observed mortality rate implies a risk-adjusted mortality rate of 0.41, which is approximately half of that expected.
Thus, in the group of patients surviving the postoperative period, the probability of survival of the TAVI sample was similar to that of the reference population during most of the follow-up. In addition, RS did not show evidence of increased mortality in any of the years of follow-up. Some studies have reported a perioperative mortality rate of less than 1%.5,6 This finding is indicative of a highly favorable situation in which it follows that severe aortic stenosis in elderly patients is curable using this technique and without repercussions on their long-term survival. Since life expectancy tables can be easily consulted on the INE website,12 these findings could be useful for decision-making on whether to perform invasive and expensive techniques in elderly patients.
Strengths and limitationsData from the TAVI sample were collected retrospectively. However, ideally, the TAVI sample should be compared with a random population of thousands of residents in the Principality of Asturias followed up over several years; subsequently, the individual data should be analyzed controlling for risk factors, comorbidities, socioeconomic factors, or even municipality. However, this scenario is not very probable and likely explains the lack of studies on these characteristics. In this study, we attempted to address this difficulty by using a novel method to calculate expected survival using data from the INE. Although the possibility of selection bias is reduced by the fact that there is only 1 implant center using TAVI in the Principality of Asturias, we recognize that this aspect could make it difficult to extrapolate the results.
Finally, we are aware that the patients in the TAVI sample may have had a higher rate of comorbidities than that in the general population, which could have led to reduced survival. Nevertheless, patients who are candidates for TAVI, although probably frail and with comorbidities, go through a specific selection process in which patients with end-stage disease are excluded for reasons of futility. These circumstances make it very difficult, if not impossible, to compare the probability of survival in a sample of patients with that of the general population. In this regard, the calculation of RS can shed light on the situation.14 This measure, which is frequently calculated in the setting of cancer, shows that TAVI prevents any death associated with severe aortic stenosis after the end of the postoperative period.
CONCLUSIONSThe survival curve of patients older than 75 years who undergo TAVI is influenced by postoperative mortality. In patients surviving the postoperative period, the probability of survival returns to a similar value to that of the general population. In this group of patients, TAVI prevents any death associated with severe aortic stenosis once the postoperative period is over.
CONFLICTS OF INTERESTC. Moris is a proctor for Medtronic.
- –
Severe aortic stenosis, in the absence of treatment, has a very poor prognosis. Although TAVI is able to change the natural course of the disease, it remains unknown whether the probability of survival returns to a similar value to that expected in the population without valvular heart disease.
- –
In elderly patients receiving TAVI surviving the postoperative period, the probability of long-term survival returns to a similar value to that in the general population of the same age, sex, and geographical area.
Supplementary data associated with this article can be found in the online version available at https://doi.org/10.1016/j.rec.2019.10.027


