The prognosis of patients with severe aortic stenosis, low aortic gradient and preserved ejection fraction is controversial. Our study analyzed the prognosis of these patients and its relation to pressure gradient and aortic valve flow.
MethodsWe performed a retrospective cohort study of 363 consecutive patients with severe aortic stenosis and preserved ejection fraction, divided into 4 groups, based on the presence of a systolic volume index greater or lower than 35mL/m2 and the presence of a mean aortic gradient greater or lower than 40mmHg. Group I: normal flow, high gradient (n=169, 47%); group II: normal flow, low gradient (n=98, 27%); group III: low flow, high gradient (n=54, 15%), and group IV: low flow, low gradient (n=42, 12%). The primary endpoint was overall mortality.
ResultsIndependent risk factors for mortality were age (hazard ratio=1.04; 95% confidence interval, 1.01-1.08) and atrial fibrillation (hazard ratio=2.21; 95% confidence interval, 1.24-3.94). Surgical treatment was associated with longer survival in all groups (hazard ratio=0.25; 95% confidence interval: 0.13-0.49). Mortality was higher in patients with low flow than in those with with normal flow (26.6% vs 13.6%; P=.004). The most favorable mean prognosis was found in group II (hazard ratio=0.4; 95% confidence interval, 0.2-0.9).
ConclusionsPatients with severe aortic stenosis, normal ejection fraction and low aortic flow have a worse prognosis. Analysis of aortic flow by Doppler echocardiography is useful in risk stratification and therapeutic decision-making in patients with aortic stenosis.
Keywords
.
IntroductionAortic stenosis (AS) is highly common in our environment and the incidence of this condition is on the rise due to the aging population. Currently, AS is the principal cause of valve replacement in Europe and the United States.1The clinical symptoms and severity of stenosis, which are generally assessed using echocardiography, are essential for providing indications for surgery in these patients. The parameters commonly used to define severity are aortic valve area (AVA)<1cm2 (or aortic valve area index<0.6cm2/m2), or a mean gradient>40mmHg.2 Based on the value of AVA, a substantial number of patients with severe AS have a low aortic gradient, despite normal ejection fraction (EF) values.3 Hachicha et al.4 reported that, in many patients, the low gradient is often due to a reduced systolic volume (SV). These patients probably have a higher afterload, and consequently, increased concentric cardiac remodelling, smaller ventricular cavities, and myocardial dysfunction, despite a normal EF, resulting in a lower SV and consequently a lower gradient.4–10 However, a low gradient is not equivalent to low aortic flow, since patients with low flow can have a high aortic gradient, and a significant number of patients with a low aortic gradient have normal SV and aortic flow.11–14 Debate continues on which mechanisms are involved in AS with a low gradient and normal EF, the prognosis of these patients, and the definition of severity of the AS based on AVA<1cm2. Many authors have highlighted the difficulties and possible errors in calculating AVA through Doppler echocardiography, as well as inconsistencies in the definition of severity based on AVA and aortic gradient, and have questioned whether these patients truly have severe AS, and propose a modification to the cut-off values for severity of AVA.12,13
In this study, we document the demographic characteristics, pathophysiological mechanisms, and prognosis of patients with severe AS and normal EF based on aortic valve flow and gradient.
MethodStudy PopulationOurs was a retrospective study carried out at the Hospital Universitario Son Espases. Using our database of echocardiographic results EchoPAC® (General Electric Healthcare, Waukesha, WI, United States) we reviewed all tests performed between January 2007 and February 2010, selecting patients with severe AS (AVA<1cm2) and preserved EF (EF≥50%). Patients with a suboptimal test result, moderate-severe aortic insufficiency, or mitral valvulopathy were excluded from the study. The follow-up protocol involved personal communications in medical consultations, review of digital medical histories, medical reports, and telephone interviews. This study was approved by the hospital research committee.
Clinical VariablesThe clinical information compiled included age, sex, tobacco use, body mass index, diagnosis of hypertension, diabetes mellitus, hypercholesterolemia, atrial fibrillation (AF), and coronary disease (defined as angina, myocardial infarction, angiographic evidence of coronary disease, percutaneous coronary intervention, and myocardial revascularization surgery).
Echocardiographic MeasurementsThe Doppler echocardiographic indexes of AS severity included maximum transvalvular velocity, maximum gradient, mean gradient, and aortic jet velocity-time integral. AVA was obtained using the standard continuity equation and was adjusted for body surface area. Systolic volume index (SVI) is the SV adjusted for body surface area and measured using Doppler in the left ventricular outflow tract.
Systemic vascular resistance, systemic arterial compliance, and valvuloarterial impedance were calculated using their respective formulas.5 In 16 patients, systolic blood pressure was not measured at the time of the echocardiogram. Left ventricle (LV) dimensions were measured in accordance with the guidelines of the American Society of Echocardiography (ASE) and adjusted for body surface area. Telediastolic and telesystolic volumes were calculated using the Teichholz volume method.15 LV mass and relative wall thickness were measured using the ASE-recommended formulas. Left ventricular ejection fraction (LVEF) was obtained in all patients using the Teichholz method and through visual estimation. Midwall fractional shortening and stroke work of the LV were calculated using standard formulas.15,16
Coronary AngiographyA coronary angiogram was performed in 259 patients (71.3%). Coronary disease was defined as the presence of stenosis≥50% of the left main coronary artery and/or stenosis≥70% of the epicardial coronary arteries.
Statistical AnalysisThe cohort of patients was divided into 4 groups based on the presence of normal or reduced transaortic flow (SVI>35mL/m2 or<35 mL/m2) and high or low gradient (mean gradient>40mmHg or<40mmHg), in accordance with current clinical practice guidelines. The following groups were thus defined: group I: normal flow, high gradient; group II: normal flow, low gradient; group III: low flow, high gradient; group IV: low flow, low gradient.
The results are expressed as means and 95% confidence intervals (95%CI), median and quartiles, or percentages. Differences among patient groups were analyzed using ANOVA or Kruskal-Wallis tests for continuous variables, and chi-square tests or Fisher's exact tests for categorical variables. The primary end-point of this study was overall mortality. Survival was assessed using Kaplan-Meier curves for each group. Differences among groups in terms of risk factors were determined using log rank tests. The effects of clinical and echocardiographic variables on survival were determined using Cox proportional hazards models, including aortic valve replacement as a time-dependent variable. All possible associated variables and those that resulted in a P-value<.2 in the univariate analysis were included in the multivariate analysis. We used SPSS statistical software for Windows®, version 15.0, for all statistical analyses.
ResultsOur study population included a total of 363 consecutive patients: 186 women and 177 men; median age, 77 [71-82] years. Patients were monitored for a median of 25.3 [14.8-33.2] months after inclusion in the study. Follow-up was not possible in 4 of the 363 patients (1.1%).
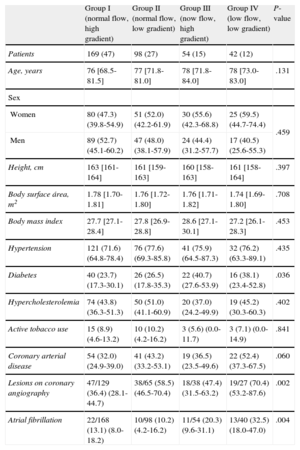
Table 1 shows the baseline characteristics of the study population. Patients with a low gradient (groups II and IV) had a greater frequency of coronary arterial disease, with the greatest difference observed between groups I and IV. There were no significant differences between groups in terms of age, sex, body mass index, body surface area, hypertension, tobacco use, or hypercholesterolemia. Patients with severe AS and low flow (groups III and IV) were older (78 years vs 76 years; P=.047), had a higher prevalence of diabetes and AF, and the proportion of women was higher (57.3% vs 42.7%; P=.167).
Baseline Characteristics of the Patients in our Study
| Group I (normal flow, high gradient) | Group II (normal flow, low gradient) | Group III (now flow, high gradient) | Group IV (low flow, low gradient) | P-value | |
| Patients | 169 (47) | 98 (27) | 54 (15) | 42 (12) | |
| Age, years | 76 [68.5-81.5] | 77 [71.8-81.0] | 78 [71.8-84.0] | 78 [73.0-83.0] | .131 |
| Sex | |||||
| Women | 80 (47.3) (39.8-54.9) | 51 (52.0) (42.2-61.9) | 30 (55.6) (42.3-68.8) | 25 (59.5) (44.7-74.4) | .459 |
| Men | 89 (52.7) (45.1-60.2) | 47 (48.0) (38.1-57.9) | 24 (44.4) (31.2-57.7) | 17 (40.5) (25.6-55.3) | |
| Height, cm | 163 [161-164] | 161 [159-163] | 160 [158-163] | 161 [158-164] | .397 |
| Body surface área, m2 | 1.78 [1.70-1.81] | 1.76 [1.72-1.80] | 1.76 [1.71-1.82] | 1.74 [1.69-1.80] | .708 |
| Body mass index | 27.7 [27.1-28.4] | 27.8 [26.9-28.8] | 28.6 [27.1-30.1] | 27.2 [26.1-28.3] | .453 |
| Hypertension | 121 (71.6) (64.8-78.4) | 76 (77.6) (69.3-85.8) | 41 (75.9) (64.5-87.3) | 32 (76.2) (63.3-89.1) | .435 |
| Diabetes | 40 (23.7) (17.3-30.1) | 26 (26.5) (17.8-35.3) | 22 (40.7) (27.6-53.9) | 16 (38.1) (23.4-52.8) | .036 |
| Hypercholesterolemia | 74 (43.8) (36.3-51.3) | 50 (51.0) (41.1-60.9) | 20 (37.0) (24.2-49.9) | 19 (45.2) (30.3-60.3) | .402 |
| Active tobacco use | 15 (8.9) (4.6-13.2) | 10 (10.2) (4.2-16.2) | 3 (5.6) (0.0-11.7) | 3 (7.1) (0.0-14.9) | .841 |
| Coronary arterial disease | 54 (32.0) (24.9-39.0) | 41 (43.2) (33.2-53.1) | 19 (36.5) (23.5-49.6) | 22 (52.4) (37.3-67.5) | .060 |
| Lesions on coronary angiography | 47/129 (36.4) (28.1-44.7) | 38/65 (58.5) (46.5-70.4) | 18/38 (47.4) (31.5-63.2) | 19/27 (70.4) (53.2-87.6) | .002 |
| Atrial fibrillation | 22/168 (13.1) (8.0-18.2) | 10/98 (10.2) (4.2-16.2) | 11/54 (20.3) (9.6-31.1) | 13/40 (32.5) (18.0-47.0) | .004 |
Values are expressed as means (95% confidence intervals) or median [interquartile range] or no/N (%).
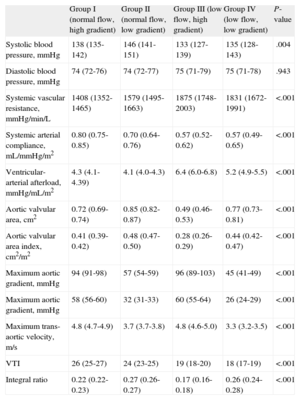
Table 2 displays the results of severity of AS, arterial afterload, and global afterload. By definition, groups I and III had higher gradients. Patients with a high gradient and low flow (group III) had lower AVA values, a lower AVA index, and a lower integral ratio, indicating more severe stenosis than in the remaining groups. Patients in group IV (low gradient and low flow) had more severe stenosis than those in group II, who had a low gradient but normal flow, despite the lower gradients observed in this group.
Indexes of Severity of Aortic Stenosis, Arterial Afterload, and Global Afterload
| Group I (normal flow, high gradient) | Group II (normal flow, low gradient) | Group III (low flow, high gradient) | Group IV (low flow, low gradient) | P-value | |
| Systolic blood pressure, mmHg | 138 (135-142) | 146 (141-151) | 133 (127-139) | 135 (128-143) | .004 |
| Diastolic blood pressure, mmHg | 74 (72-76) | 74 (72-77) | 75 (71-79) | 75 (71-78) | .943 |
| Systemic vascular resistance, mmHg/min/L | 1408 (1352-1465) | 1579 (1495-1663) | 1875 (1748-2003) | 1831 (1672-1991) | <.001 |
| Systemic arterial compliance, mL/mmHg/m2 | 0.80 (0.75-0.85) | 0.70 (0.64-0.76) | 0.57 (0.52-0.62) | 0.57 (0.49-0.65) | <.001 |
| Ventricular-arterial afterload, mmHg/mL/m2 | 4.3 (4.1-4.39) | 4.1 (4.0-4.3) | 6.4 (6.0-6.8) | 5.2 (4.9-5.5) | <.001 |
| Aortic valvular area, cm2 | 0.72 (0.69-0.74) | 0.85 (0.82-0.87) | 0.49 (0.46-0.53) | 0.77 (0.73-0.81) | <.001 |
| Aortic valvular area index, cm2/m2 | 0.41 (0.39-0.42) | 0.48 (0.47-0.50) | 0.28 (0.26-0.29) | 0.44 (0.42-0.47) | <.001 |
| Maximum aortic gradient, mmHg | 94 (91-98) | 57 (54-59) | 96 (89-103) | 45 (41-49) | <.001 |
| Maximum aortic gradient, mmHg | 58 (56-60) | 32 (31-33) | 60 (55-64) | 26 (24-29) | <.001 |
| Maximum trans-aortic velocity, m/s | 4.8 (4.7-4.9) | 3.7 (3.7-3.8) | 4.8 (4.6-5.0) | 3.3 (3.2-3.5) | <.001 |
| VTI | 26 (25-27) | 24 (23-25) | 19 (18-20) | 18 (17-19) | <.001 |
| Integral ratio | 0.22 (0.22-0.23) | 0.27 (0.26-0.27) | 0.17 (0.16-0.18) | 0.26 (0.24-0.28) | <.001 |
VTI, velocity-time integral.
Values are expressed as means (95% confidence interval).
Patients with normal flow and low gradient (group II) had less severe stenosis than the remaining groups. In this group, mean systolic pressure was higher than in the remaining groups. Patients with low flow (groups III and IV) had higher values of systemic vascular resistance and lower values of arterial compliance, suggesting a greater vascular afterload. Global afterload in the LV (valvuloarterial impedance) was also greater in low-flow patients, especially in those with a high gradient (group III).
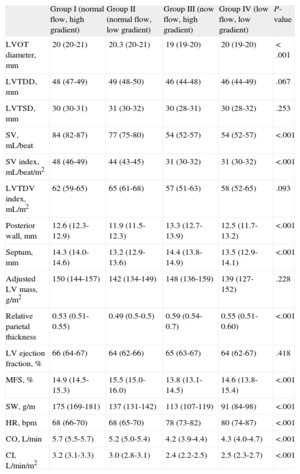
Table 3 compares LV geometry and systolic function parameters among the 4 groups. Patients with low flow (groups III and IV) had smaller ventricular cavities than those with normal flow (groups I and II) (left ventricular telediastolic diameter: 46mm vs 48mm; P=.012; left ventricular telediastolic diameter index: 57mL vs 63mL; P=.023). There were no differences among the distinct groups in terms of hypertrophy, and all showed concentric remodelling, which was more pronounced in patients with a high gradient and low flow (group III).
Echocardiographic Results of the Geometry and Systolic Function of the Left Ventricle
| Group I (normal flow, high gradient) | Group II (normal flow, low gradient) | Group III (now flow, high gradient) | Group IV (low flow, low gradient) | P-value | |
| LVOT diameter, mm | 20 (20-21) | 20.3 (20-21) | 19 (19-20) | 20 (19-20) | < .001 |
| LVTDD, mm | 48 (47-49) | 49 (48-50) | 46 (44-48) | 46 (44-49) | .067 |
| LVTSD, mm | 30 (30-31) | 31 (30-32) | 30 (28-31) | 30 (28-32) | .253 |
| SV, mL/beat | 84 (82-87) | 77 (75-80) | 54 (52-57) | 54 (52-57) | <.001 |
| SV index, mL/beat/m2 | 48 (46-49) | 44 (43-45) | 31 (30-32) | 31 (30-32) | <.001 |
| LVTDV index, mL/m2 | 62 (59-65) | 65 (61-68) | 57 (51-63) | 58 (52-65) | .093 |
| Posterior wall, mm | 12.6 (12.3-12.9) | 11.9 (11.5-12.3) | 13.3 (12.7-13.9) | 12.5 (11.7-13.2) | <.001 |
| Septum, mm | 14.3 (14.0-14.6) | 13.2 (12.9-13.6) | 14.4 (13.8-14.9) | 13.5 (12.9-14.1) | <.001 |
| Adjusted LV mass, g/m2 | 150 (144-157) | 142 (134-149) | 148 (136-159) | 139 (127-152) | .228 |
| Relative parietal thickness | 0.53 (0.51-0.55) | 0.49 (0.5-0.5) | 0.59 (0.54-0.7) | 0.55 (0.51-0.60) | <.001 |
| LV ejection fraction, % | 66 (64-67) | 64 (62-66) | 65 (63-67) | 64 (62-67) | .418 |
| MFS, % | 14.9 (14.5-15.3) | 15.5 (15.0-16.0) | 13.8 (13.1-14.5) | 14.6 (13.8-15.4) | <.001 |
| SW, g/m | 175 (169-181) | 137 (131-142) | 113 (107-119) | 91 (84-98) | <.001 |
| HR, bpm | 68 (66-70) | 68 (65-70) | 78 (73-82) | 80 (74-87) | <.001 |
| CO, L/min | 5.7 (5.5-5.7) | 5.2 (5.0-5.4) | 4.2 (3.9-4.4) | 4.3 (4.0-4.7) | <.001 |
| CI, L/min/m2 | 3.2 (3.1-3.3) | 3.0 (2.8-3.1) | 2.4 (2.2-2.5) | 2.5 (2.3-2.7) | <.001 |
CI, cardiac index; CO, cardiac output; HR, heart rate; LV, left ventricular; LVOT, left ventricular outflow tract; LVTDD, left ventricular telediastolic diameter; LVTDV, left ventricular telediastolic volume; LVTSD, left ventricular telesystolic diameter; MFS, midwall fractional shortening; SV, systolic volume; SW, stroke work.
Posterior wall and septum thickness in diastole.
Values are expressed as means (95% confidence interval).
We observed no differences among groups in terms of EF, although midwall fractional shortening was lower in patients with low flow and high gradient (group III) and higher in patients with normal flow and low gradient (group II). Patients with low flow (groups III and IV) also had lower values for stroke work, cardiac output, and cardiac index, with a compensatory increase in heart rate. Globally, SVI was lower in patients with AF (38.0mL/m2 [95%CI, 35.2-40.9mL/m2] vs 43.0mL/m2 [95%CI, 41.9-44.0mL/m2). When analysis was performed by patient group, only group IV was not significantly different when patients with and without AF were compared (group I: 43.8mL/m2 [95%CI, 37.8-51.1mL/m2] vs 47.0mL/m2 [95%CI, 41.0-52.8mL/m2]; group II: 37.0mL/m2 [95%CI, 36.0-44.4mL/m2] vs 44.0mL/m2 [95%CI, 38.7-48.2mL/m2]; group III: 28.1mL/m2 [95%CI, 27.0-32.0mL/m2] vs 32.0mL/m2 [95%CI, 29.0-34.0mL/m2]; group IV: 31.0mL/m2 [95%CI, 26.1-33.5mL/m2) vs 32.0mL/m2 (95%CI, 29.2-34.0mL/m2]).
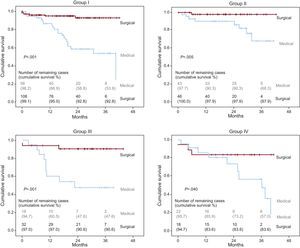
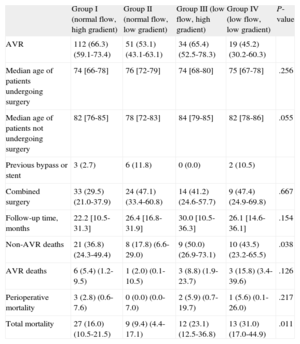
Table 4 summarizes the clinical follow-up for all 4 groups. A total of 216 patients (60.2%) underwent aortic valve replacement, with a mean postoperative follow-up of 20.9 [11.2-29.6] months. The median follow-up in patients receiving medical treatment was 20.1 [9.2-30.9] months. Patients who underwent surgery were significantly younger in all groups. Patients with a low gradient (groups II and IV) underwent fewer surgical interventions than did patients with a high gradient (50.7% vs 65.8%; P=.005). During follow-up, 61 patients died (16.8%). The mortality rate in patients who underwent surgery was 6.0% (13 out of 216) as compared to 33.6% (48 out of 143) of those treated using a conservative approach. Patients with low flow (groups III and IV) had greater mortality rates than did patients with normal flow (total mortality: 26.6% vs 13.6%; P=.004). In patients who underwent surgery, mortality was lower in all 4 groups than in those who received conservative treatment (Figure). Patients in group II had the lowest mortality rate during the follow-up period, and this difference was even larger in patients who underwent surgery. Six of the surgical patients died during the postoperative period.
Clinical Results
| Group I (normal flow, high gradient) | Group II (normal flow, low gradient) | Group III (low flow, high gradient) | Group IV (low flow, low gradient) | P-value | |
| AVR | 112 (66.3) (59.1-73.4) | 51 (53.1) (43.1-63.1) | 34 (65.4) (52.5-78.3) | 19 (45.2) (30.2-60.3) | |
| Median age of patients undergoing surgery | 74 [66-78] | 76 [72-79] | 74 [68-80] | 75 [67-78] | .256 |
| Median age of patients not undergoing surgery | 82 [76-85] | 78 [72-83] | 84 [79-85] | 82 [78-86] | .055 |
| Previous bypass or stent | 3 (2.7) | 6 (11.8) | 0 (0.0) | 2 (10.5) | |
| Combined surgery | 33 (29.5) (21.0-37.9) | 24 (47.1) (33.4-60.8) | 14 (41.2) (24.6-57.7) | 9 (47.4) (24.9-69.8) | .667 |
| Follow-up time, months | 22.2 [10.5-31.3] | 26.4 [16.8-31.9] | 30.0 [10.5-36.3] | 26.1 [14.6-36.1] | .154 |
| Non-AVR deaths | 21 (36.8) (24.3-49.4) | 8 (17.8) (6.6-29.0) | 9 (50.0) (26.9-73.1) | 10 (43.5) (23.2-65.5) | .038 |
| AVR deaths | 6 (5.4) (1.2-9.5) | 1 (2.0) (0.1-10.5) | 3 (8.8) (1.9-23.7) | 3 (15.8) (3.4-39.6) | .126 |
| Perioperative mortality | 3 (2.8) (0.6-7.6) | 0 (0.0) (0.0-7.0) | 2 (5.9) (0.7-19.7) | 1 (5.6) (0.1-26.0) | .217 |
| Total mortality | 27 (16.0) (10.5-21.5) | 9 (9.4) (4.4-17.1) | 12 (23.1) (12.5-36.8) | 13 (31.0) (17.0-44.9) | .011 |
AVR, aortic valve replacement.
Values are expressed as (%) (95% confidence interval) or median [interquartile range].

Survival curves for all 4 groups based on treatment type. Significance values refer to the comparison between types of treatment: medical vs surgical. Group I, normal flow, high gradient; Group II, normal flow, low gradient; Group III, low flow, high gradient; Group IV, low flow, low gradient.
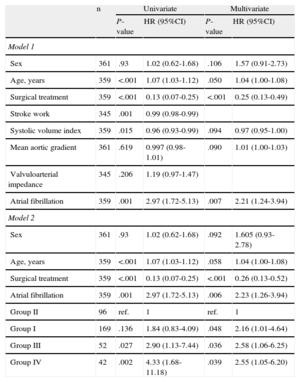
Table 5 shows the predictors for overall mortality in the univariate and multivariate analyses. The factors associated with an increase in mortality in the univariate analysis were age, medical treatment, SVI, stroke work, and AF, but not mean gradient or valvuloarterial impedance.
Univariate and Multivariate Analyses of Predictors of Mortality
| n | Univariate | Multivariate | |||
| P-value | HR (95%CI) | P-value | HR (95%CI) | ||
| Model 1 | |||||
| Sex | 361 | .93 | 1.02 (0.62-1.68) | .106 | 1.57 (0.91-2.73) |
| Age, years | 359 | <.001 | 1.07 (1.03-1.12) | .050 | 1.04 (1.00-1.08) |
| Surgical treatment | 359 | <.001 | 0.13 (0.07-0.25) | <.001 | 0.25 (0.13-0.49) |
| Stroke work | 345 | .001 | 0.99 (0.98-0.99) | ||
| Systolic volume index | 359 | .015 | 0.96 (0.93-0.99) | .094 | 0.97 (0.95-1.00) |
| Mean aortic gradient | 361 | .619 | 0.997 (0.98-1.01) | .090 | 1.01 (1.00-1.03) |
| Valvuloarterial impedance | 345 | .206 | 1.19 (0.97-1.47) | ||
| Atrial fibrillation | 359 | .001 | 2.97 (1.72-5.13) | .007 | 2.21 (1.24-3.94) |
| Model 2 | |||||
| Sex | 361 | .93 | 1.02 (0.62-1.68) | .092 | 1.605 (0.93-2.78) |
| Age, years | 359 | <.001 | 1.07 (1.03-1.12) | .058 | 1.04 (1.00-1.08) |
| Surgical treatment | 359 | <.001 | 0.13 (0.07-0.25) | <.001 | 0.26 (0.13-0.52) |
| Atrial fibrillation | 359 | .001 | 2.97 (1.72-5.13) | .006 | 2.23 (1.26-3.94) |
| Group II | 96 | ref. | 1 | ref. | 1 |
| Group I | 169 | .136 | 1.84 (0.83-4.09) | .048 | 2.16 (1.01-4.64) |
| Group III | 52 | .027 | 2.90 (1.13-7.44) | .036 | 2.58 (1.06-6.25) |
| Group IV | 42 | .002 | 4.33 (1.68-11.18) | .039 | 2.55 (1.05-6.20) |
95%CI, 95% confidence interval; Group I, normal flow and high gradient; Group II, normal flow and low gradient; Group III, low flow and high gradient; Group IV, low flow and low gradient; HR, hazard ratio (represents the increase in mortality per unit increase in the variable); ref., reference category.
In the multivariate analysis, the independent risk factors found were age and AF, whereas surgical treatment (aortic valve replacement with or without revascularization) significantly reduced mortality (HR=0.25; 95%CI, 0.13-0.49). Sex, SVI, and mean aortic gradient failed to reach statistical significance, although the results tended to indicate that a higher mortality rate was associated with male sex, decreased SVI, and increased gradient. Stroke work, valvuloarterial impedance, and AVA were closely correlated with SVI (r≈0.9) and were not included in the model 2.
In model 2, differences were assessed between the 4 different study groups. Group II (low gradient, normal flow) had the lowest observed mortality rate (HR=0.4; 95%CI, 0.2-0.9; P=.02). We found no interaction between the variables of patient group and surgical intervention.
Hypertension, diabetes mellitus, coronary arterial disease, concomitant coronary revascularization surgery, systemic arterial compliance, systemic vascular resistance, EF, midwall fractional shortening, relative wall thickness, and cardiac output were not significantly related to mortality.
DiscussionThe most relevant findings of our study are that in patients with severe AS (defined as an AVA<1cm2) and normal EF, decreased aortic valve flow is an indicator of a poorer prognosis, and that surgical treatment reduces mortality rates in all study groups (Figure).
Low Flow Aortic StenosisOur study showed that 27% of patients had low flow AS, which is in agreement with previous publications.4,6,13 In our sample, 56% of patients with low flow had a high gradient (group III), which confirms that low flow is not synonymous with low aortic gradient. Our results reaffirm the previous hypothesis4–10 that these patients with severe AS and low flow have a greater afterload, resulting from the combination of valvular obstruction and increased peripheral resistance, which would produce increased concentric ventricular remodelling and myocardial dysfunction.
As in past studies,14 we observed 2 clearly differentiated groups of low aortic flow; one with less severe cases of stenosis and low gradients (group IV) and another with a greater severity of valvular obstruction and high gradients (group III). In both groups, we observed a decrease in SV and a worse prognosis than in other patients with severe AS and normal flow. In this context, both low-flow groups had a higher prevalence of AF than did patients with normal flow rates. AF may reflect more advanced disease, given its predictive value in the multivariate analysis, in addition to the fact that the loss in atrial contraction can reduce ventricular filling and contribute to reducing cardiac output. Globally, patients with AF had a lower SVI (38 vs 43). In a previous study, AF was associated with decreased survival following surgery in patients with severe AS and ventricular dysfunction.17 In a more recent study,18 asymptomatic patients with severe AS and normal EF (and exclusion of patients with AF), those with low flow had a significantly worse prognosis during follow-up. In our study, AF acted as an independent risk factor for mortality.
Group IV patients (low flow and low gradient) who underwent surgery had a lower survival rate than group III patients undergoing surgery (low flow and high gradient). Group III patients had critical AS, and the decrease in contractile function and lower SV may be correlated with the severity of valvular obstruction, whereas the results in group IV (with less severe stenosis) suggest the coexistence of other factors in addition to valvular obstruction. In our study population, and similar to the study by Clavel et al.,19 coronary arterial disease was significantly more prevalent in this group. Group IV constituted a more heterogeneous group with greater comorbidity (age, diabetes, ischemic heart disease, AF...), with a tendency for a higher overall mortality rate, fewer indications for surgery, and inferior surgery results compared with the remaining groups. On a possibly related topic, Hermann et al.20 described a greater degree of myocardial fibrosis in the subendocardium and decreased longitudinal function (calculated using 2-dimensional strain) in patients with low flow and a low gradient, anomalies which were irreversible following the aortic valve replacement, and which were considered to be the cause of the worse postoperative results in these patients. Recently, in a prospective study, Adda et al.21 also observed a severe deterioration in longitudinal function of the left ventricle using 2-dimensional strain in patients with a low gradient and low flow.
Severe Low-Gradient Aortic StenosisIn our study, 39% of patients had severe low gradient AS. Most of our patients with low gradients had normal aortic flow (70%; group II). These patients had a less severe degree of stenosis and reduced ventricular remodelling with better indexes of heart function, and consequently a better prognosis, than other patients from the remaining groups. In patients with severe AS and low gradient, 30% had low flow (group IV, 12% of all patients with AS) and had a worse prognosis than those with a low gradient and normal flow (group II) and had a similar prognosis to patients with high gradients. These findings are in agreement with those of Dumesnil et al.14 and differ from those of a study by Jander et al.,22 in which patients with severe AS, low gradient, and normal or low aortic flow had a similar prognosis to that of patients with moderate AS.In our study, as in previous publications, the surgery rate in patients with a low gradient was lower,10,14,22 possibly due to the clinical perception of less severe AS. Our results corroborate the finding that a low aortic gradient does not exclude the possibility of severe AS, as well as the benefits of surgery in these patients, regardless of the aortic gradient value.10,14,18,23-25
Clinical ImplicationsOur study shows that severe AS with low aortic flow results in a worse prognosis than severe AS with normal flow. Another important finding was the higher prevalence of AF in patients with low flow, which also has prognostic value.
This study confirms the benefits of valve replacement surgery in all symptomatic patients with severe stenosis (AVA<1cm2, according to current guidelines) regardless of aortic gradient. Importantly, most of the patients in this study had an AVA<0.8cm2, and only group II patients (low gradient and normal flow) tended to have an AVA>0.8cm2 (Table 2).
Group II had less severe stenosis and a better prognosis than the remaining groups in our study. Several publications on this topic have proposed a readjustment of the cut-off values for defining the severity of stenosis,13,22 suggesting that these patients in particular be classified as having moderate/severe stenosis.26 However, as our study has shown, this group also benefits from valve replacement surgery. This is a borderline group that is the subject of much debate. In these patients, careful clinical evaluation of symptoms and/or patient stratification using additional tests such as ergometry and aortic calcification score are essential.
Study LimitationsThe primary limitation of our study is its retrospective design and the lack of randomization for surgical treatment, although all patients were referred to surgery due to the presence of symptoms following a medical/surgical evaluation.
The patients that did not undergo surgery formed a heterogeneous group. Surgery was not considered in many of these patients due to the presence of comorbidities that may not have been properly reflected in our study (such as advanced age, quality of life, and cognitive deterioration). In other patients, the symptoms may have derived from a noncardiac origin, or the AS may have been considered nonsevere. Some patients also refused surgery when offered. Nevertheless, we believe that these limitations reflect the reality of daily clinical practice and the management of patients with severe AS in our environment.
Finally, we would like to highlight the importance of correctly measuring aortic gradient (which may be underestimated in group II and IV patients) and SVI, and therefore, of careful measurement of the left ventricular outflow tract and velocity-time integral using Doppler echocardiography,27 which is even more important in patients with AF, given the different R-R interval.28 The retrospective design of our study implies that the values may have been obtained with these potential errors. However, we believe that the difference in prognosis between groups II and IV would rule out the possibility that this is an artificial calculation based on improperly calculated SV.
ConclusionsOur study demonstrates a worse prognosis of AS in the presence of low flow and normal EF. These results suggest that an analysis of aortic flow using Doppler echocardiography (SVI) may be useful for risk stratification and decision making on treatment in patients with AS.
Conflicts of interestNone declared.